Translate this page into:
Mathematical modelling and numerical simulation of two-phase gas-liquid flows in stirred-tank reactors
⁎Corresponding author at: National Technical University of Athens, School of Chemical Engineering, Zografou Campus, 15780 Athens, Greece. n.markatos@ntua.gr (N.C. Markatos)
-
Received: ,
Accepted: ,
This article was originally published by Elsevier and was migrated to Scientific Scholar after the change of Publisher.
Abstract
This paper presents the mathematical modelling and numerical simulation of the turbulent, two-phase flow of liquid and gas in a gas-induced agitated stirred-tank reactor, using Computational Fluid Dynamics (CFD) techniques. The reactor used as an application demonstration of the developed model is the ozone-induced one, first designed and modeled by Yang et al. (1999). A three-dimensional (3D), transient, Euler-Euler two-phase flow model is developed and used to investigate the turbulent flow and mixing of liquid and bubbles in the stirred-tank reactor, applying the sliding mesh approach. Turbulence is simulated by means of several available models, the Renormalization Group (RNG) k-ε model being the one finally recommended as the most appropriate of the ones studied, for the present application. Two-way coupling between the two phases is modeled by means of appropriate inter-phase interaction relations. The study focused on bubbles of one size group (mean aerodynamic diameter of 2.5E-03 m), but it is easily extended to any number of sizes. It is concluded that the predicted overall flow field pattern and the mixing of both phases around the two blades of the simulated baffled stirred vessel, as well as inside and outside of the main tube of the reactor, are physically plausible, appear reasonably accurate, and are, therefore, satisfying.
Keywords
Computational Fluid Dynamics
Two-phase flow
Dispersed flow
Reactor mixing
Sliding mesh
Baffled stirred-tank reactor
1 Introduction
Multi-phase flows are involved in many industrial processes, in various fields such as chemical, environmental and power engineering. Stirred-tank reactors find a wide application range in the chemical industry from pilot plant to full-scale production. Examples include but are not limited to:
-
Homogeneous liquid-phase reactions
-
Heterogeneous gas-liquid reactions
-
Heterogeneous liquid-liquid reactions
-
Heterogeneous solid-liquid reactions
-
Heterogeneous gas-solid-liquid reactions
An ozone-induced agitated reactor has been found to be very effective in degrading waste in industrial wastewater treatment units (i.e. activated sludge reactors) and in enzyme technology. The presence of the draft tube inside the reactor that increases significantly the residence time of ozone, as well as the turbulence generated by the two 45° pitch-blades result in the efficient mixing of both phases. The stirred tank reactor significantly promotes the ozone utilization rate up to 96% from the conventional rate of 60% above the onset speed.
The detailed analysis and investigation of multi-phase flows is of crucial importance for the optimum and safe design and control of those processes. Development of a detailed fluid dynamic model, that describes a process such as the two-phase flow in a stirred-tank reactor, will provide useful information about the mass, momentum and energy distributions, allowing for the complex interaction between the two phases and the rotational movement inside the mixing vessel. For this purpose, this study is focused on the mathematical modelling and numerical simulation of the two-phase flow of liquid and ozone-bubbles in a gas-induced baffled stirred-tank reactor.
Although considerable work (e.g. Spalding, 1978; Markatos and Moult, 1979; Markatos, 1983; Ranade, 2002; Chahed et al., 2003) has already been published on multi-phase flows there are innumerable details that must be addressed (e.g. numerical schemes, turbulence models, rotating grids, interphase interactions, etc.) before a fully trustworthy procedure is established. The purpose of this paper is to contribute towards that aim, by optimizing the finite-domain numerical scheme to be used, by choosing the most appropriate for the problems considered turbulence model and by checking and improving the sliding grid technique.
1.1 The physical problem considered and the assumptions made
The reactor considered in this study, as an application to demonstrate the design potential of the present mathematical model, consists of a cylindrical baffled vessel with two 45o pitch-blade turbines (impellers), enclosed inside a draft tube (Table 1) and (Fig. 1). More details of the geometry may be found in Yang et al. (1999, 2000), who designed and first modeled the aforementioned reactor. The rotational speed of the impellers tested in this study was 1200 rpm and the overall real time simulated was 3 s.
Reactor
Length
Z = 0.7 m
Radius
Y = 0.085 m
Axis
Length
Z = 0.7 m
Diameter
Y = 0.005714 m
Draft tube
Length
Z = 0.12 m
Width
Y = 0.005 m
Radius
Y = 0.045 m
Height from bottom
Z = 0.075 m
Baffles
Dimensions
ZxY = 0.12*0.004 m2
1st Impeller
Length
Z = 0.0075 m
Radius
Y = 0.011429 m
Height from bottom
Z = 0.075 m
2st Impeller
Length
Z = 0.0075 m
Radius
Y = 0.011429 m
Height from bottom
Z = 0.135 m
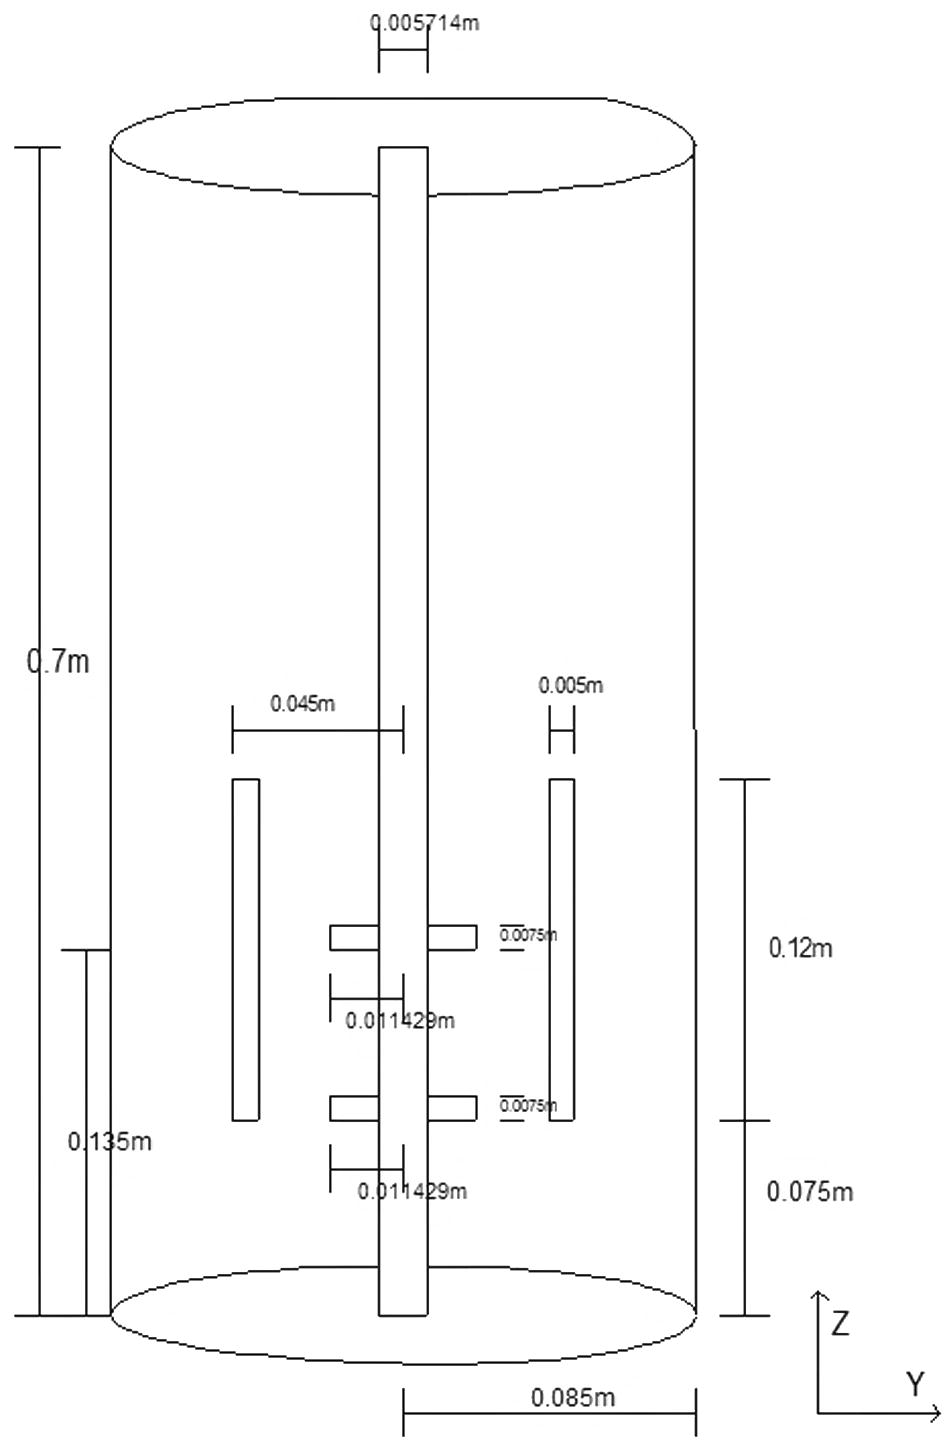
Internal and external view of the reactor.
The assumptions used in the present work are the following: a) each phase is a continuum, b) the two phases are interdispersed and are coupled by the interphase friction, c) the fluids (liquid-gas) are considered Newtonian and incompressible, d) the flow takes place under isothermal conditions (constant liquid and ozone properties at T = 298 °K and P = 1 atm and adiabatic walls), e) there is no phase change, f) the bubbles are considered spherical, monodispersed in one size group (mean AED 2.5E-03 m); and, finally g) there is no reaction taking place. It must be mentioned that these assumptions are made for simplicity, convenience and for saving computer time and do not represent limitations of the model which is general (apart of course from the first two that are prerequisites for the mathematical formulation).
Moreover, for an air-water system, fluid dynamics is relatively insensitive to the bubble size distribution, since the terminal rise velocity of air-bubbles in water is fairly invariant with the bubble diameter (for the range of 3 mm to 8 mm) (Ranade, 2002).
1.2 Mathematical modelling
1.2.1 The governing differential equations and the dispersed-bubbles drag model
Mathematical modelling consists of the Navier–Stokes equations (N-S) and the continuity equation for a multi-phase 3D, turbulent fluid flow. The method employed for the discretization of the differential equations follows the so called “control volume interspersed–phase slip algorithm (IPSA)” approach (Spalding, 1978; Markatos, 1986, 1989; Karadimou and Markatos, 2012). Each phase is treated as a continuum in the control volume under consideration. The phases share the control volume and they may, as they move within it, interpenetrate. The control volume can be regarded as containing a volume fraction of each phase (Ri), so that for i phases:
The general form of the governing differential conservation equations of each phase is presented in a compact form as follows (Markatos, 1986, 1993; Theologos et al., 1996):
P, is the pressure, which is regarded as being ‘shared’ between the phases;
Γφi, within-phase diffusion coefficient;
Sφi, within-phase source term per unit volume;
Ri, the volume fraction of each phase;
ρi, the density of each phase;
Fbi, the gravitational force: , and
subscript i refers to each phase (i = 1 for water, i = 2 for gas)
The frictional force
per unit volume at the water-bubbles interphase is given by Ishii and Mishima (1984):
Vslip the relative velocity between the two phases (slip velocity);
dg the bubbles diameter taken as 2.5E-03 m;
ρw the water density;
CD the inter-phase friction coefficient calculated from the empirical correlation (Kuo and Wallis 1988):
1.2.2 Boundary conditions
At the gas inlet a Dirichlet boundary condition is applied for the second phase (gas), by setting a uniform velocity (10 m/s) in the flow direction. The surface of the agitator and the two blades are rotating at 1200 ppm.
At the walls of the reactor the “logarithmic wall-functions” are applied (Launder and Spalding, 1974). The walls are assumed adiabatic. At the outlet the assumption is made that gas may be exhausting (or gas may be entering from) to the surrounding atmosphere. This is achieved by setting , where P is the pressure at the near-outlet nodes and Pe is the external (atmospheric) pressure, c is a coefficient, the reciprocal of the flow resistance at the outlet. Cyclic boundary conditions are imposed along the east and west boundaries of the integration domain, enabling us to simulate only a sector of the whole cylinder.
1.2.3 Turbulence modelling
Bubble induced turbulence plays an important role in the study of bubble-driven liquid flow (Feng et al., 2015; Sokolichin and Lapin, 2004).
Turbulent flow of the carrier fluid (water) is simulated in the present work applying several Reynolds- averaged Navier-Stokes (RANS) models, namely the standard k-ε, the k-ω, the RNG k-ε model and the algebraic-stress models.
Bubbles are assumed to be transported and dispersed due to the turbulence of the carrier fluid (water), while their movements do not affect the water-flow turbulence (one-way coupling).
After many laborious trials it appears that the RNG k-ε and the algebraic-stress models lead to the most physically plausible results .The former model was chosen for the presented simulations, as producing the most physically plausible results at the least computational cost. This model is as follows (Yakhot and Orszag, 1986): where: is the kinematic turbulence viscosity and the empirical parameters of the model are: , CD = 1.0, , , , , , , , and
The strain-dependent modification to improves the accuracy of the RNG-kε model in flows with large strain rates. In the above modification is the fixed point for homogeneously strained turbulent flows and is a constant which was evaluated in order to yield a von Karman constant of κ = 0.4.
1.2.4 Computational procedure
The equations are discretized by the finite volume method and solved by the IPSA algorithm1 (Spalding, 1978; Markatos, 1986) embodied in the CFD code PHOENICS2 (Spalding, 1981). A fully implicit method is employed for the numerical solution. The convection terms of all the conservation equations are discretized by the van Leer numerical scheme. The diffusion terms in both models are discretized by the central-differencing scheme. The first-order fully implicit scheme is used for time discretization.
1.2.5 The sliding/shearing grid
The flow field inside the stirred tank is intrinsically unsteady due to the movement of the impeller relative to the static wall and the baffles. Therefore, a sliding mesh interface must be employed to link the inner rotating region, containing the impeller, with the stationary outer domain. According to the sliding mesh approach (Luo et al., 1993) the computational grid is divided into two parts, one moving with the impeller to account for the relative motion of the rotating impeller and the static wall baffles, while the other one is fixed. More recent relative work is given in Bazilevs et al. (2011), Petit et al. (2009), Steijl and Barakos (2008), Blades and Marcum (2007), Fenwick and Allen (2006). The two meshes interact along a common surface of slip, which is defined by artificial boundary faces. The moving mesh is allowed to shear and slide successively relative to the stationary mesh along the interface and one-to-one matching of the cell faces along the interface is required throughout the calculation. The cells of the impeller region adjacent to the interface are allowed to deform. Great care is required as the sliding-mesh calculations depend on the intersection calculations between the stationary and the rotating volumes. The method allows a period of shear deformation in cells adjacent to the interface, followed by a slip in cell connectivity. The flow variables at the grid slip surfaces on the interphase between the rotating and stationary domains are obtained by “flux-based” conservative interpolation. Control volumes on either side of the grid slip surface can be split and merged into temporary fictitious control cells to match their counterparts on the opposite side. A numerical solver is applied sequentially to both grids until the required convergence is obtained. Although this procedure cannot be proved to be perfectly conservative and despite the substantially long runtimes required, it appears to be fully operative and useful for practical computations.
2 Results
2.1 Numerical solution grid- and time- step independency
For the numerical solution a multi-block, non-uniform grid was constructed. Spatial grid-independency was tested applying four different grid-cell densities (51.000, 408.000, 1.377.000, 3.264.000 cells). Three different, gradually reduced, time steps (0.0003, 0.00015, 0.0001 s) were used for each grid, in order to specify, which of them ensures time independency in the numerical solution. In each time step variable numbers of iterations (10, 20, 40) were tested (see Figs. 2 and 3).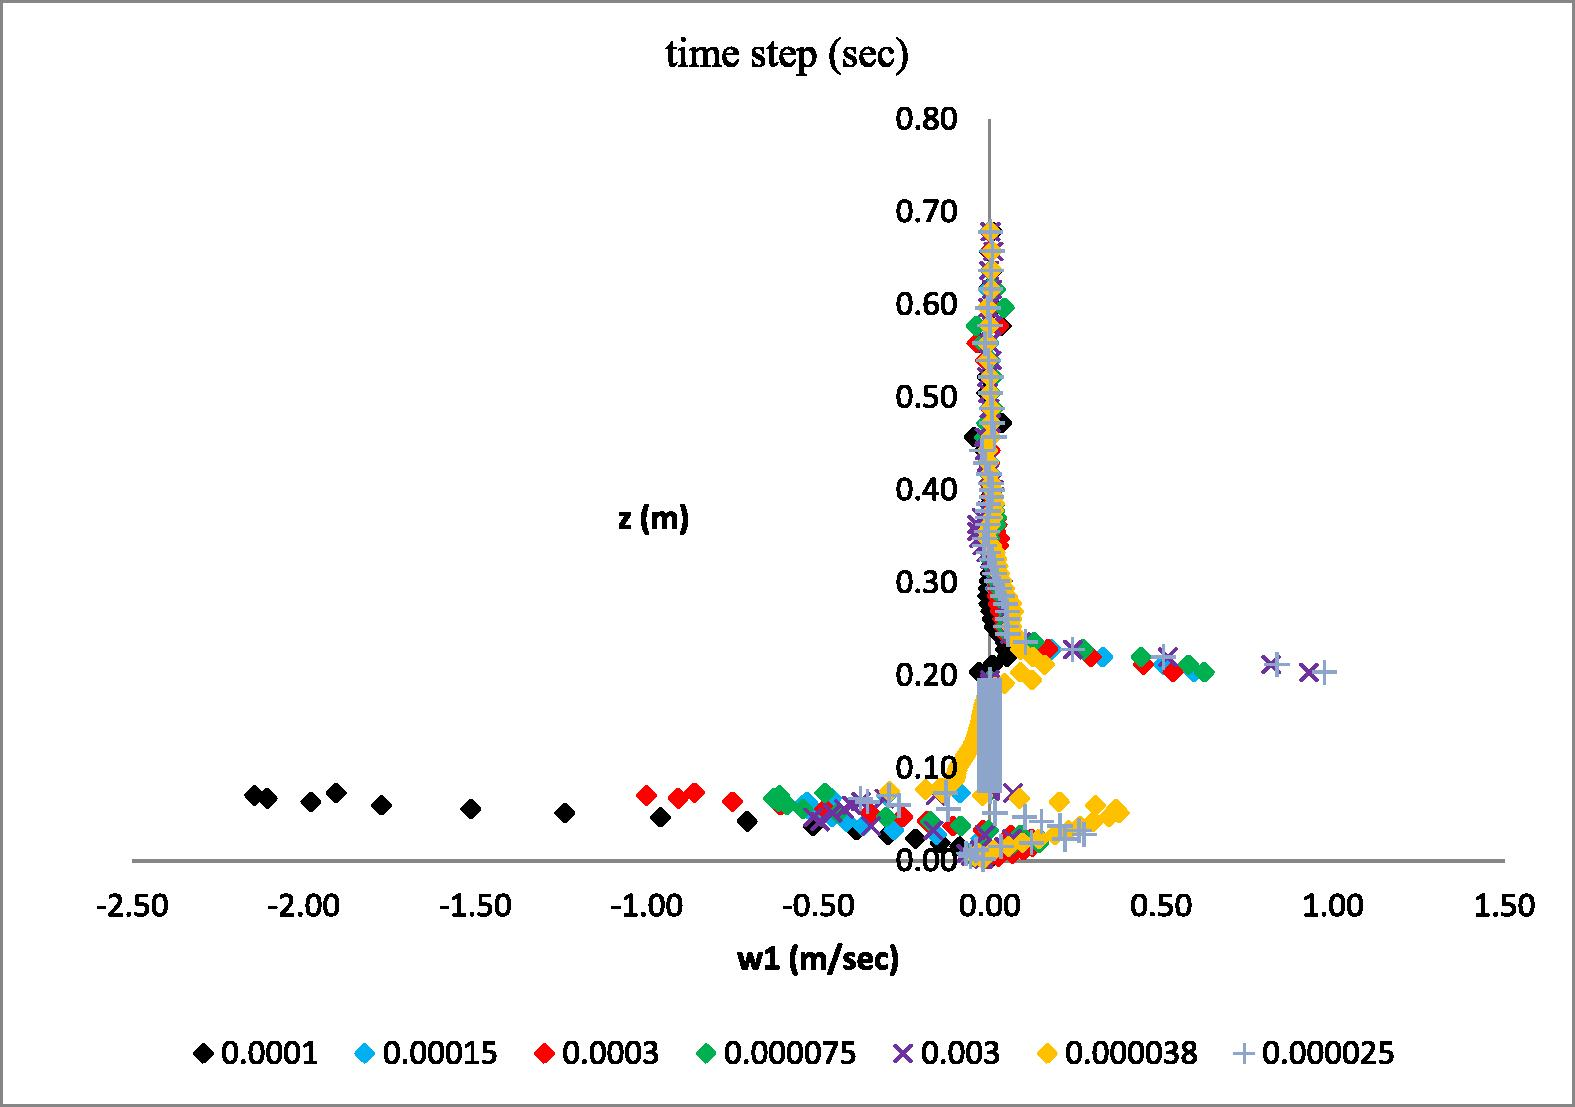
Vertical velocity distribution computed by means of the second grid (408.000 cells) using different time steps.
The maximum number of iterations per time step plays an important role in the accuracy of the simulation, because it stipulates the maximum number of calculations to try, in order to reach a specified solution convergence. The overall real time of the physical problem simulated is 3 s.
According to the calculations in the numerical procedure it was concluded that the fourth grid (3.264.000 cells) applying a maximum number of 20 iterations per time step was sufficient for getting excellent grid independency. Moreover, a time step of 1.0E-04 s was the optimum for obtaining time-step independency of the results.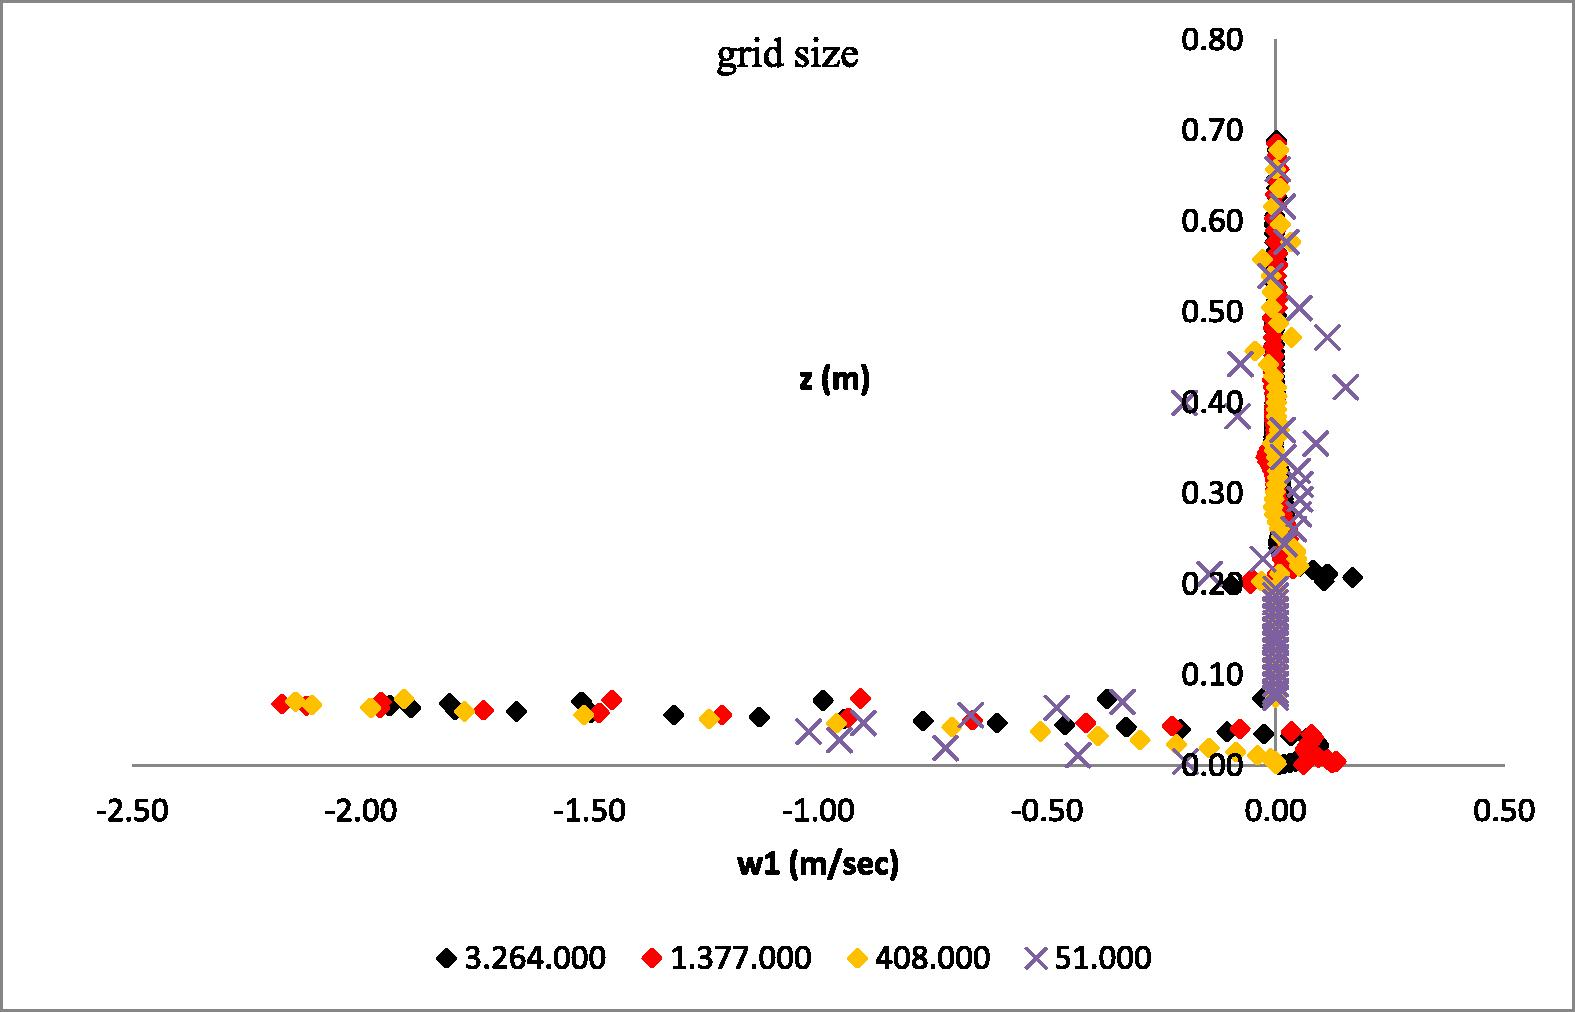
Vertical velocity distribution calculated by using the four grids and the optimum time step and number of iterations for each grid.
In Figs. 4 and 5 the optimum grid (3.264.000 cells) at the longitudinal planes Z-Y and X-Z is presented “see Electronic Annex 1 in the online version of this article”.
The above figures are just samples of all the combinations of grid-size vs. time-step runs performed, comparing all variables, the plotted vertical velocity distributions appearing to be the most sensitive.
2.2 Velocity field
In Fig. 6 the water phase velocity distribution at real time of 3 s from the start of mixing, when applying the RNG k-ε turbulence model, is presented.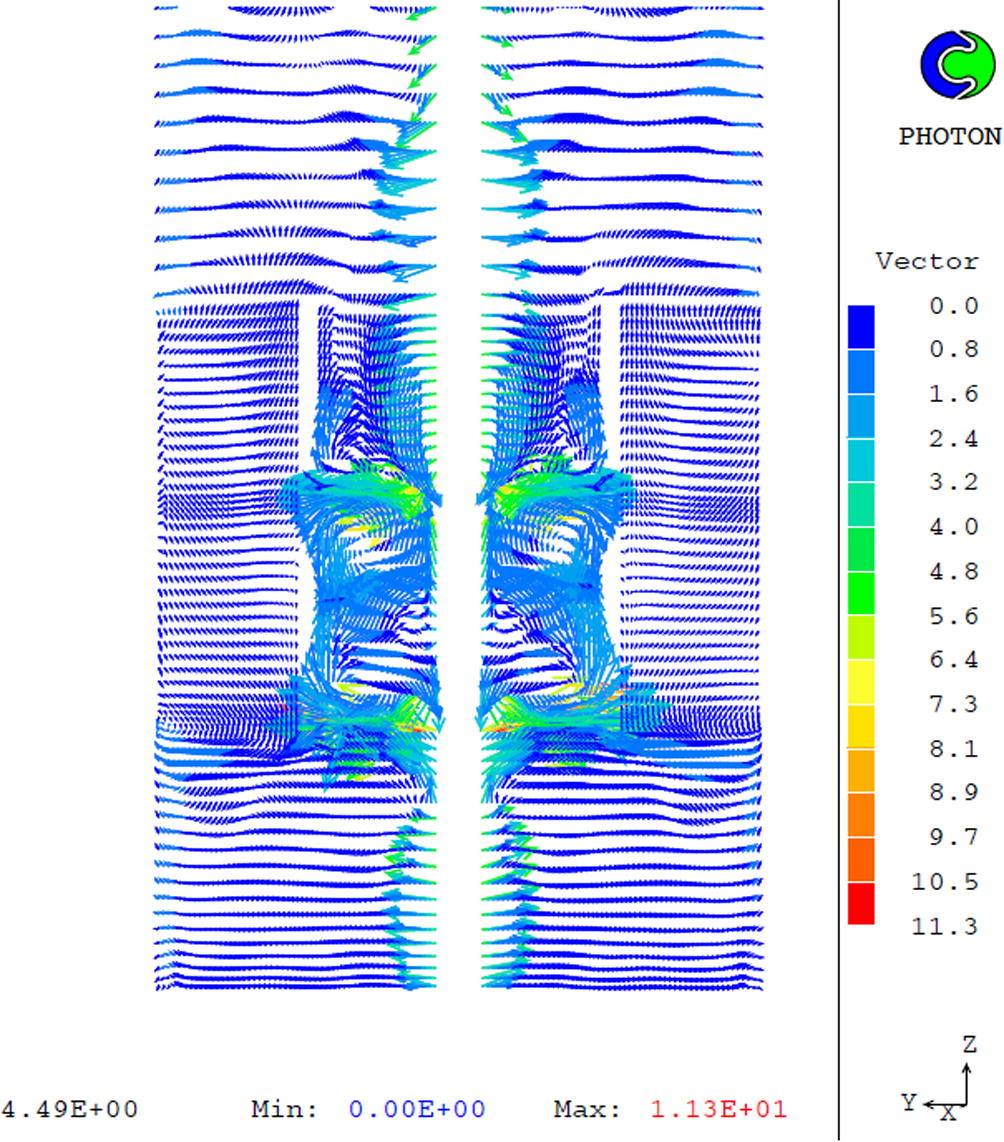
Velocity distribution of the first phase (water) at the longitudinal Z-Y plane at time 3 s.
Intensive fluid rotation and mixing is observed, accompanied by large values of velocities and strong gradients around the two blades, as well as the formation of two vortices. A central vortex is also generated along the centerline of the vessel. The suction force of the upper blade attracts the water from the neighbouring regions downwards into the center of the draft tube and redistributes it outwardly by the lower blade (Fig. 6). The water flows down to the bottom of the vessel and rises up to the top through the annular region. The presence of the draft tube arrests the two fluids for a longer time period in the region of strong gradients resulting in the efficient mixing of the two phases. The four baffles prevent swirling and promote the fluid movement from the top to the bottom. The water closest to the axis flows mostly upwards converse to the bulk fluid flow “see Electronic Annex 2 in the online version of this article”.
Fig. 6.1 presents the velocity distribution as predicted by Yang et al.(1999). The flow is similar to the present predictions, particularly in and around the draft tube and at the top, but the present results are much more detailed, due to the much finer grid, the more sophisticated discretization scheme and the RNG turbulence model.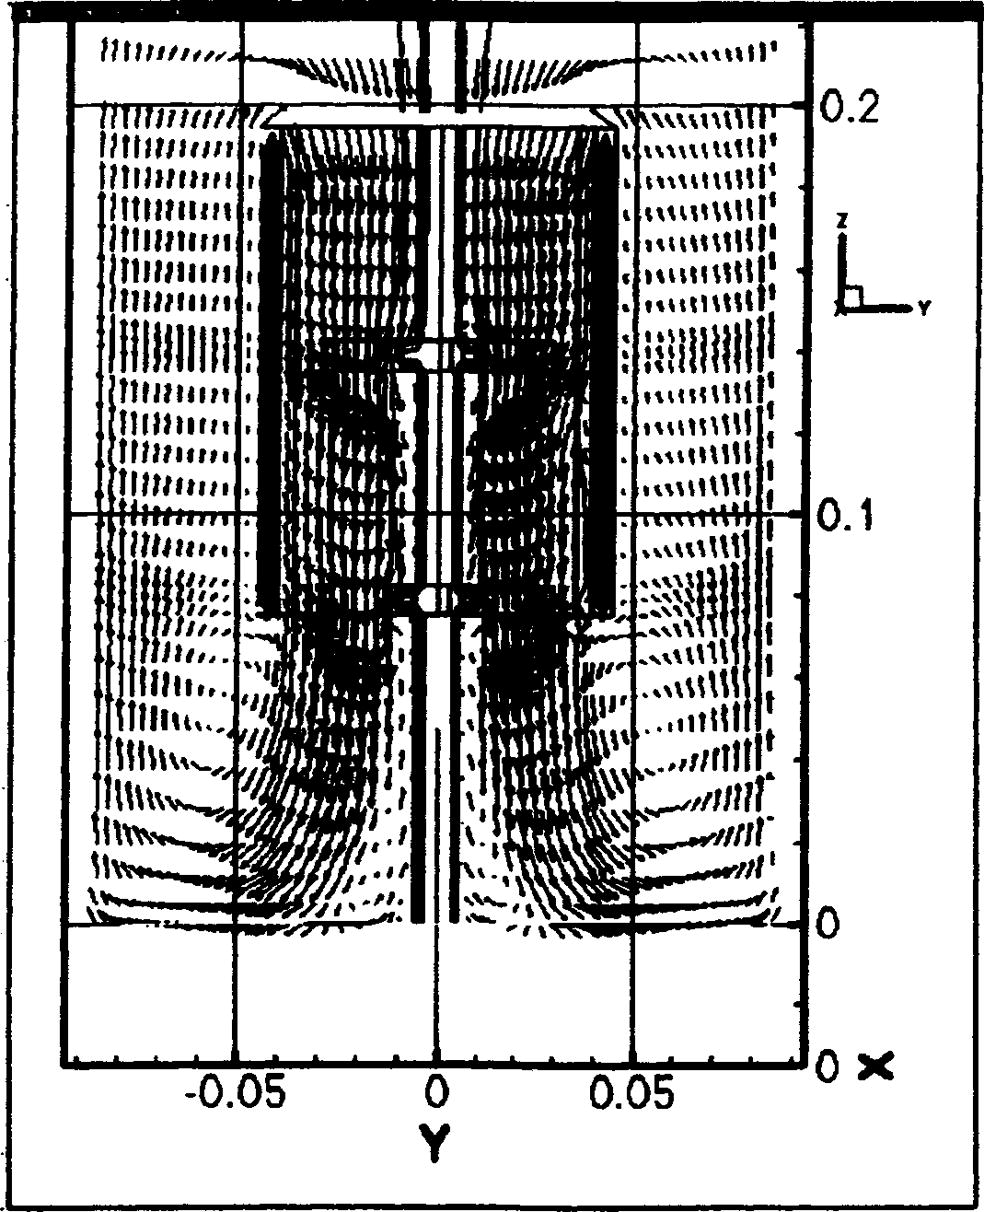
Flow field as obtained by Yang et al. (1999).
In Fig. 7 the velocity distribution at the polar Y-X plane at the height of the draft tube between the two impellers is presented. The impellers rotation accelerates the water-phase flow, thus strong gradients of velocity are observed in close proximity to the internal wall of the draft tube, in the region of the baffles and around the impeller, where the water-phase velocity increases, as expected “see Electronic Annex 2 in the online version of this article”.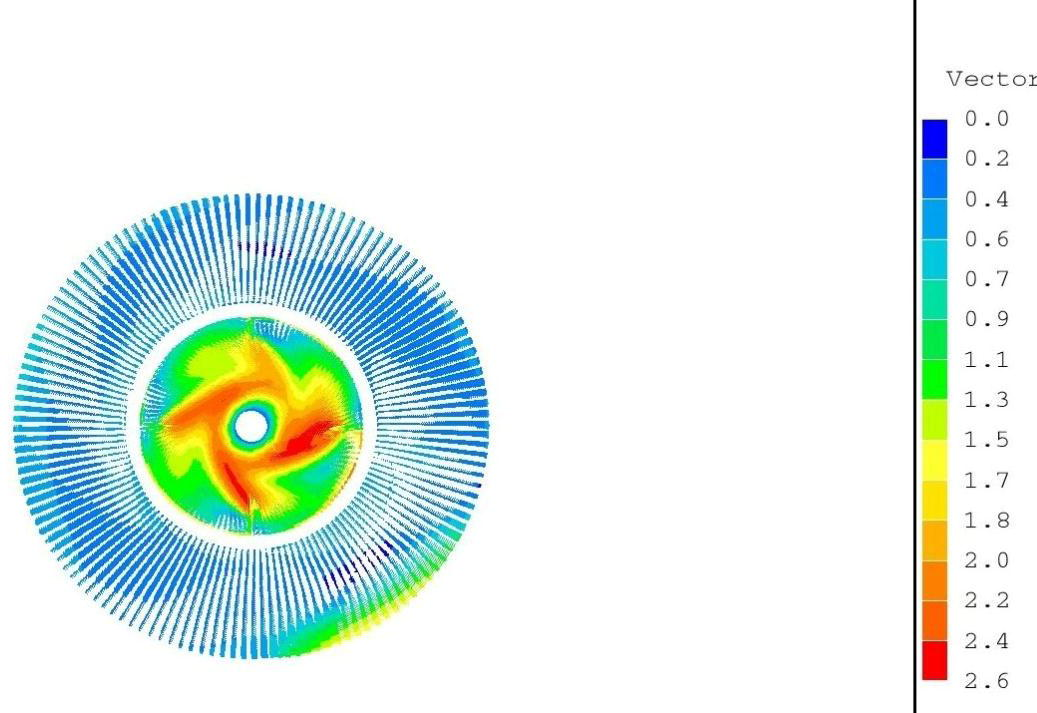
Velocity distribution of the first phase (water) at the polar Y-X plane between the two impellers.
Furthermore the strong gradients of the velocity components (axial, radial, azimuthal) around the impellers and the axis, as well as next to the baffles are clearly distinguished in Figs. 8–10 that present the velocity contours at the longitudinal Z-Y plane at times 1, 2, 3 s, respectively “see Electronic Annex 3 in the online version of this article”.
In Figs. 11 and 12 the axial (w1) velocity distribution at two different radial distances is presented. Stronger gradients of the w1-component of velocity are observed in the region of the impellers (1st impeller: z = 0.147–0.175 m, 2st impeller: z = 0.266–0.308 m). Below the impellers the w1-component of velocity obtains negative values.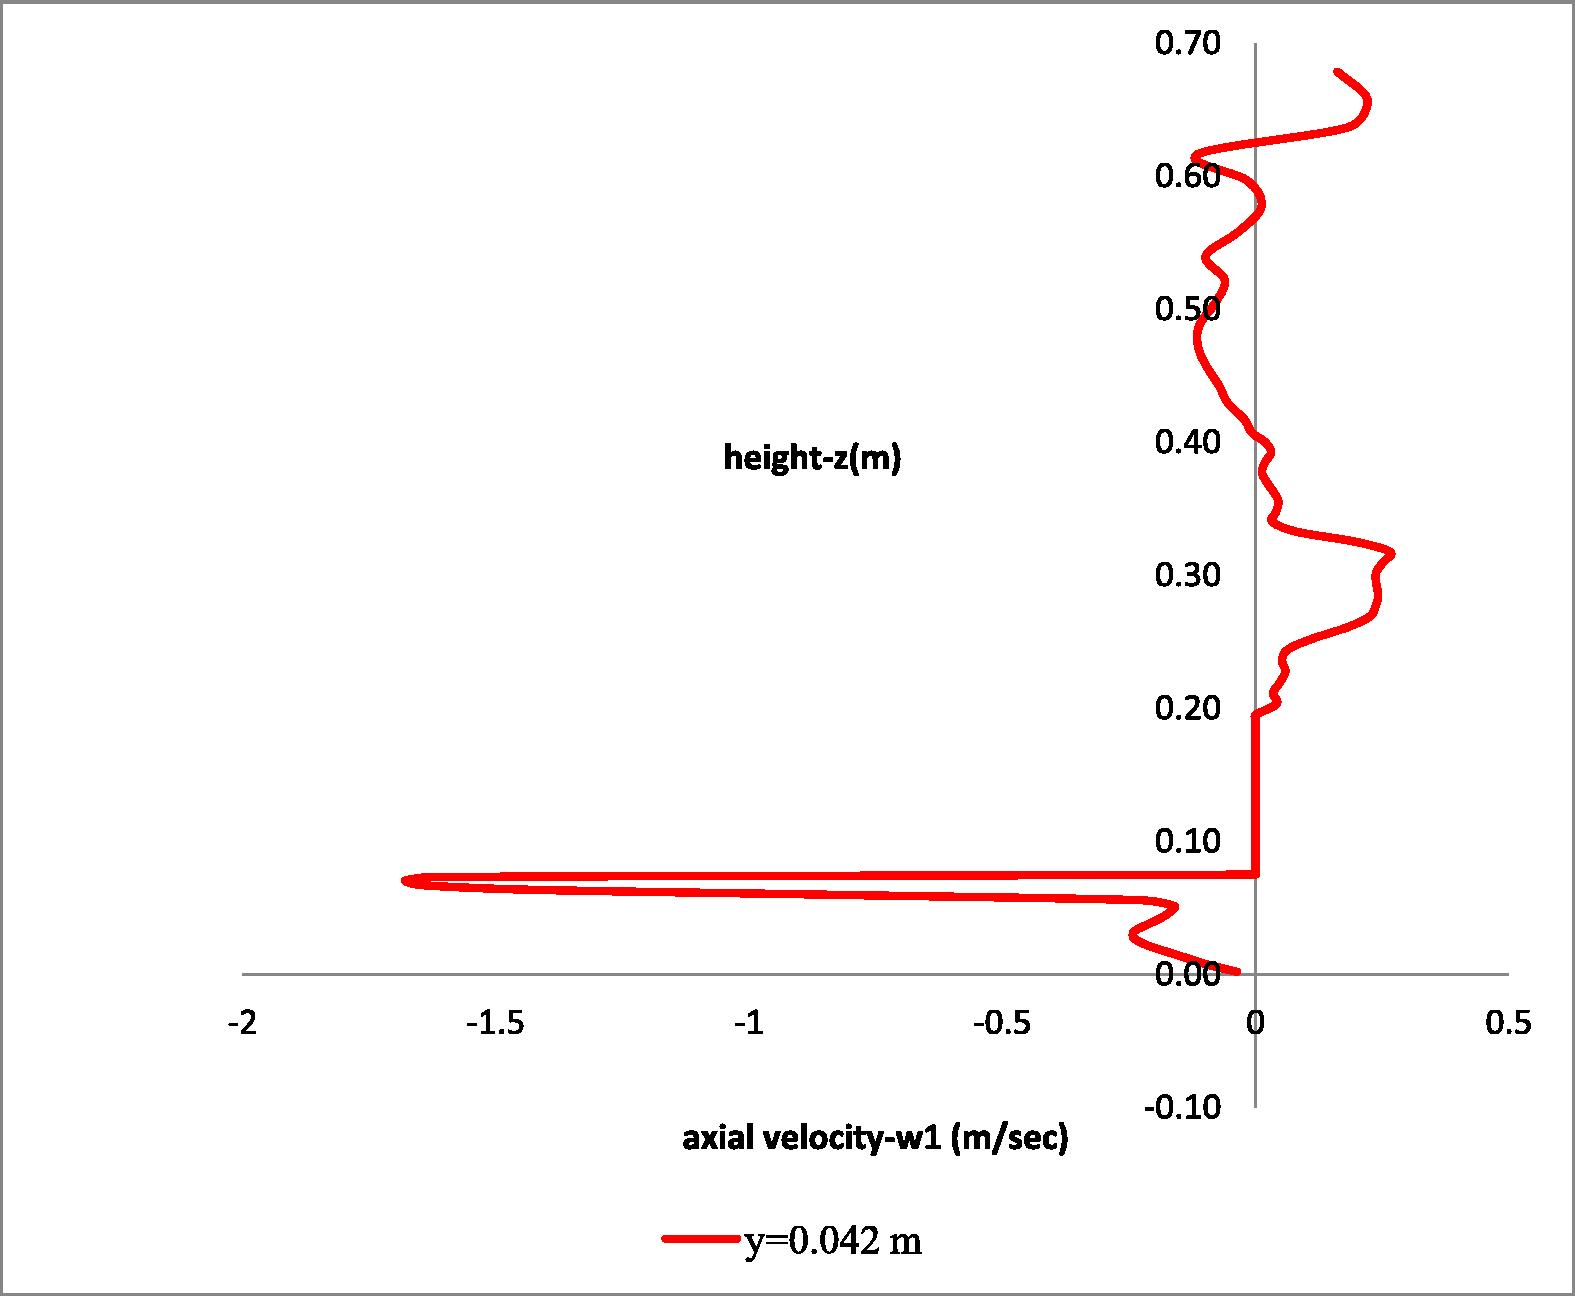
Axial distribution of the axial (w1) velocity component at radial distance y = 0.042 m at the draft tube (y = 0.04 m-0.045 m).
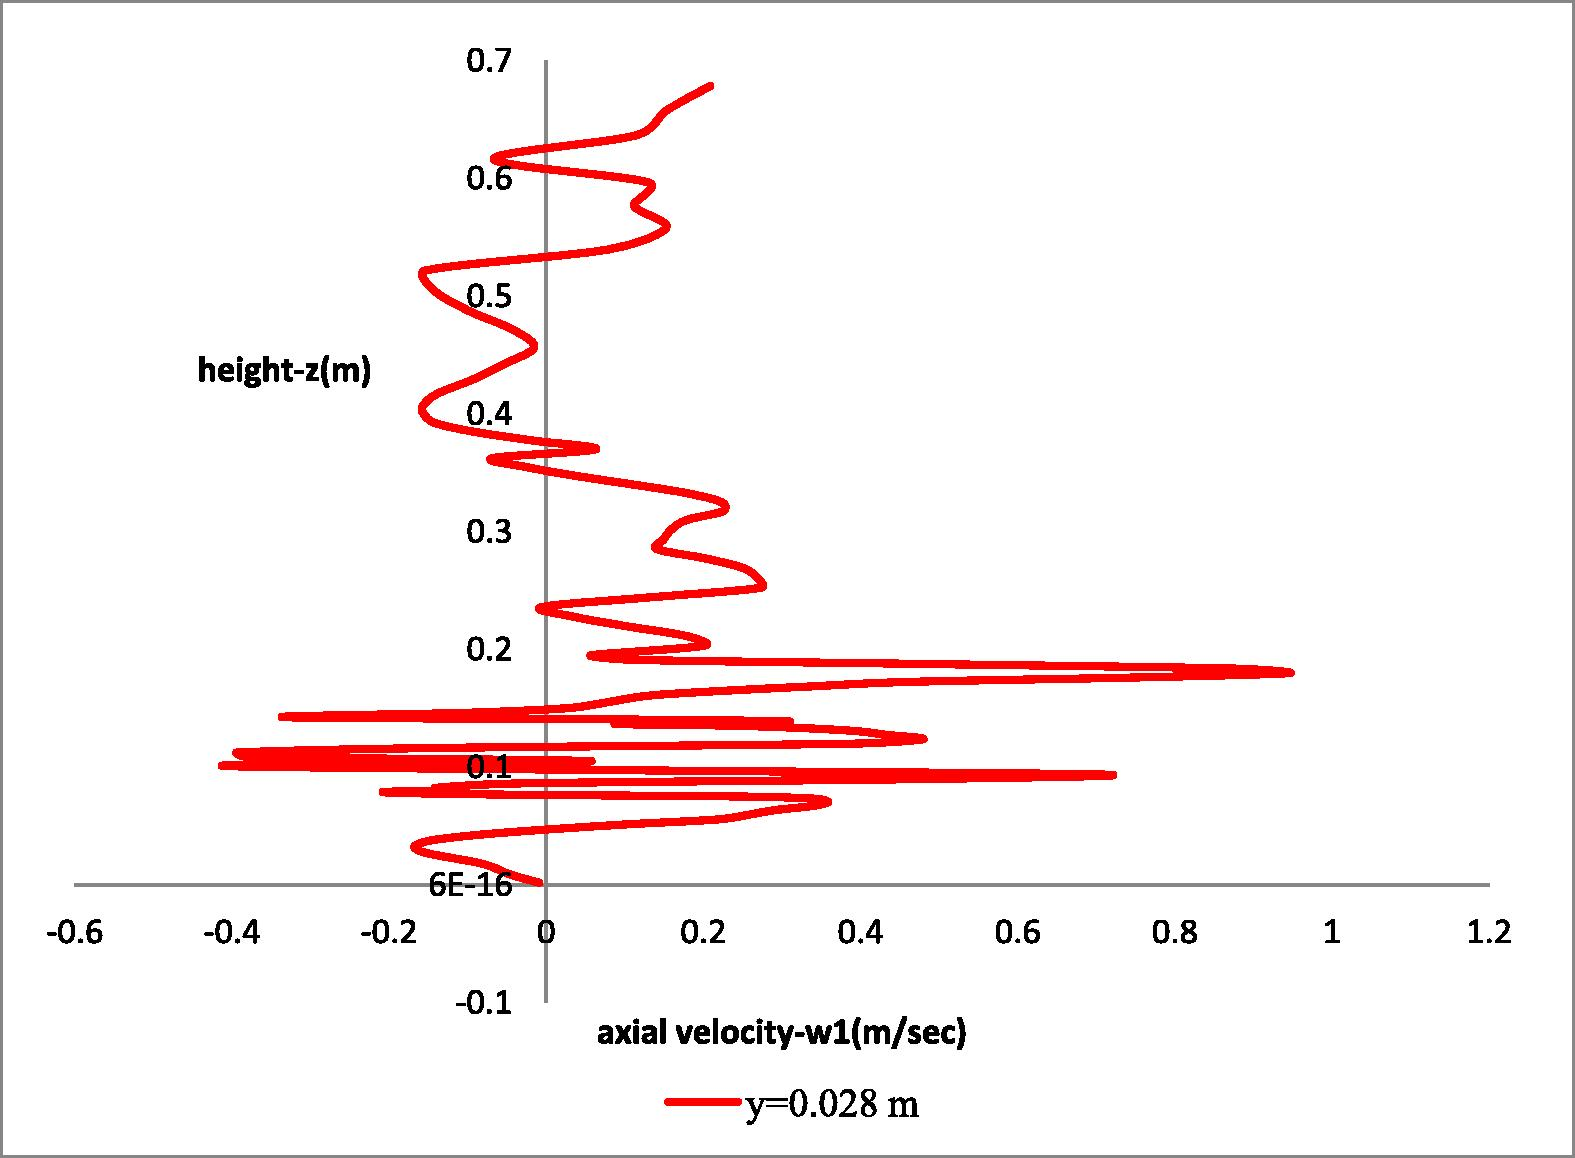
Axial distribution of the axial (w1) velocity component at radial distance y = 0.028 m next to the impellers.
In Fig. 13 the axial (w1) velocity distribution at the height of the first impeller is presented where the strong gradients of the w1-component of velocity can be seen. Furthermore due to the suction force that leads the water-flow downwards, negative values of the axial w1-component of velocity are observed inside and positive values outside the draft tube “see Electronic Annex 4 in the online version of this article”.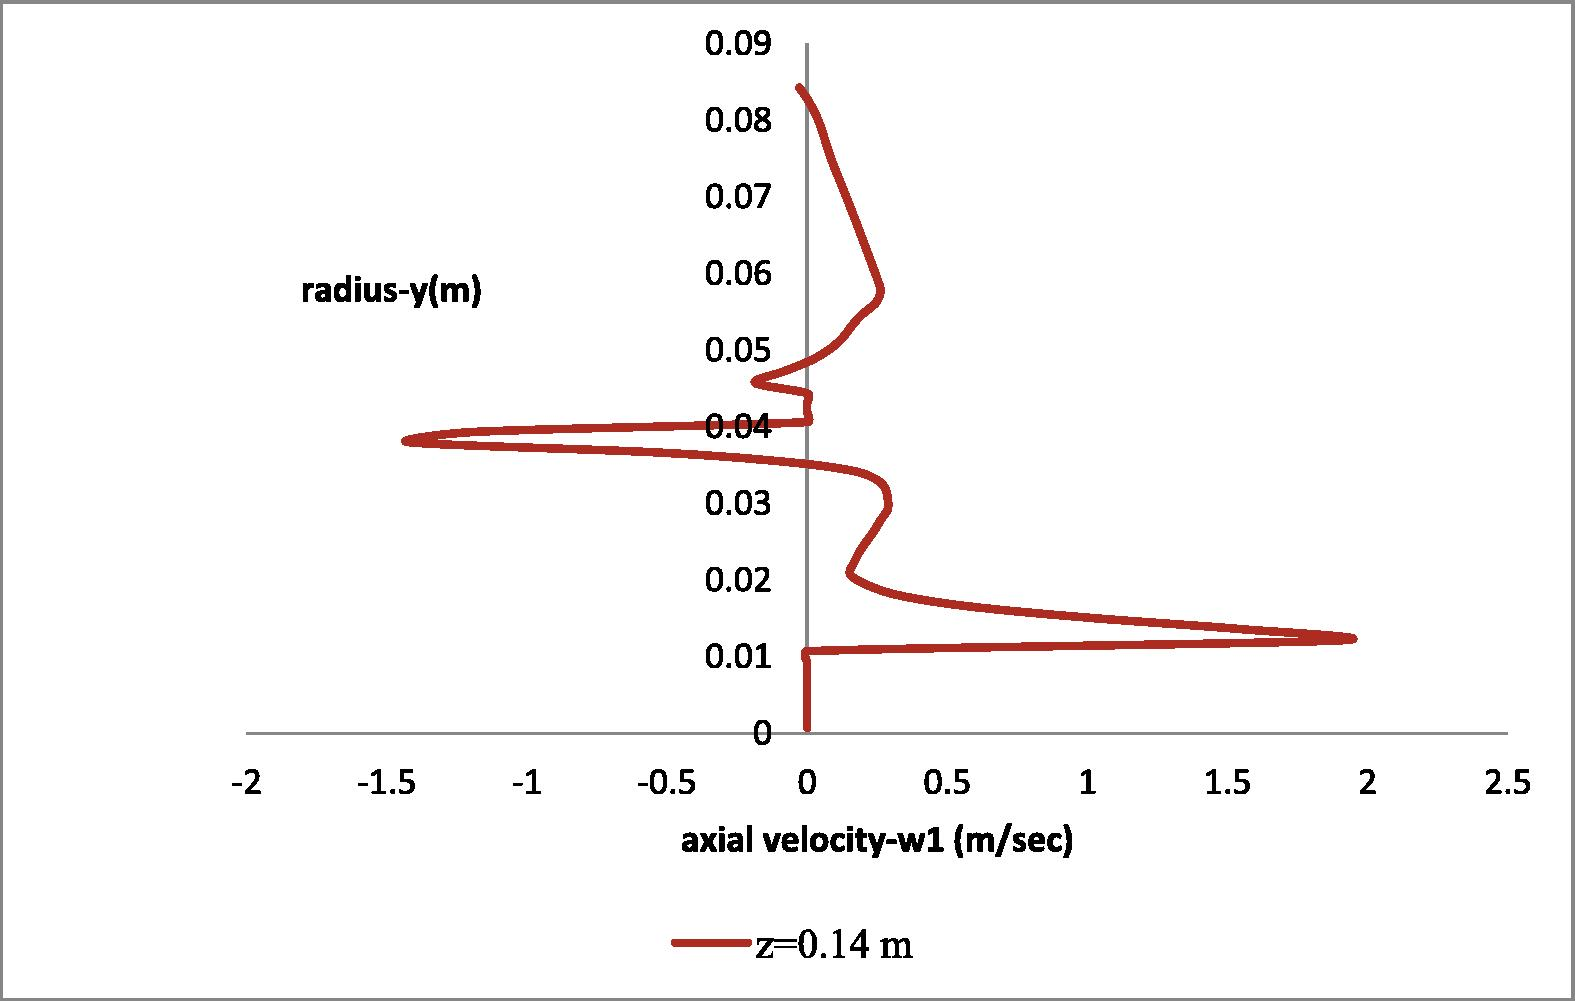
Radial distribution of the axial (w1) velocity component at the height of the first impeller (z = 0.14 m).
In Fig. 14 the radial (v1) velocity distribution at radial distance y = 0.014 m is presented. The v1-component of velocity reaches its maximum in the region around and below the first impeller (z = 0.147 m-0.175 m).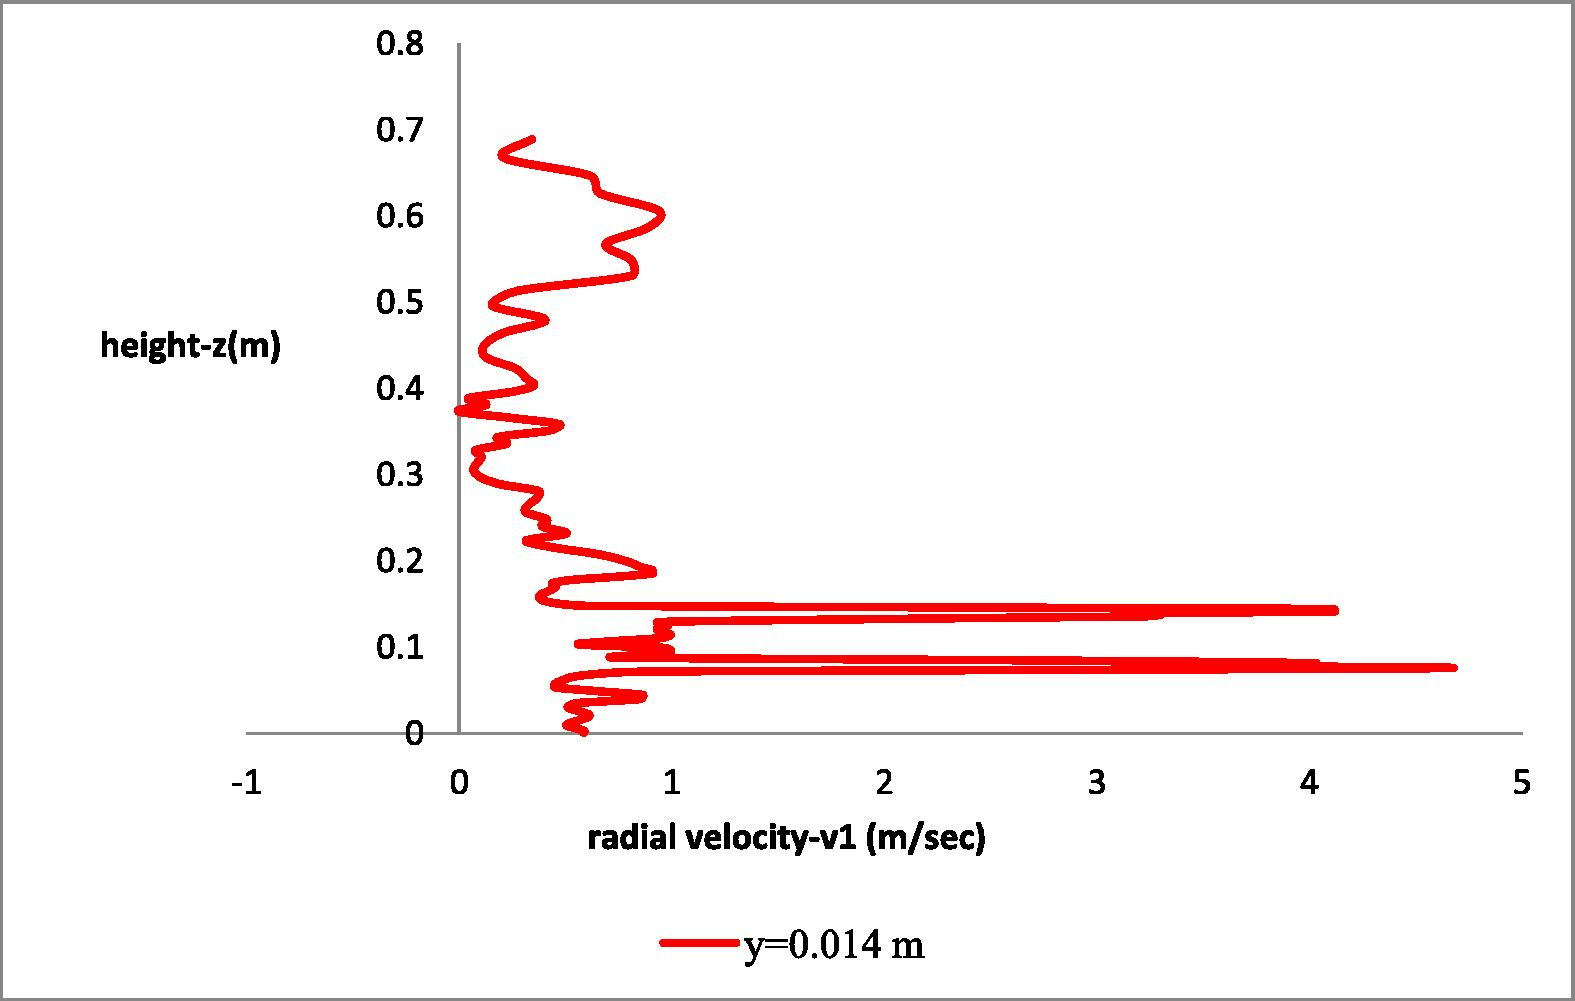
Axial distribution of the radial (v1) velocity component at radial distance y = 0.014 m next to the impellers.
In Fig. 15 the radial (v1) velocity distribution at the height of the second impeller is presented. Due to the suction force of the rotational movement the v1-component of velocity obtains positive values at the height of the impellers and negative values between and in close proximity above them “see Electronic Annex 5 in the online version of this article”.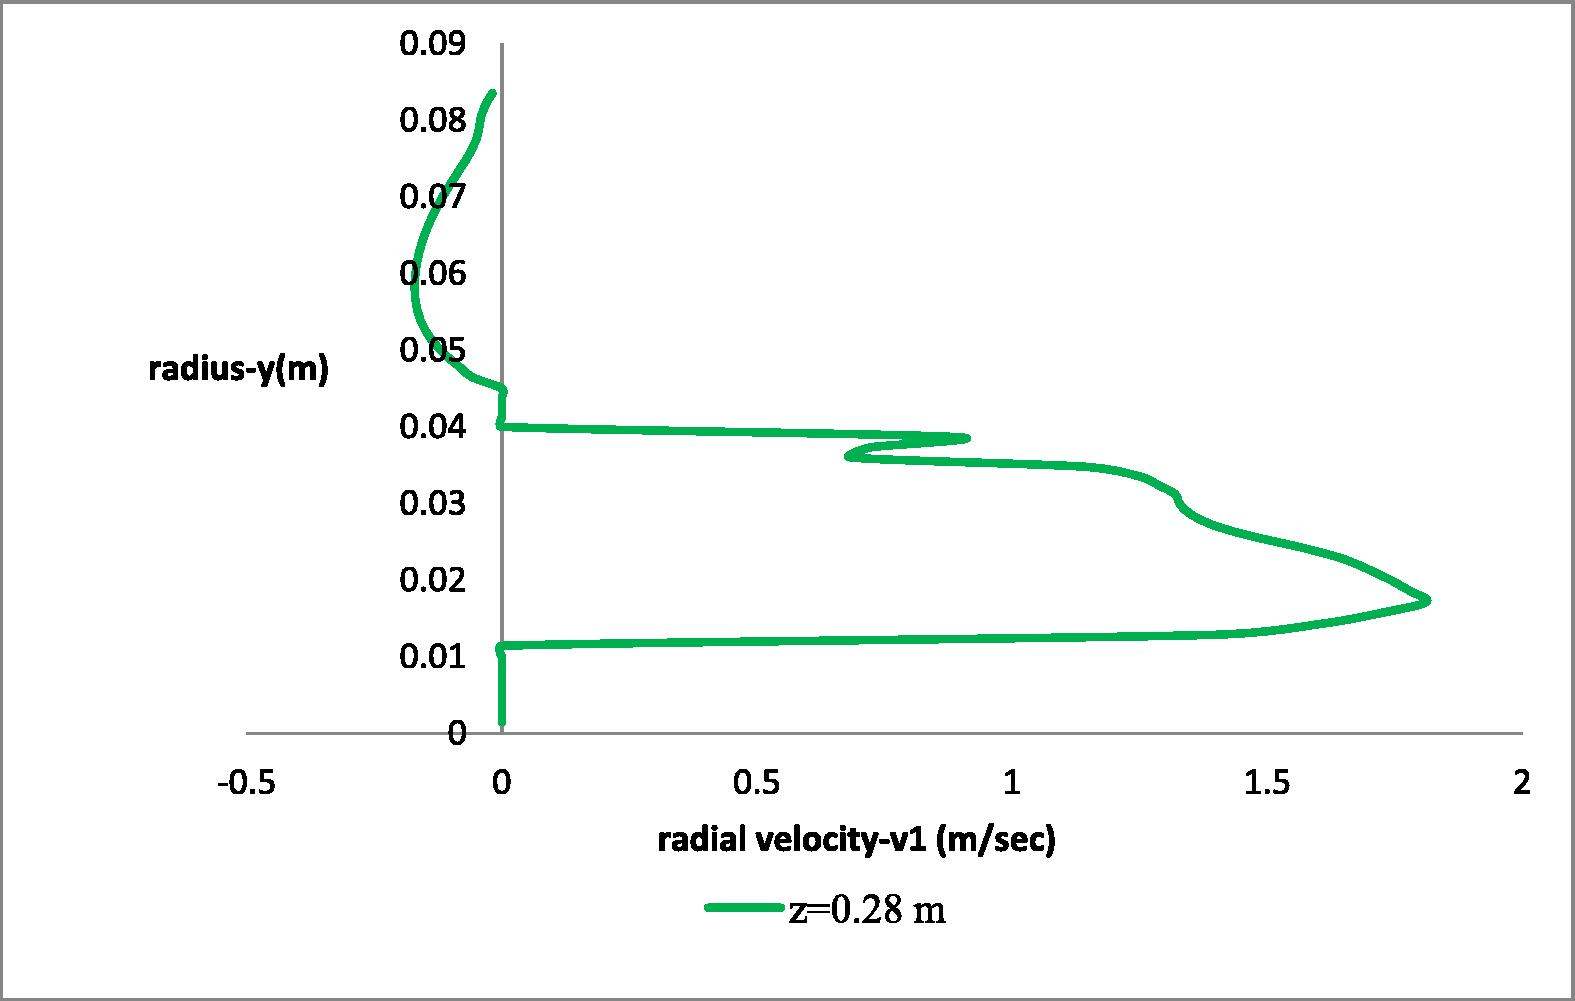
Radial distribution of the radial (v1) velocity component at the height of the second impeller (z = 0.28 m).
In Fig. 16 the azimuthall (u1) velocity distribution at the height of the second impeller is presented, where the strong gradients of the u1-component of velocity are clearly distinguished.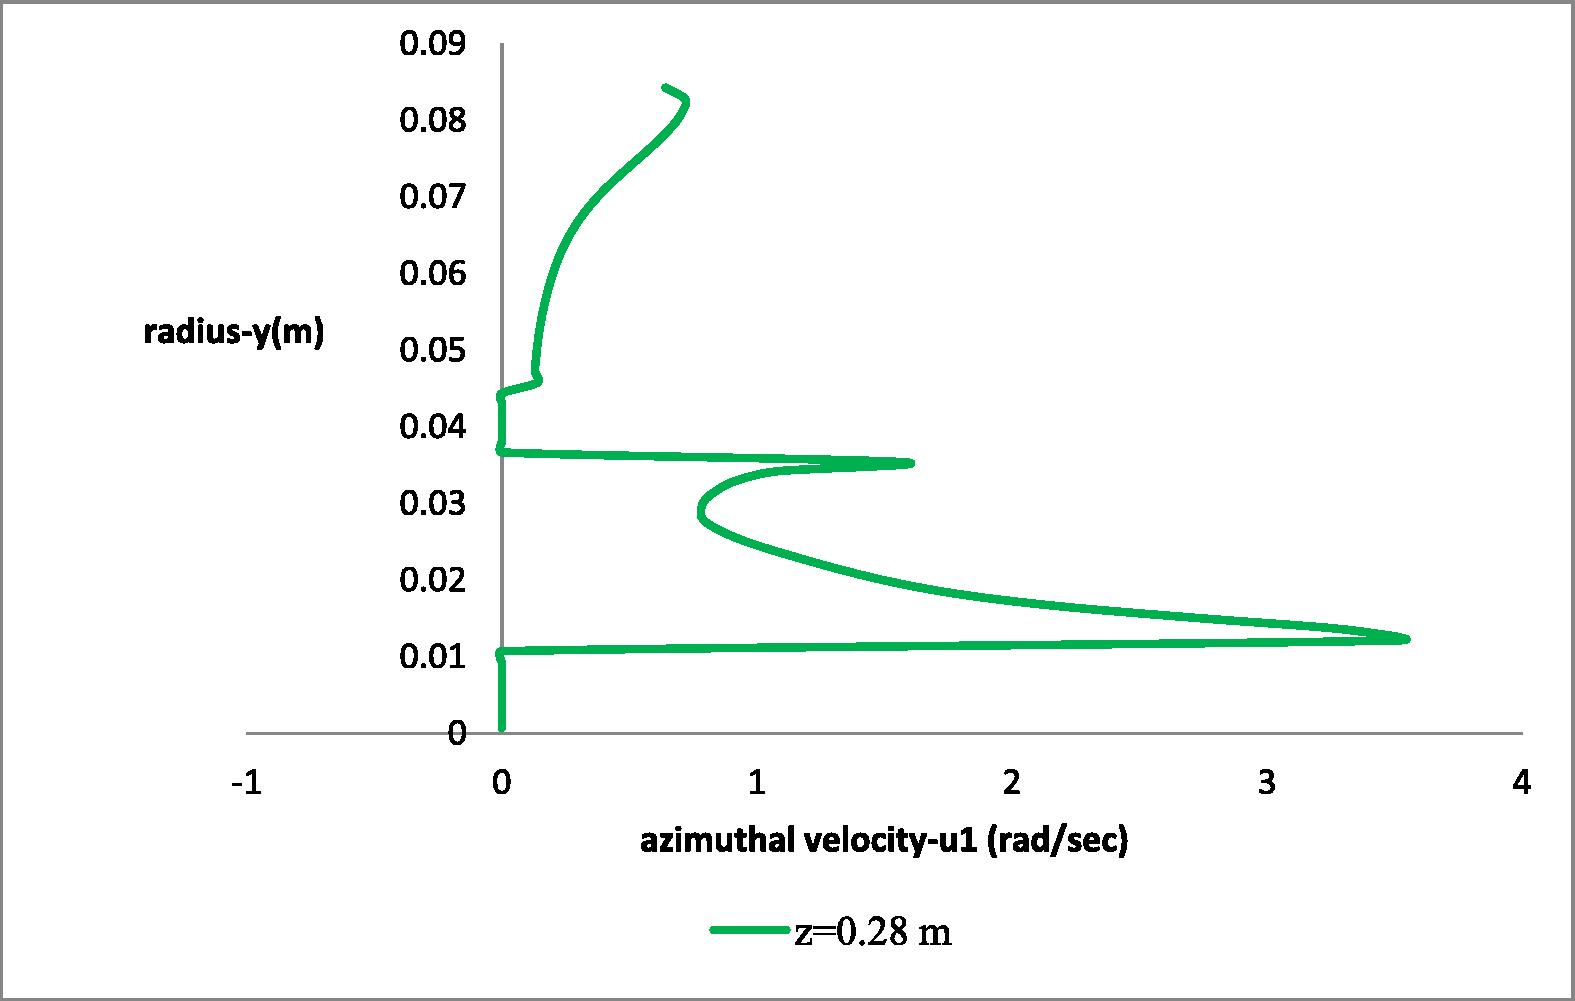
Radial distribution of the azimuthal (u1) velocity component at the height of the second impeller (z = 0.28 m).
2.3 Volume fraction distribution
Strong flow conditions inside the reactor result in the dispersion of the second phase (ozone) and the formation of bubbles. Particularly the development of the suction force by the two vortices inside the draft tube attracts the gaseous phase that collapses to bubbles and is dispersed angularly by the lower blade (Fig. 17).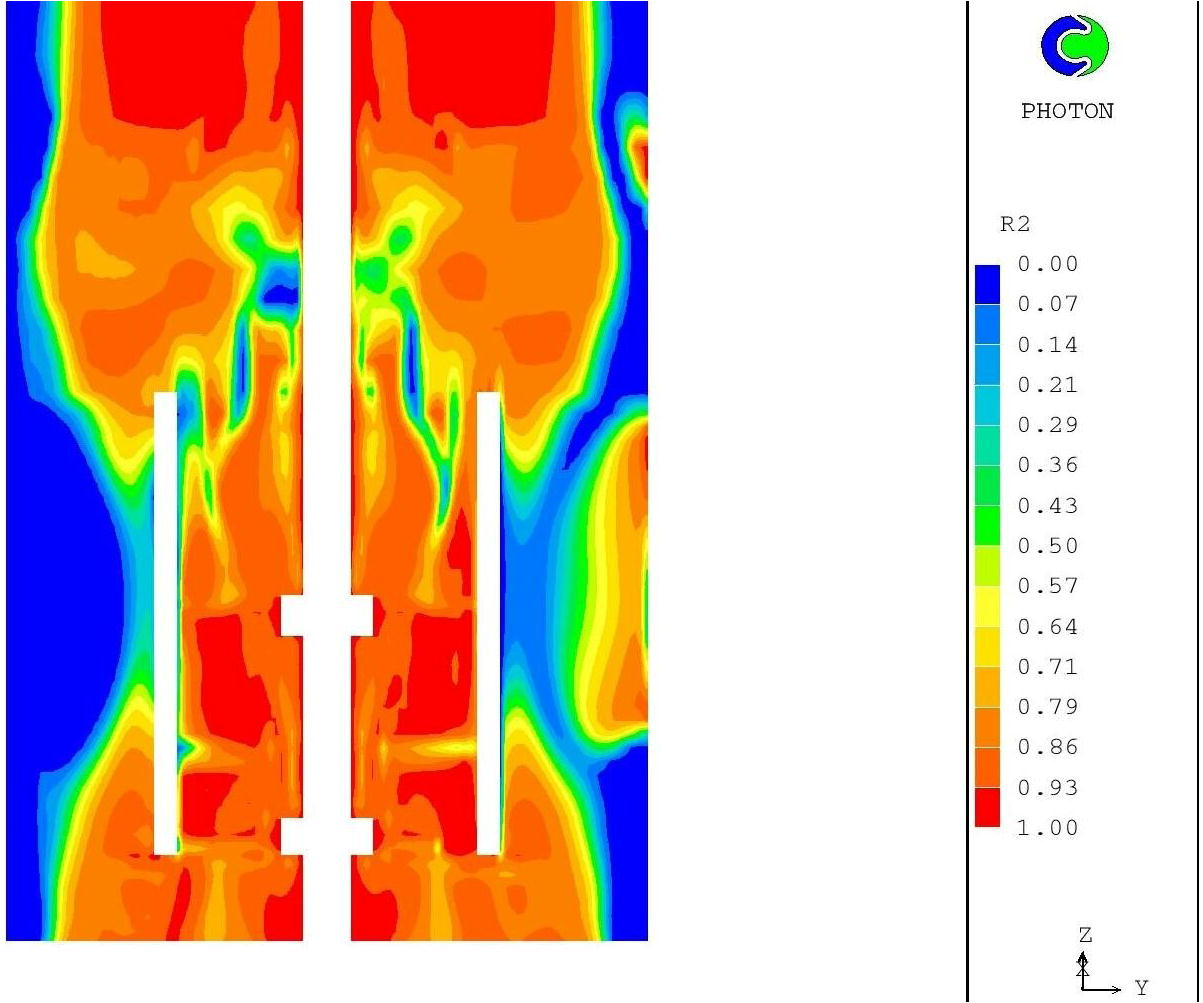
Volume fraction distribution (m3/m3) of the gaseous phase (ozone-bubbles) around the blades at the longitudinal Z-Y plane of the domain at time 3sec.
It is observed that the computed results are consistent with expectations and among themselves, a fact that is satisfying and a possible indicator of accuracy. Furthermore the computed volume fraction distribution is in close agreement with the relevant results of Yang et al. (1999) (Fig. 17.1).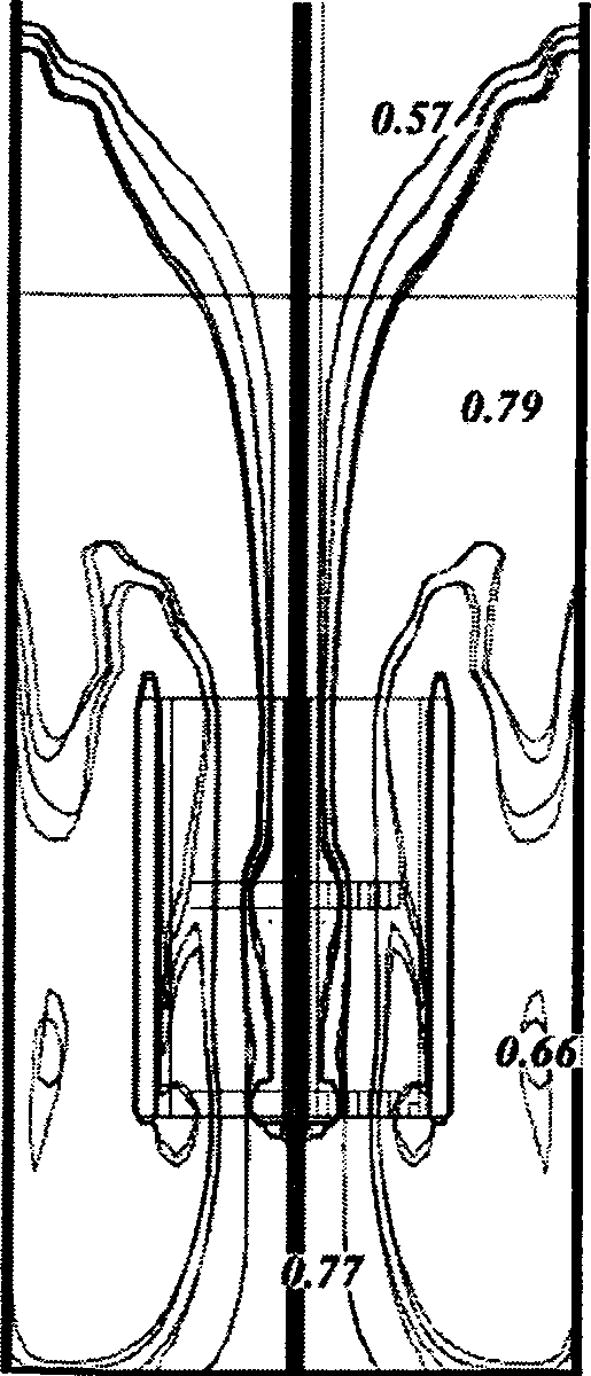
The contour plot of the liquid volume fraction (m3/m3) distribution of the Yang et al. (1999) numerical simulation.
2.4 Pressure field
The pressure contours (Fig. 18) indicate that the pressure distribution depends on the presence of the draft tube and the rotation of the two blades. The pressure is higher near the solid surface of the draft tube and there is more pressure variance near the impellers (Figs. 18 and 19), as expected. Thus, higher pressure drop is observed around the two rotating blades, where the pressure takes the lower value.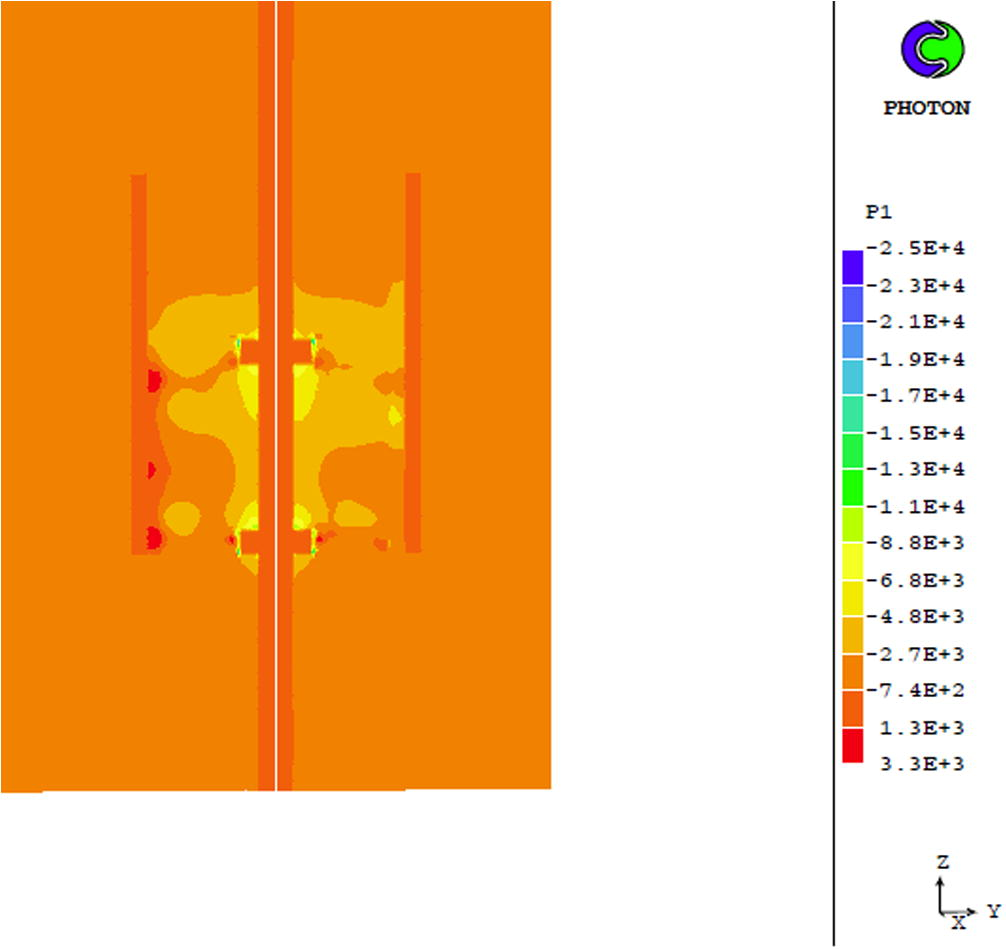
Pressure field distribution (Pa) at the longitudinal plane Z-Y of the domain.
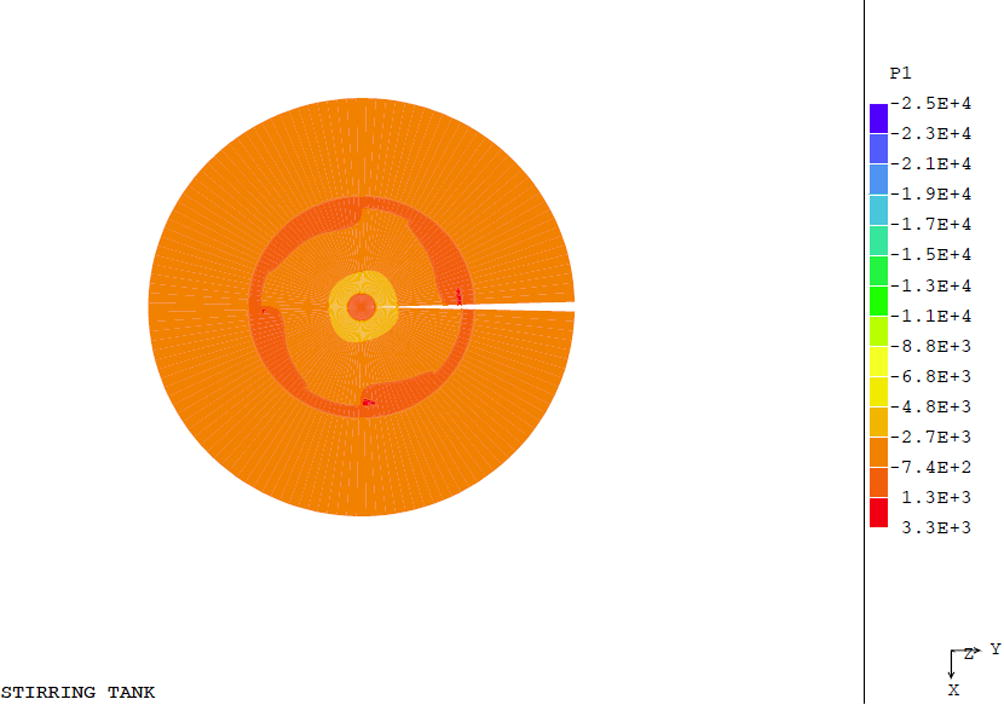
Pressure field distribution (Pa) at the polar plane Y-X of the domain between the two impellers.
In Fig. 20 the axial (P1) pressure distribution at radial distance y = 0.03 m inside the draft tube is presented. Small gradients of the pressure (P1) are observed mainly in the region around the first impeller (1st impeller: z = 0.147–0.175 m, 2st impeller: z = 0.266–0.308 m).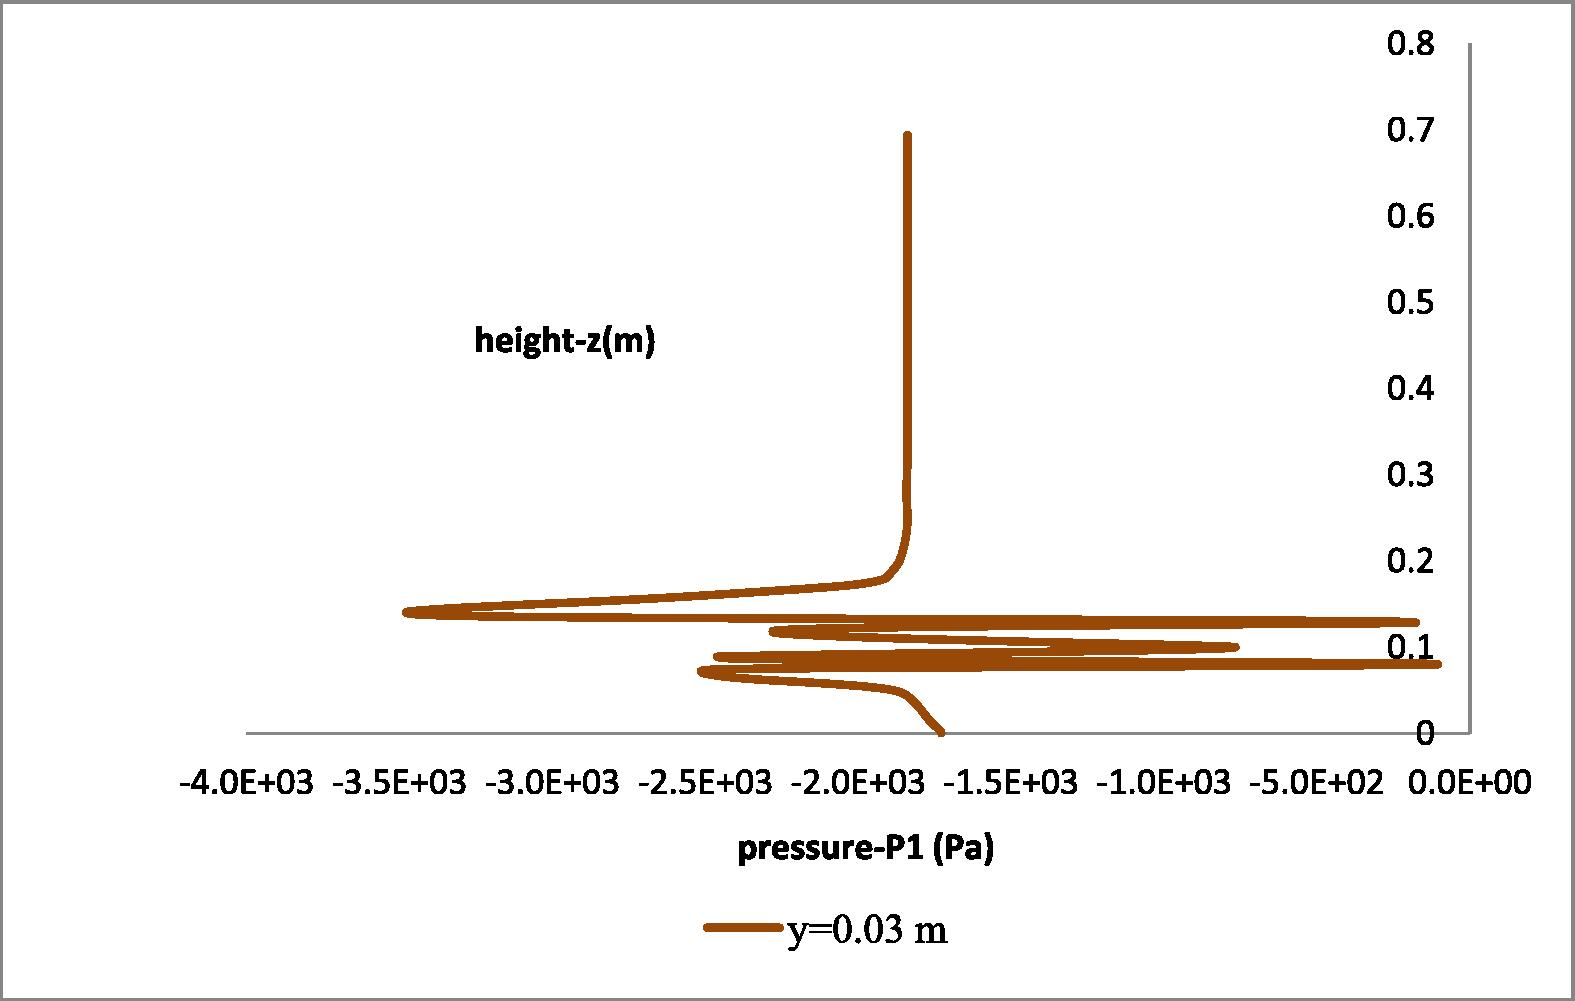
Axial pressure field distribution at radial distance y = 0.03 m.
In Fig. 21, the radial (P1) pressure distribution at the height of the second impeller takes the value of zero due to the presence of the blades (y = 0–0.011429 m) and the draft tube (y = 0.040–0.045 m) and due to the presence of the axis (y = 0.0–0.005714 m). A steep drop of pressure is also observed next to the impeller (y = 0.01143 m) but of limited magnitude.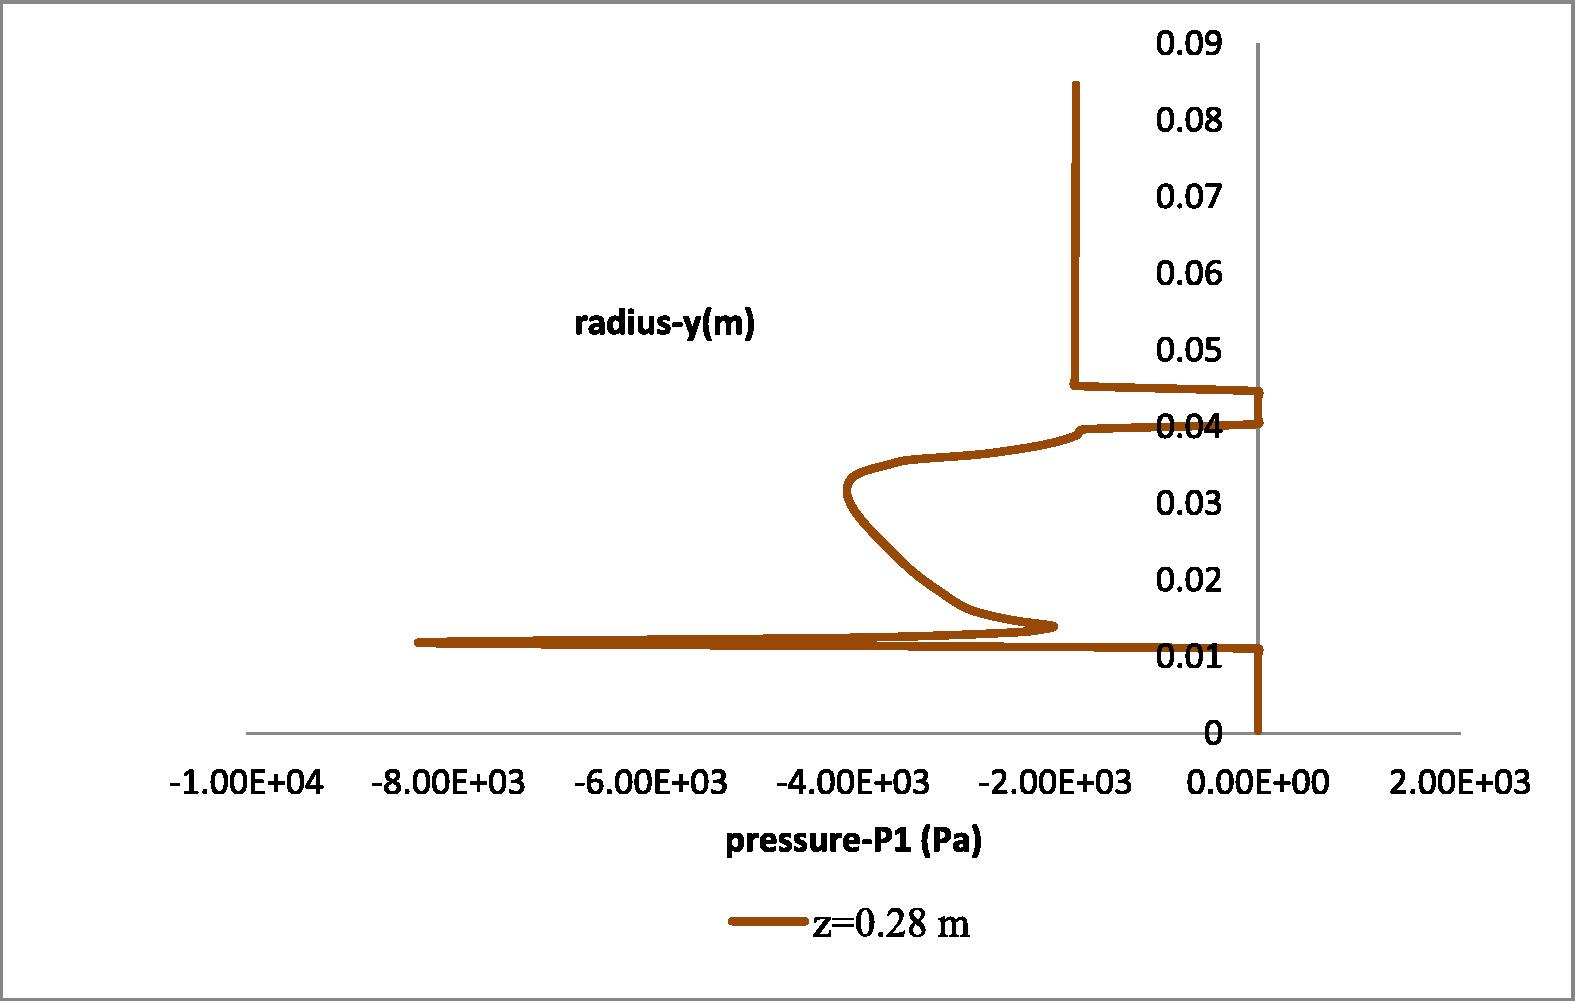
Radial pressure field distribution at the height of the second impeller (z = 0.28 m).
2.5 Turbulence kinetic energy and dissipation rate distributions
In Fig. 22 the turbulence kinetic energy distribution at the longitudinal Z-Y plane of the domain is shown, when applying the RNG k-ε [6] at time of 1 s. The turbulence kinetic energy increases around the impellers, as expected, and reduces as the time proceeds “see Electronic Annex 6 in the online version of this article”.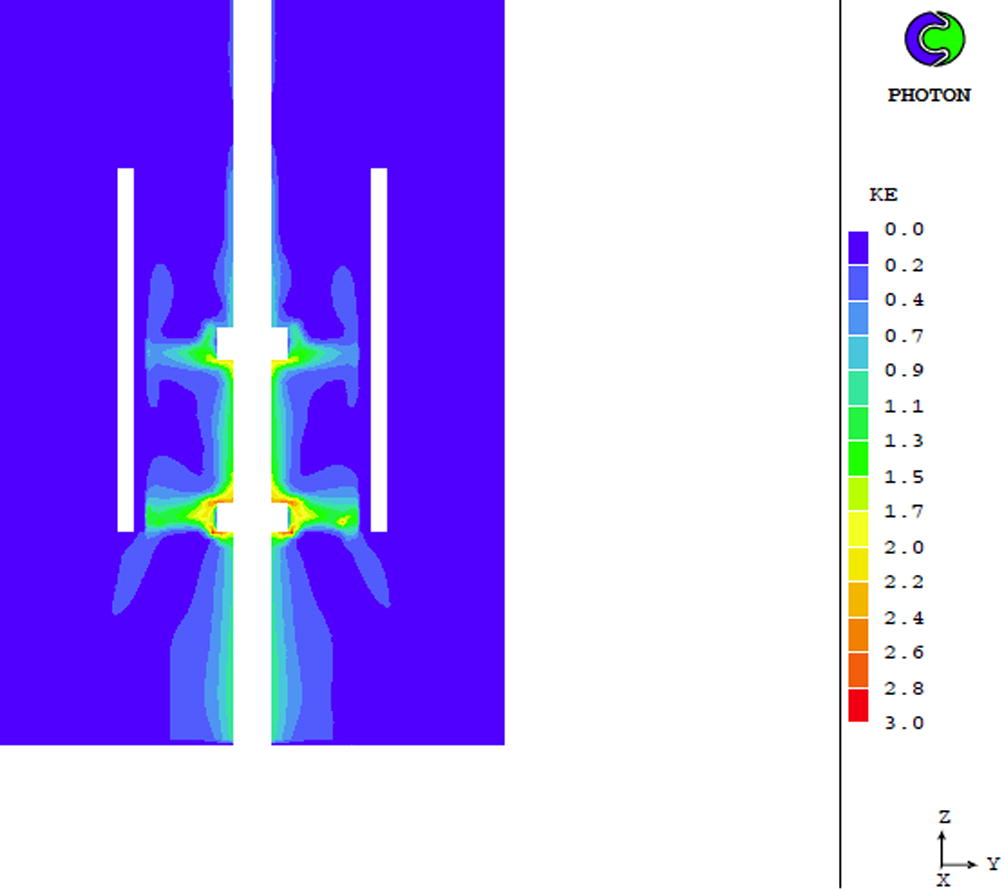
Turbulence kinetic energy distribution (m2/sec2) at the Z-Y plane applying the RNG k-ε model at time 1 s.
In Fig. 23 the turbulence dissipation rate distribution at the longitudinal Z-Y plane of the domain is shown, when applying the RNG k-ε [6] at time 1 s. The turbulence dissipation rate is higher around the impellers, and reduces as the time proceeds “see Electronic Annex 6 in the online version of this article”.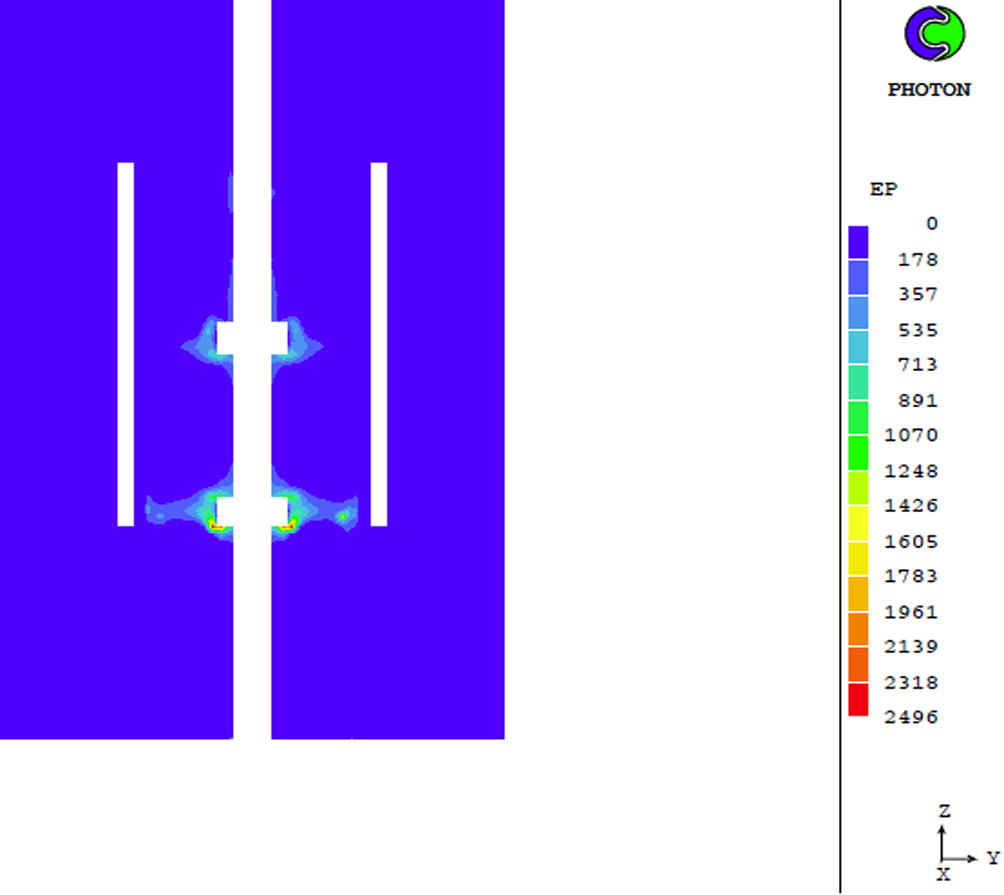
Turbulence dissipation rate distribution (m2/sec3) at the Z-Y plane applying the RNG k-ε model at time of 1 s.
In Fig. 24 the axial turbulence kinetic energy distribution is presented. The turbulence kinetic energy reaches its maximum around the first impeller (y = 0.0–0.011429 m, z = 0.147–0.175 m).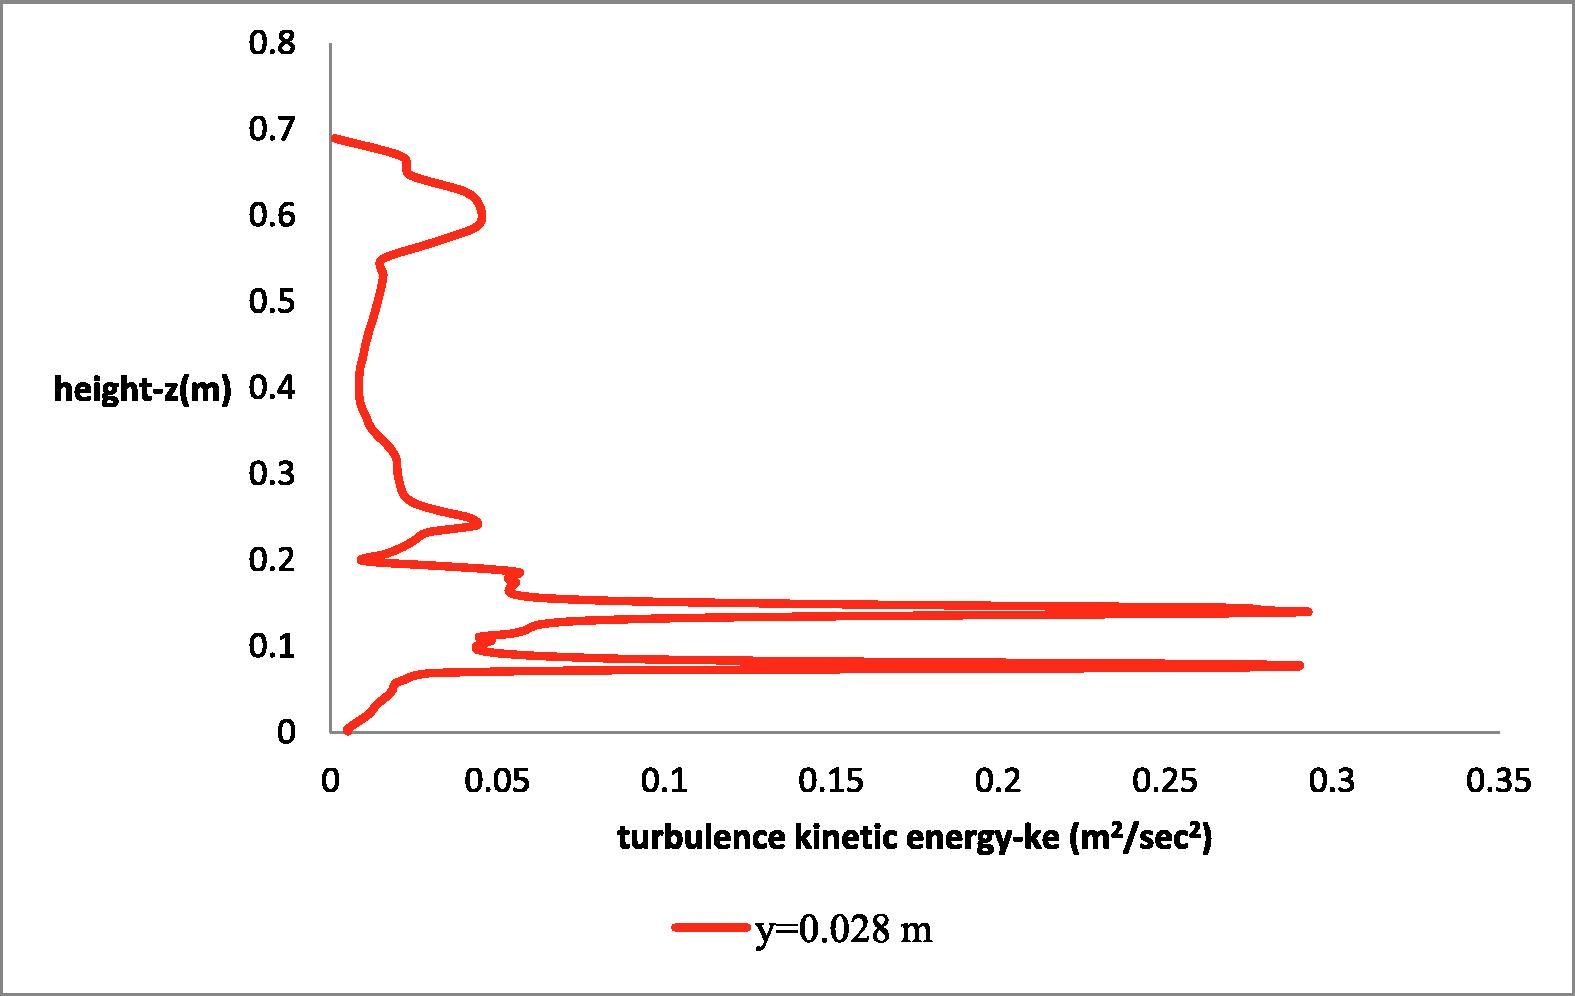
Axial turbulence kinetic energy distribution at radial distance y = 0.028 m.
In Fig. 25 the axial turbulence dissipation rate distribution is presented. The turbulence dissipation rate becomes maximum around the first impeller (y = 0.0–0.01129 m, z = 0.147–0.175 m).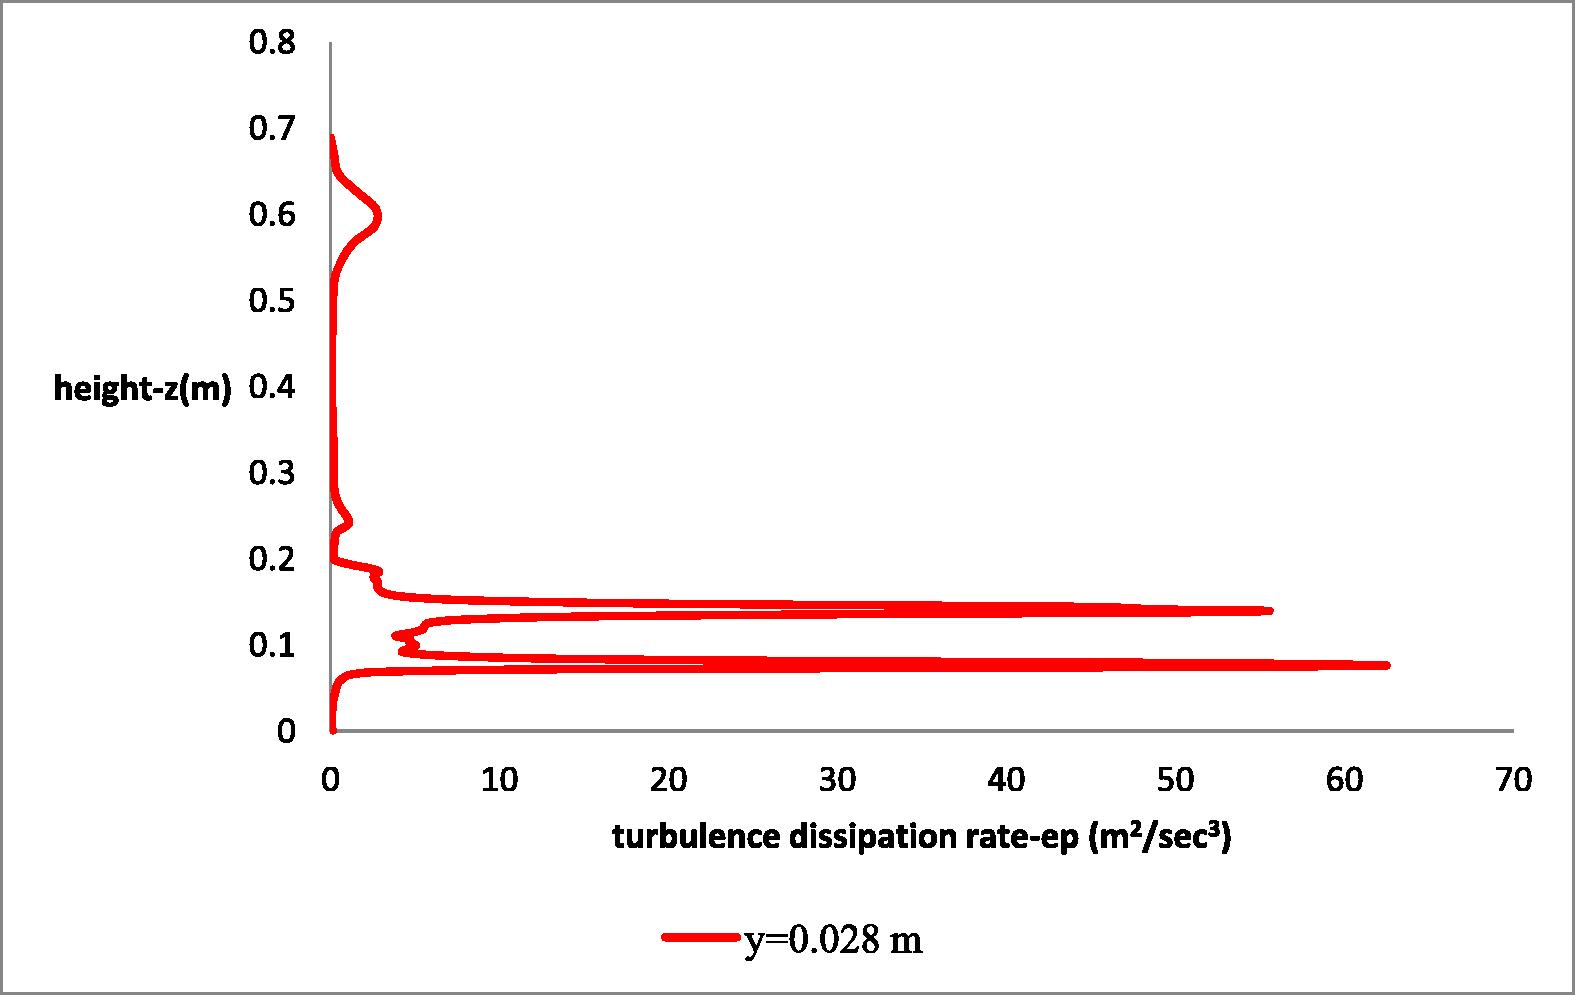
Axial distribution of turbulence dissipation rate at radial distance y = 0.028 m.
The turbulence kinetic energy and the dissipation rate of turbulence in the region near the two blades is expected to be at a maximum (Figs. 22–25). The numerical solution obtained applying the RNG k-ε model appears reasonable, because the turbulence kinetic energy distribution is more intensive around the two blades (Figs. 22 and 24). The turbulence dissipation rate obtains large values near the solid surface of the impellers (Figs. 23 and 25) as their presence damps the larger eddies and the smaller ones are dissipated due to the action of viscous stresses.
3 Conclusions
A three-dimensional two-phase transient Euler-Euler flow model of a baffled stirred-tank reactor was developed using Computational Fluid Dynamics techniques. The flow model takes into account the presence of two different interdispersed phases (water-gas) and their interphase interaction. Rotational movement of the axis and the impellers is simulated based on the sliding mesh approach. The van Leer numerical scheme is applied for the numerical discretization of the convection terms in the momentum equations, that describe such a complex two-phase and turbulent flow on a sliding-mesh grid. The numerical results for the velocity distribution under strong rotating conditions inside the reactor as well as the formation of the expected vortices indicate that they are, qualitatively at least, reasonably well predicted. Moreover, the pressure field and the turbulence kinetic energy distribution around the two blades appear also reasonably well predicted by means of the RNG k-ε turbulence model.
Acknowledgements
The first author (D.P. Karadimou) gratefully acknowledges the financial support from the State Scholarships Foundation of Greece through the ''IKY Fellowships of Excellence for Postgraduate studies in Greece -SIEMENS'' Program.
References
- 3D simulation of wind turbine rotors at full scale. Part I: geometry modeling and aerodynamics. Int. J. Numer. Meth. Fluids. 2011;65:207-235.
- [CrossRef] [Google Scholar]
- A sliding interface method for unsteady unstructured flow simulations. Int. J. Numer. Meth. Fluids. 2007;53:507-529.
- [CrossRef] [Google Scholar]
- Eulerian-Eulerian two-fluid model for turbulent gas-liquid bubbly flows. Int. J. Multiph. Flow. 2003;29:23-49.
- [Google Scholar]
- Two-phase CFD model of the bubble-driven flow in the molten electrolyte layer of a Hall-Héroult aluminum cell. Metall Mater Trans B. 2015;46:1959-1981.
- [Google Scholar]
- Development and validation of sliding and non-matching grid technology for control-surface representation. Proc. Inst. Mech. Eng. G. 2006;220:299-315.
- [CrossRef] [Google Scholar]
- Two-fluid model and hydrodynamic constitutive relations. Nucl. Eng. Des.. 1984;82:107-126.
- [Google Scholar]
- A novel flow oriented discretization scheme for reducing false diffusion in three-dimensional (3D) flows: An application in the indoor environment. Atmos. Environ.. 2012;61:327-339.
- [Google Scholar]
- The numerical computation of turbulent flows. Comput. Methods Appl. Mech. Eng.. 1974;3:269-289.
- [Google Scholar]
- Luo, J.Y., Gosman, A.D., Issa, R.I., Middleton, J.C. and Fitzgerald, M.K., 1993. Full flow field computation of mixing in baffled stirred vessels, Trans IChemE, Chem. Eng. Res. Des 71 (A), 342–344.
- Computation of steady & unsteady turbulent, chemically-reacting flows in axisymmetrical domains. Trans. Instn. Chem. Engrs.. 1979;57(3):156-162.
- [Google Scholar]
- Computer simulation of turbulent fluid flow in chemical reactors. Adv. Eng. Software. 1983;5(1):32-38.
- [Google Scholar]
- Modelling of two – phase transient flow and combustion of granular propellants. Int. J. Multiph. Flow. 1986;12(6):913-933.
- [Google Scholar]
- Computational fluid flow capabilities and software. Ironmaking Steelmaking. 1989;16(4):266-273.
- [Google Scholar]
- Mathematical modelling of single- and two-phase flow problems in the process industries. Revue de I’Institute Francais du Petrole. 1993;48(6):631-662.
- [Google Scholar]
- Petit O., Page M., Nilsson H., Beaudoin M., 2009. The ERCOFTAC centrifugal pump OpenFOAM case-study. 3rd IAHR International Meeting of the Workgroup on cavitation and Dynamic problems in Hydraulic Machinery and Systems, Brno, Czech Republic, 523-532.
- Computational Flow Modeling for Chemical Reactor Engineering, Process Systems Engineering 5. Academic Press; 2002.
- Simulation of buoyancy driven bubbly flow: established simplifications and open questions. AIChE J.. 2004;50:24-44.
- [Google Scholar]
- Numerical computation of multiphase flow and heat-transfer. In: Taylor C., Morgan K., eds. Contribution to Recent Advances in Numerical Methods in Fluids. Pineridge Press; 1978. p. :139-167.
- [Google Scholar]
- A general purpose computer program for multi-dimensional one-two-phase flow. Math. Comput. Simul.. 1981;23(3):267-276.
- [Google Scholar]
- Sliding mesh algorithm for CFD analysis of helicopter rotor-fuselage aerodynamics. Int. J. Numer. Meth. Fluids. 2008;58:527-549.
- [CrossRef] [Google Scholar]
- Simulation and design of fluid – catalytic cracking riser – type reactors. Comp. Chem. Eng. 1996;20:757-762.
- [Google Scholar]
- Renormalisation group analysis of turbulence: basic theory. J. Sci. Comput.. 1986;1(1):1-51.
- [Google Scholar]
- Computer simulation of a new gas – induced ozone reactor. Phoenics. 1999;12:326-328.
- [Google Scholar]
- Phonological studies of the new gas – induced agitated reactor using computational fluid dynamics. Environ. Technol.. 2000;22:647-651.
- [Google Scholar]
Appendix A
Supplementary data
Supplementary data associated with this article can be found, in the online version, at http://dx.doi.org/10.1016/j.jksus.2017.05.015.
Appendix A
Supplementary data


