

Translate this page into:
Prediction of phases and mechanical properties of magnesium-based high-entropy alloys using machine learning
⁎Corresponding author. robertkotieno2022@gmail.com (Robert Otieno),
-
Received: ,
Accepted: ,
This article was originally published by Elsevier and was migrated to Scientific Scholar after the change of Publisher.
Abstract
Abstract
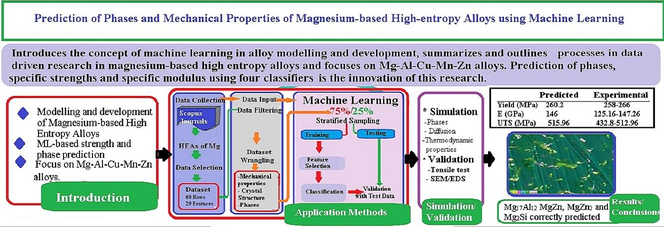
Introduces novel features tailored for magnesium-based HEAs for high specific strength at yield, ultimate tensile strength, and specific modulus. Advanced machine learning classifiers used for feature selection giving high prediction performance. A strong positive correlation was found between the specific strengths, specific modulus, and alloying elements composition. Phase prediction confirms presence of strengthening phases and this was verified through MatCalc simulation and SEM/EDS analysis, with tensile test results corroborating the predicted mechanical properties.
Abstract
Objectives
To predict phases and mechanical properties of Mg-Al-Cu-Mn-Zn alloys and to validate the results.
Methods
In this study, 29 predictor features of the alloys were examined based on dataset drawn from relevant publications. The correlation of selected predictor features with mechanical properties of Mg-Al-Cu-Mn-Zn alloys were evaluated. New features specific to vehicle and aerospace applications were used. Feature selection schemes involving four machine learning (ML) classifiers that included artificial neural networks (ANN), linear discriminant analysis (LDA), random forest regression (RF) and k-nearest neighbours (k-NN) were adopted. Tensile test was carried out based on ASTM E8 standard.
Results
Results of correlation of features showed that specific strengths and specific modulus of the alloys were strongly and positively correlated with composition of alloying elements but strongly and negatively correlated with composition of magnesium. The results also revealed that homogenization temperatures and time were weakly correlated with the mechanical properties and phases while electronegativity difference and VEC had significant positive correlation. ANN was the best performing classifier followed by k-NN, LDA, and lastly RF with prediction accuracy on test data of 98.7%, 98.1%, 97.9% and 97.8%, respectively. The validity and applicability of the model was tested with three magnesium-based alloys: Mg-80-Al-10-Cu-5-Mn-5-Zn-0, Mg-80-Al-5-Cu-5-Mn-5-Zn-5 and Mg-91.2-Al-8.3-Cu-0-Mn-0.15-Zn-0.35 and compared with findings in literature. The model had higher prediction accuracies compared to previous ML models used on magnesium alloys. The model was then used to predict phases in the Mg-89.43-Al-8.16-Cu-0.34-Mn-0.25-Zn-1.81 alloy and it accurately predicted presence of Mg17Al12, Mg2Si, MgZn and MgZn2. Results of simulation in MatCalc version 6.04 also verified presence of the phases. The phases were further confirmed through SEM/EDS analysis.
Conclusions.
Dominant strengthening phases were Mg17Al12, Mg2Si, MgZn and MgZn2. Predicted yield strength, ultimate tensile strength and Young’s modulus were within the range of experimental results. Specific strengths and specific modulus were also within the range.
Keywords
Magnesium alloys
Phase prediction
Machine learning
Predictor features
Mechanical properties

1 Introduction
A new area of interest in material science is modelling and development of materials with enhanced mechanical properties (Stergiou et al., 2023). One such interest is to be able to predict mechanical properties from compositions and phases of modern light alloys with low densities and high strength-to-weight ratios applicable in aerospace and light-vehicle industries (Feng et al., 2016). The light metals include high entropy alloys (HEAs) of aluminium, magnesium, titanium, and beryllium (Behera et al., 2022; Feng et al., 2016). Traditional methods for developing materials, such as empirical trial and error, may be replaced by machine learning (ML) techniques and artificial intelligence that are capable of predicting alloy phases and mechanical properties (Feng et al., 2016). Over the years, ML has been applied to various tasks of phase and mechanical property predictions that are computationally intensive with good results (Machaka, 2021).
ML algorithms provide fast and low-cost approach compared to traditional techniques of material design, phase prediction, analysis and modelling (Ford et al., 2021; Machaka, 2021). There is great research focus on prediction of phases and mechanical properties of high-entropy alloys of light metals (Qiao et al., 2021; Xiong et al., 2023). Exploration of phases and mechanical properties of magnesium alloys has risen over the years to because of lowest density of magnesium among other light metals and opportunity to reduce dead weight of vehicles, aircraft and spacecraft (Reza Kashyzadeh et al., 2023). There is a rising interest in Mg-Al-Cu-Mn-Zn that has seen improved mechanical properties based on varied percentages of the alloying elements and strengthening phases (Tun et al., 2019). However, existing ML-based research on high-entropy alloys lacks standardization, focuses generally, and fail to address the promising Mg-Al-Cu-Mn-Zn for lightweight, high-strength applications.
Previous research identified phases that were commonly associated with magnesium alloys. The phases included: Mg17Al12 in their gamma and beta states (Yamanoglu et al., 2021), laves phases such as Mg2Cu and MgCu2 (Fan et al., 2021), and MgZn2 and Mg2Zn11 (Bilbao et al., 2022). Other phases identified in literature and put in CALPHAD databases included β_Al3Mg2, θ_Al2Cu, Al2Cu3_D, Al9Cu11_Z,AlCu_ζ, AlCu_G_D83, AlCuMg_V (Tayyebi et al., 2021). Previous research such as Pei et al. (2020), Li and Tsai (2020), Li and Guo (2019) focused on crystal structures associated with alloy phases rather than actual phases.
Recent research efforts to predict phases and mechanical properties of magnesium alloys focused on understanding their phase transformations and mechanical properties under various conditions (Chen et al., 2020, 2019a, 2019b). Chen et al. (2019a) studied constitutive behaviour of AZ80 magnesium alloy during hot deformation using a segmented model that outperformed Arrhenius and Johnson–Cook models. The research provided a comprehensive understanding of high-temperature deformation characteristics relating to alloy phases. Chen et al. (2019b) explored the effects of ultrasonic vibration on the casting process of AZ80 alloy and found significant differences in mechanical properties in relation to phase. Chen et al. (2020) showed that Mg-Zn-Y alloy subjected to dual-frequency ultrasonic field result in improved mechanical strength, and corrosion resistance as a result of quasi-crystals. These studies collectively advance the prediction and optimization of phases and mechanical properties in magnesium alloys. These studies did not focus on specific strength and specific modulus and did not focus Mg-Al-Cu-Mn-Zn alloys. They also did not use ML algorithms.
Various researchers focused specifically on strength and phases of magnesium alloys using ML prediction techniques. Liu et al. (2021) developed high-strength Mg cast alloys by iteratively optimizing the composition and heat treatment condition based on a surrogate model that evolved with new data. Pei et al. (2020) used a random forest algorithm to investigate the deformation mechanisms and ductility of Mg. However, the specific strength and modulus were not tested in both cases. Mandal et al. (2022) used ML algorithms to predict phases in high entropy alloys and found that decision tree and SVM had 93.84% accuracy for phase prediction, and 84.32% for crystal structure classification, respectively. Most recent study by Dong et al. (2024) predicted ultimate tensile strength (UTS), yield strength (YS), elongation (EL), and hardness (HV) using Shapley additive explanations (SHAP) model and obtained accuracies of up to 93%. The study did not focus on specific strength and stiffness of the alloys for application in light vehicle and aerospace industries. It was also not specific to high entropy Mg-Al-Cu-Mn-Zn alloys.
Though ML has been used to predict phases and strengths of magnesium alloys, it has not been applied to Mg-Al-Cu-Mn-Zn alloys. Research has not focused on predicting phases, specific strength, and modulus of these alloys, despite their potential. There is need to explore these properties using ML to understand the composition-phase-strength/modulus relationship, as no single study has addressed this comprehensively. In this paper, strategies employed in previous studies on ML-based strength and phase prediction were reviewed. The objectives of the research were to predict phases, specific strengths and specific modulus of Mg-Al-Cu-Mn-Zn alloys based on their compositions and heat treatments. A dataset of Mg-Al-Cu-Mn-Zn alloys with strength and metallurgy-specific features presented. Analysis was conducted based on a framework developed by Machaka (2021).
2 Materials and methods
2.1 Classification framework
Framework for analysis used in this research was based on Fig. 1. Computational framework was anchored on four platforms as suggested by (Machaka, 2021). Data collection, filtering, and wrangling yielded four crystal structures, 20 phases, and 29 features. Data was processed, segmented, and split into 75% training and 25% testing. Feature selection and validation followed, with model performance tested.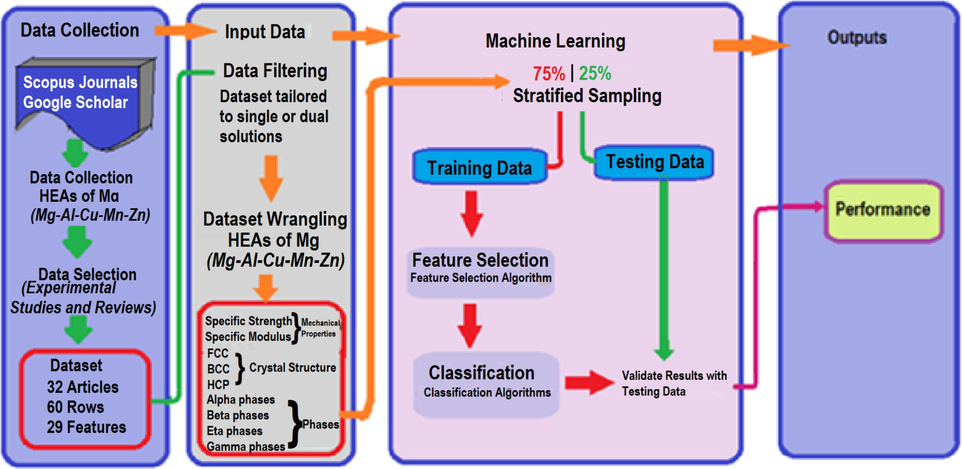
Phase and mechanical properties classification framework for ML. The figure illustrates the steps used in the ML classification including data collection, details of input data, machine learning process, outputs and performance.
2.2 Collection and selection of data
Data from research on magnesium alloys (Mg-Al-Cu-Mn-Zn) was cleaned, checked for missing data, encoded, and transformed for machine learning. Feature selection used backward elimination, forward selection, and regularization to identify significant features. New features such as density (Density_calc), change of entropy of mixing (dSmix), atomic size difference (Atom_Size_Diff), electronegativity difference (Elect_Diff) and valence electron concentration (VEC) were created using feature engineering (Bhandari et al., 2020; Machaka, 2021). dSmix was calculated based on Equation 1.
Change in enthalpy of mix was calculated using Equation 2.
Atomic size difference was calculated using Equation 3
Average atomic radius was given by Equation 4.
Valence electron concentration (VEC) was calculated based on Equation 5.
Electronegativity difference,
, was calculated based on Equation 6.
Where, in Equations 1 – 6.
R= Ideal gas constant;
and = atomic percentages of the and elements, respectively
= Radius of the element;
= Average atomic radius;
= Pauling electronegativity of the ith component;
= Mean electronegativity for alloy system;
= atomic percentage; and
= Valence electron concentration of the element.
Iterative testing evaluated the impact of engineered features on model performance, leading to optimized results. The final data had 60 observations and 29 variables. Multicollinearity tests showed that no Variance Inflation Factor (VIF) values exceeded 5 (see Table 1). There was moderate correlation for Atom_Size_Diff and Elect_Diff. VEC had low multicollinearity (VIF=1.27). There was no multicollinearity between the features that could affect the reliability of the predictive models as no VIF value exceeded the threshold of 5. This implied that each predictor variable, such as Atom_Size_Diff and Elect_Diff, provided unique and valuable information for the prediction without being overshadowed by correlations with other variables. The low VIF of 1.27 indicated that VEC was a stable predictor.
Density_calc
dHmix
dSmix
dGmix
Atom_Size_Diff
Elect_Diff
VEC
1.585639e-02
6.562312e-01
8.409286e-01
8.403489e-01
2.121941e + 00
2.090115e + 00
1.274882e + 00
Though the current dataset was small, it had more features compared to other datasets of magnesium-based alloys used in machine learning (He et al., 2023; Mi et al., 2022). The research used 29 features to improve ML model predictions despite a small dataset (Chen et al., 2021). Feature engineering technique proposed by Machaka (2021) was used to refactor the original dataset in order to fit the learning algorithm.
2.3 Feature selection and reduction of dimensions
This study used five stages of experiments as shown in Fig. 2. The first stage used all 29 features of the dataset as the baseline feature set. The second stage created four smaller feature sets by applying Boruta algorithm with the RF algorithm (Machaka, 2021). It also used recursive feature elimination based on RF regression. The third stage ordered the features by declined importance applying majority-vote ranking technique for better outcomes. The fourth stage grouped the ordered-features into seven sets with the top 5, 7, 10, 13, 15, 20, 25 feature sub-sets as proposed by (Machaka, 2021). The fifth stage involved determining and validating performance of different classifiers.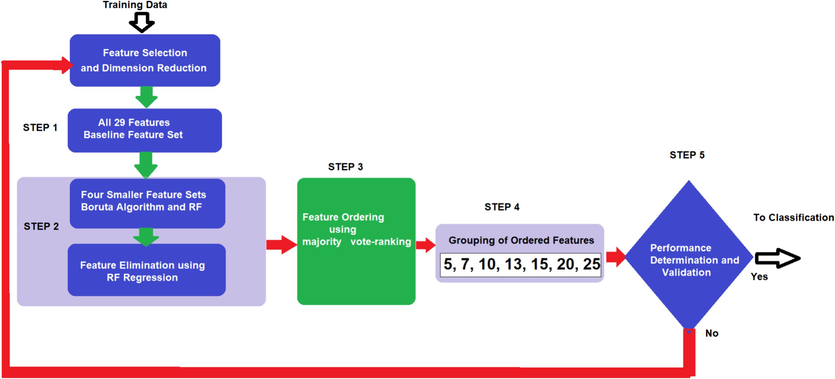
Feature selection. This illustrates the selection process across 5 steps. Output of the process becomes input to classification. A feedback loop in case the performance and validation are not satisfactory is also illustrated.
2.4 ML classifiers and performance evaluation criteria
In literature, several ML classifiers have been used in prediction of alloy phases and mechanical properties but only a few are applicable in small datasets which are associated with model over fitting or under fitting as well as and too high or too low feature dimensions (Xu et al., 2023). Algorithms for small datasets such as support vector machine (SVM), Gaussian process regression (GPR), gradient boosting decision tree (GBDT) and XGBoost though robust, have problems of inherent complexity, potential overfitting, and computational intensity. They falter with high dimensions and complex alloy data interactions. Conversely, RF, LDA, and kNN are more apt, with RF excelling in modelling non-linearities and preventing overfitting (Xu et al., 2023). LDA maximizes class separability in limited data and helps in dimensionality reduction (see Table 3). ANN was used to model non-linear relationships and transfer learning helped to leverage it to improve performance with the small dataset. k-NN was used to classify features based on similarity measures and its problems of dimensionality was addressed using principal component analysis (PCA). RF struggles with high-dimensional data, but feature selection helped to mitigate this. LDA may oversimplify, regularization was used to enhance robustness. Models were trained to identify high discriminant power features. A function was defined to calculate accuracy and kappa index using a confusion matrix. Classifier performance was evaluated with three magnesium-based alloys: Mg-80-Al-10-Cu-5-Mn-5-Zn-0, Mg-80-Al-5-Cu-5-Mn-5-Zn-5, and Mg-91.2-Al-8.3-Cu-0-Mn-0.15-Zn-0.35.
2.5 Simulation in MatCalc Software
Optimal values of density, yield strength, ultimate tensile strength and stiffness were obtained from the values of percentages generated from the objective functions. MatCalc 6.04 used classical nucleation theory to estimate alloy precipitates' development and granularity, based on the Svoboda–Fischer–Fratzl–Kozeschnik (SFFK) model. Alloy composition (Mg, Al, Cu, Mn, Zn) was optimized using genetic algorithms and Generalized Reduced Gradient (GRG) non-linear programming in Matlab R2023b for optimal properties.
Density of Mg is given by
g/cm3, of Al is
g/cm3, Cu is
g/cm3, Mn is
g/cm3 and Zn is
g/cm3. Masses of the components were
,
,
,
and
for magnesium, aluminium, copper, manganese and zinc. Density estimation was done using alloy formula in Equation 7 and 8 based on density of components.
=mass of alloy in grams;
=volume of alloy, cm3,
But
is the sum of volumes of the components of the alloy. Meaning volume of magnesium,
, aluminium,
, copper,
, manganese,
and
.
Percentages of the components by weight were
,
,
,
, and
for magnesium, aluminium, copper, manganese and zinc
The specific strength at yield,
,
and specific modulus
became the objective functions for genetic algorithm implementation of multi-objective. The aim was to maximize each as shown in Equation 11.
Substituting for percentage components from Equation 10 into Equation 11, the objective functions were as shown in Equation 12.
Additional parameters were essential for the kinetic simulations of precipitation, which included microstructural details and nucleation configurations. The kinetic simulation parameters encompassed thermal treatments, specifying formation at 1300°C and normalization at 400°C for one hour, alongside grain size and dislocation density considerations.
MatCalc 6.04 was used to capture precipitation domains for Mg, Al, Cu, Mn, and Zn solutes with specific trapping enthalpies. It identified precipitates like MgZn, Mg2Cu, and MnAl phases. The thermal protocols were set to begin with casting at 1300°C, then cooling to 400°C at −0.75°C/s. Homogenization was at 400°C to reduce grain sizes, followed by quenching to 25°C at −100°C/s aimed at enhancing strength and stabilize properties.
2.6 Mechanical tests
Mg-89.43-Al-8.16-Cu-0.34-Mn-0.25-Zn-1.81 alloy obtained from optimization results was produced using stir casting technique from source material AZ91D to which quantities of pure copper, zinc and manganese powders were added. The alloy was prepared in inert argon gas atmosphere with melt heated to 1300°C for about 20 min. Pouring was done in graphite coated pre-heated steel mould. The melt was left to homogenize at 400°C for one hour after which quenching was done in oil. The casting products were age-hardened for seven days, machined into six test samples, and prepared for tensile tests per ASTM E8. Tests in a Universal Testing Machine determined yield strength, ultimate tensile strength, and Young’s Modulus, compared to predicted values.
2.7 Scanning electron microscopy and EDS analysis
The microstructure of the Mg-89.43-Al=8.16-Cu-0.34-Mn-0.25-Zn-1.81 alloy was characterized using scanning electron microscope (SEM) (Tun et al., 2019). Sample preparation involved polishing, embedding, mounting, dehydration, and cleaning. Samples were made electrically conductive for SEM analysis. Images formed from backscattered and secondary electrons. 50mm diameter, 4mm thick samples were prepared using nitric acid and ethanol, adhered to stubs with carbon tape, and vacuum-dried for 30 min.
3 Results and discussions
3.1 Results of ML prediction
The results revealed that homogenization temperatures and time were weakly correlated with the mechanical properties and phases while electronegativity difference and VEC had significant positive correlation. Linear discriminant analysis (LDA) results in Table 2 showed that synthesis methods significantly affected alloy properties. The properties affected included yield strength, UTS, elastic modulus (E), VEC, atomic size difference (Atom_Size_Diff), and enthalpy of mixing (dHmix). Die casting (DC) had a high probability of 0.78889, solution treatment (ST_4) had probability of 0.66667 and solution treatment with age-hardening (ST_6) had highest probability of 0.86667. Induction melting (IM) and disintegrated melt deposition (DMD) had probabilities of 0.75556 and 0.82222, respectively. Yield strength had negative coefficients in all discriminant functions, aiding class differentiation. LD1, LD2, LD3, and LD4 maximized separation between different phases or compositions. Each LD represented a direction in feature space along which the data was projected to achieve maximum separation. LD1 showed the direction that maximized the separation between the most distinct classes, often capturing the most variance. LD2 was orthogonal to LD1 and would maximize separation not captured by LD1. This process continued with each subsequent LD (LD3, LD4, LD5) being orthogonal to the previous ones and capturing the maximum separation possible.
Synthesis route
Yield
UTS
E
VEC
Atom_Size_Diff
dHmix
Probabilities
ST_6
134.83
227.50
82.64
2.06
0.02
−205.55
0.86667
ST_4
211.00
318.00
49.35
2.10
0.04
−1380.06
0.66667
DC
291.23
490.46
141.31
2.36
0.07
−4652.25
0.78889
IM
92.29
260.86
72.93
2.06
0.03
−265.06
0.75556
DMD
151.00
256.00
75.14
2.06
0.03
−472.24
0.82222
With respect to synthesis route
Properties
LD1
LD2
LD3
LD4
LD5
Yield
−0.0184
−0.0117
−0.0252
−0.0065
−0.0190
UTS
−0.0220
0.0030
0.0009
0.0312
0.0244
E
−0.0141
−0.0112
−0.0161
−0.0173
0.0204
VEC
−139.2761
−0.0336
109.955
−11.2031
53.0878
dHmix
0.3439
0.7202
−0.19009
−0.0224
−0.1408
With respect to phases
Property
LD1
LD2
LD3
LD4
Yield
−0.1449
−0.0371
−0.0782
−0.0121
UTS
0.0058
0.0674
0.0332
−0.0284
E
0.0263
−0.0582
0.0028
−0.0454
VEC
35.992
−92.789
31.0342
3.6329
Atom_Size_Diff
608.67
92.705
−69.6795
−148.965
dHmix
−0.0041
−0.0039
0.0007
−0.0039
UTS was positively correlated with LD2 and LD3, while Young’s modulus had mixed effects on LD1 and LD2 (See Table 3). VEC significantly influenced LD1 and LD3, but not LD2. Atom_Size_Diff impacted LD1, and to a lesser extent LD3 and LD4. dHmix minimally affected class differentiation. LDA highlighted phase distinctions, with LD1 explaining 42.97% variance, significant for phase identification, contrasting with minimal 3.71% of LD5. Negative coefficients of VEC in LD1 and LD2 underscored its importance, with a positive impact in LD1. High dHmix suggested distinct phase formation in magnesium alloys. Beta-Mg17Al12 was likely to be in group 5 (75.6%) or group 4 (82.2%), while Gamma-Mg2Si and Mg2Cu had a 40% chance of classification in group 1. Similar results were found with magnesium alloys that were studied by Machaka (2021) and Tun et al. (2019).
Random forest regression yielded near-perfect categorization with negligible OOB error, predicting alloy synthesis pathways. ANN with a 6–10-5 model structure effectively predicted synthesis techniques, avoiding overfitting. Results in Fig. 3 showed that ANN outperformed other models with prediction accuracy of 98.70%, precision of 98.41%, recall of 98.12%, and an F1-score of 98.70% with the proposed framework. k-NN algorithm followed closely, with slightly lower metrics across the board. The resuls that ANN had highest accuracy corroborate findings of Machaka (2021). LDA showed exceptional precision at 99.55% but lagged slightly in other areas. RF algorithm demonstrated consistent performance, though it had the lowest metrics among the evaluated algorithms. Therefore, ANN algorithm demonstrated the most balanced performance, suggesting its suitability.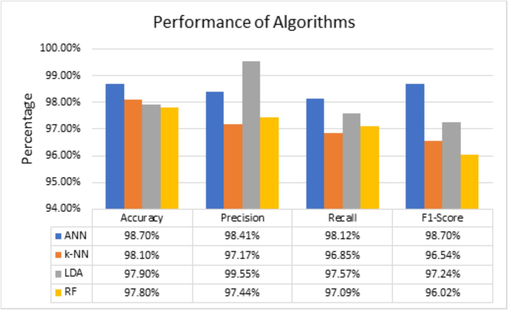
Performance of the algorithms. It illustrates that ANN was the best followed by k-NN in terms of prediction accuracy. LDA performed best followed by ANN in terms of precision.
3.2 Results of MatCalc simulation
Simulation results in MatCalc 6.04 showed a high number of fine precipitates with a uniform distribution suggested consistent mechanical properties. Gamma-Mg17Al12 had an extremely low mean phase fraction and low precipitate number, implying it was residual or undeveloped. The Q-AlCuMg phase (Q_ALCUMG_P0) had a higher mean phase fraction, indicating significant presence. Other phases included Mg2Si, MgZn, and MgZn2. Thes results confirm findings of Bilbao et al. (2022) and Tayyebi et al. (2021) on intermetallic phases.
3.3 Results of SEM/EDS analysis
At magnifications of X500 and X10,000, the microstructure in Fig. 4 exposed the intricate details of the grain boundary nucleation. It showcased the presence of Mg17Al12, alpha_Mg, and Q_AlCuMg clusters. The white regions denoted the Mg17Al12 phase. The grey regions represented the alpha-Mg matrix and the dark grey areas correspond to the Q_AlCuMg intermetallic clusters. The clarity in grain boundary nucleation of the same phases in Fig. 4 suggested a repeatable and reliable microstructural pattern.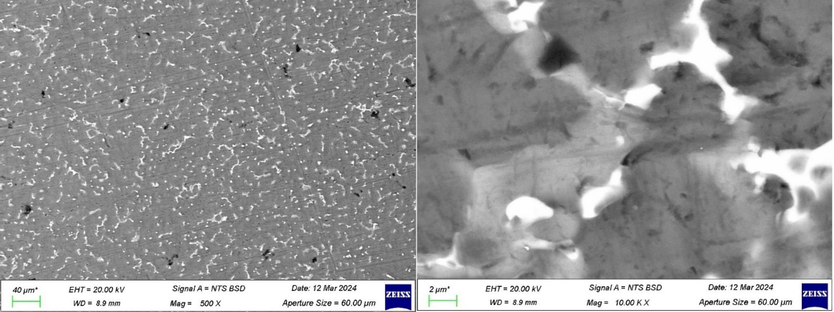
Tested alloy showing grain boundaries at X500 and X10,000.
Spectrum 1 and EDS in Fig. 5 showed that magnesium was predominant, with traces of oxygen. Fig. 6 confirmed no peaks were omitted, representing all elements present. The EDS analysis in Fig. 7 showed magnesium as the main element in Spectrum 3, with 70.96% weight and 72.91% atomic percentage. Aluminium was 20.11% by weight and 18.62% atomic percentage. The MgZn phase (6.37 wt%) indicated strengthening. Presence of 10.83 wt% MgO was due to surface oxidation, serving as a protective barrier against further corrosion.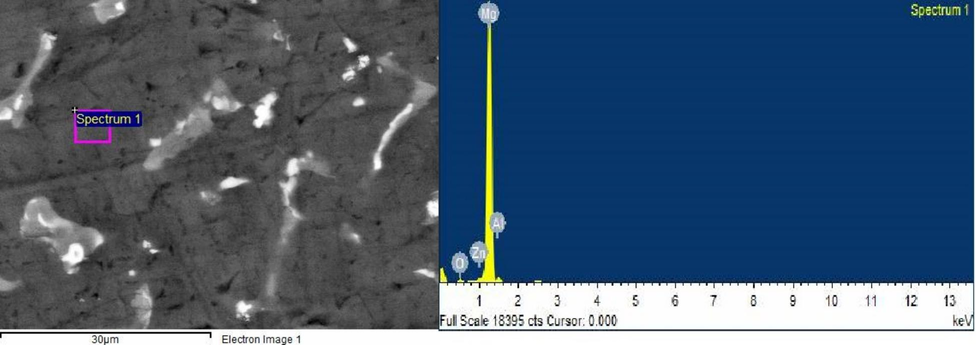
EDS Spectrum 1 and point of its collection.
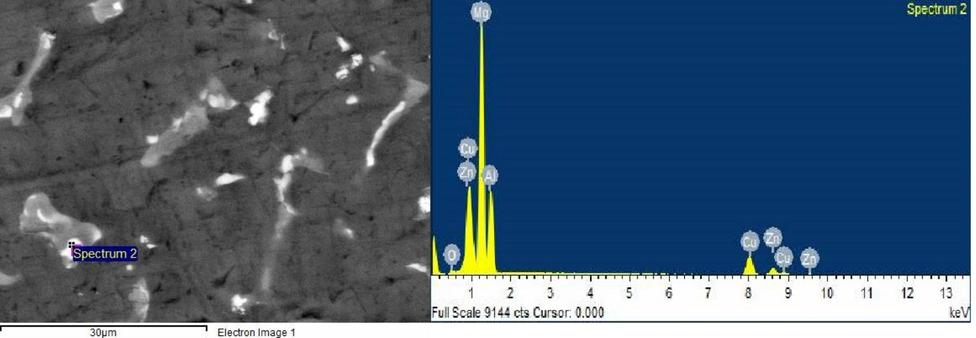
EDS Spectrum 2 and point of its collection.
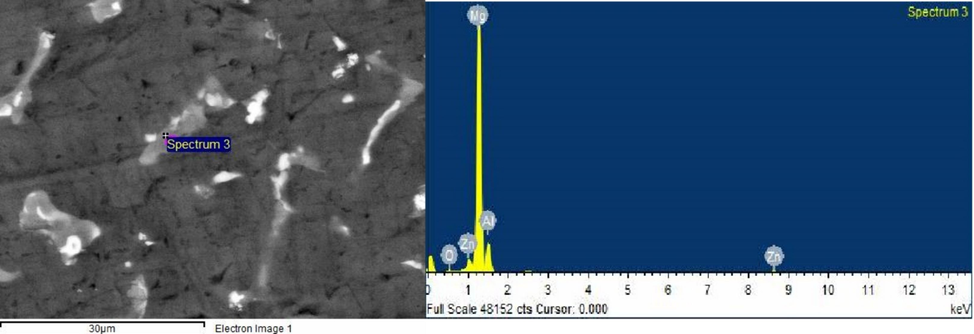
EDS Spectrum 3 and point of its collection.
3.4 Results of tensile test
The predicted and experimental values for the mechanical properties of the alloy closely matched, with slight variances in yield strength and Young’s Modulus. The UTS showed a broader experimental range, with significant deviations at the lower end. Specific strength and modulus had more discrepancies, likely due to alloy composition, microstructure, or testing conditions. Six samples were tested, all fracturing in the middle, indicating material consistency. Extensions at yield and fracture were 0.102439mm and 1.03mm, respectively, indicating low ductility. The predictions were reliable but could be refined for better accuracy.
4 Conclusions
The ANN framework outperformed traditional predictors due to clean, well-labelled, and unbiased data. Despite a small dataset, carefully chosen features led to good performance. SEM/EDS results showed that the tested alloy was precipitation hardened with key hardening phases being Mg17Al12, traces of Mg2Si, MgZn, MgZn2, MgCu2 and the hexagonal crystal structured intermetallic alloy strengthening Q-AlCuMg phase. Presence of Mg17Al12 and Mg2Si was correctly predicted through machine learning and simulation techniques. Mg17Al12, MgZn, MgZn2 and MgCu2 were correctly predicted through thermodynamic and diffusion simulation. The intermetallic LAVES_C15_P0 clusters and Mg17Al12 in the microstructure were the possible reason for low ductility of the material.
The tested material had yield strength, UTS and Young’s Modulus that were close to the predicted values. Predicted yield strength was 260.2MPa while experimental values were in the range of 258-266MPa. Predicted Young’s Modulus was 146GPa while experimental values fell in the range of 125.16–147.26MPa. Experimental UTS was in the range of 432.8–512.96GPa slightly below the predicted 515.96GPa. The proposed alloy was found to have lower density of 1.8259g/cm3 than 2.15g/cm3 found by Tun et al. (2019). The density was only 0.0676% higher than the predicted optimal value of 1.824667 g/cm3. The predicted optimal specific strength of 142.6 kPam3/kg at yield was in the range of experimental values of 141.3–145.68 kPam3/kg. Experimental specific strength with UTS was in the range of 237.03–280.94 kPam3/kg lower than predicted 282.77 kPam3/kg. Predicted specific modulus was 80.096 MPam3/kg while experimental were in the range of 68.55–80.65M Pam3/kg. The high specific strength and modulus were associated with strengthening phases of gamma- Mg17Al12, MgZn, MgZn2 and MgCu2.
Funding
This research did not receive any specific grant from funding agencies in the public, commercial, or not-for-profit sectors.
CRediT authorship contribution statement
Robert Kennedy Otieno: Writing – review & editing, Writing – original draft, Visualization, Validation, Software, Resources, Project administration, Methodology, Investigation, Formal analysis, Data curation, Conceptualization. Edward V. Odhong: Visualization, Validation, Supervision, Software, Resources, Methodology, Formal analysis, Data curation, Conceptualization. Charles Ondieki: Validation, Supervision, Project administration, Methodology, Investigation, Data curation.
Acknowledgment
This is to acknowledge Semi-Conductor Technologies Limited for their help with SEM/EDS scanning and analysis. This is to thank Prof Geoffrey of Penn State University for his insights and advice on phase analysis, prediction and data analysis with small datasets. We also acknowledge Qingdao Century Hengyuan Machine Company Limited for providing AZ91D, copper powder, zinc and manganese. Dr. James Mutua and Dr. Japheth Obiko of Jomo Kenyatta University of Agriculture and Technology are also acknowledged for SEM/EDS analysis done at South African Laboratories.
Declaration of competing interest
The authors declare that they have no known competing financial interests or personal relationships that could have appeared to influence the work reported in this paper.
References
- Behera, A., Sahoo, A.K., Mohapatra, S.S., 2022. Nickel–titanium smart hybrid materials for automotive industry, in: Thomas, S., Behera, Ajit, Nguyen, T.A. (Eds.), Nickel-Titanium Smart Hybrid Materials, Micro and Nano Technologies. Elsevier, pp. 271–295. DOI: 10.1016/B978-0-323-91173-3.00015-8.
- Mechanical and thermal properties of low-density Al20+xCr20-xMo20-yTi20V20+y alloys. Crystals. 2020;10:278.
- [CrossRef] [Google Scholar]
- X-ray thermo-diffraction study of the aluminum-based multicomponent alloy Al58Zn28Si8Mg6. Materials. 2022;15:5056.
- [CrossRef] [Google Scholar]
- Chen, C., Liu, D., Deng, S., Zhong, L., Chan, S.H.Y., Li, S., Hng, H.H., 2021. Accurate machine learning models based on small dataset of energetic materials through spatial matrix featurization methods. J. Energy Chem., In Celebration of the 100th anniversary of Chemisry at Nankai University 63, 364–375. DOI: 10.1016/j.jechem.2021.08.031.
- A constitutive relation of AZ80 magnesium alloy during hot deformation based on Arrhenius and Johnson-Cook model. J. Mater. Res. Technol.. 2019;8:1859-1869.
- [CrossRef] [Google Scholar]
- Comparison study of hot deformation behavior and processing map of AZ80 magnesium alloy casted with and without ultrasonic vibration. J. Alloys Compd.. 2019;803:585-596.
- [CrossRef] [Google Scholar]
- Microstructure, mechanical properties and corrosion behavior of quasicrystal-reinforced Mg-Zn-Y alloy subjected to dual-frequency ultrasonic field. Corros. Sci.. 2020;163:108289
- [CrossRef] [Google Scholar]
- Machine learning aided prediction and design for the mechanical properties of magnesium alloys. Met. Mater. Int.. 2024;30:593-606.
- [CrossRef] [Google Scholar]
- Ultra-rapid synthesis of the MgCu 2 and Mg 2 Cu Laves phases and their facile conversion to nanostructured copper with controllable porosity; an energy-efficient, reversible process. Green Chem.. 2021;23:6936-6944.
- [CrossRef] [Google Scholar]
- Machine learning-based accelerated property prediction of two-phase materials using microstructural descriptors and finite element analysis. Comput. Mater. Sci.. 2021;191:110328
- [CrossRef] [Google Scholar]
- Predicting thermodynamic stability of magnesium alloys in machine learning. Comput. Mater. Sci.. 2023;223:112111
- [Google Scholar]
- Machine-learning model for predicting phase formations of high-entropy alloys. Phys. REv. Mater.. 2019;3:095005
- [CrossRef] [Google Scholar]
- Theories for predicting simple solid solution high-entropy alloys: Classification, accuracy, and important factors impacting accuracy. Scr. Mater.. 2020;188:80-87.
- [CrossRef] [Google Scholar]
- Accelerated development of high-strength magnesium alloys by machine learning. Metall. Mater. Trans. A. 2021;52:943-954.
- [Google Scholar]
- Machine learning-based prediction of phases in high-entropy alloys. Comput. Mater. Sci.. 2021;188:110244
- [CrossRef] [Google Scholar]
- Mandal, P., Choudhury, A., Basu, M.A., Ghosh, M., 2022. Phase Prediction in High Entropy Alloys by Various Machine Learning Modules Using Thermodynamic and Configurational Parameters. Met. Mater. Int.
- A reverse design model for high-performance and low-cost magnesium alloys by machine learning. Comput. Mater. Sci.. 2022;201:110881
- [Google Scholar]
- Machine-learning informed prediction of high-entropy solid solution formation: Beyond the Hume-Rothery rules. Npj Comput. Mater.. 2020;6:1-8.
- [CrossRef] [Google Scholar]
- A focused review on machine learning aided high-throughput methods in high entropy alloy. J. Alloys Compd.. 2021;877:160295
- [Google Scholar]
- A critical review on improving the fatigue life and corrosion properties of magnesium alloys via the technique of adding different elements. J. Mar. Sci. Eng.. 2023;11:527.
- [Google Scholar]
- Enhancing property prediction and process optimization in building materials through machine learning: A review. Comput. Mater. Sci.. 2023;220:112031
- [CrossRef] [Google Scholar]
- Effects of strain accumulation and annealing on interfacial microstructure and grain structure (Mg and Al3Mg2 layers) of Al/Cu/Mg multilayered composite fabricated by ARB process. J. Mater. Res. Technol.. 2021;14:392-406.
- [CrossRef] [Google Scholar]
- Tun, K.S., Kumar, A., Gupta, M., 2019. Introducing a high performance Mg-based multicomponent alloy as an alternative to Al-alloys. Front. Mater. 6.
- Recent advances on lightweight high-entropy alloys: process, design, and applications. High Entropy Alloys Mater. 2023:1-20.
- [Google Scholar]
- Small data machine learning in materials science. Npj Comput. Mater.. 2023;9:1-15.
- [CrossRef] [Google Scholar]
- New magnesium composite with Mg 17 Al 12 intermetallic particles. Powder Metall. Met. Ceram.. 2021;60:216-224.
- [Google Scholar]
Appendix A
Supplementary data
Supplementary data to this article can be found online at https://doi.org/10.1016/j.jksus.2024.103456.
Appendix A
Supplementary data
The following are the Supplementary data to this article:


