

Translate this page into:
Integrative bioinformatics analysis of transcriptomic data from CD8+ T cells in Systemic Lupus Erythematosus
⁎Corresponding author. b.reenarajkumari@vit.ac.in (Reena Rajkumari Baskaran)
-
Received: ,
Accepted: ,
This article was originally published by Elsevier and was migrated to Scientific Scholar after the change of Publisher.
Abstract
Introduction
Systemic Lupus Erythematosus (SLE) is a complex, multisystem autoimmune disorder characterized by extensive inflammation that affects nearly all organ systems in the body. It is primarily mediated by auto-antibodies and immune complexes, and it predominantly affects women more than men. This study employs an in-silico approach to identify key genes potentially involved in the pathogenesis of SLE.
Objectives
To identify key genes potentially involved in SLE pathogenesis using in-silico approach.
Methods
High-throughput sequencing dataset GSE97264, from the Gene Expression Omnibus (GEO) database, which contains RNA transcriptome data from CD8+ T-cells of 18 SLE patients and 14 healthy controls was utilized for the analysis. Differentially expressed genes (DEGs) were identified using the Bioconductor DESeq2 package in R platform. Gene Ontology (GO) and pathway enrichment analyses were performed using the ToppGene suite. Motif analysis of the genes’ promoter regions was conducted using HOMER software. Protein-protein interaction (PPI) and Reactome functional interaction (FI) networks were created using Cytoscape plugins StringApp and ReactomeFIViz, and analysed to identify hub genes.
Results
Our analysis identified 931 DEGs, with 577 upregulated and 354 downregulated. GO and pathway enrichment analyses indicated that upregulated genes were associated with immune responses, including cytokine production and receptor activation. Motif analysis identified key regulatory motifs linked to immune regulation in upregulated genes and T-cell activation in downregulated genes. PPI and FI networks analyses revealed 29 cell cycle-associated hub genes, with 10 genes—CDK1, TPX2, BIRC5, CCNA2, BUB1, BUB1B, AURKA, KIF2C, PLK1, and CDCA8—common to both biological networks, suggesting their crucial role in SLE pathogenesis.
Conclusion
This study suggests that dysregulation of the identified 10 genes may impact immune responses and contribute to the autoimmune-like conditions observed in SLE. Several of these genes are also implicated in other autoimmune diseases, highlighting their potential as SLE biomarkers. Despite their known roles in other immune-related diseases involving CD8+ T cells, their direct association with SLE had not been previously established. This novel finding underscores the potential of these genes as therapeutic targets and may contribute to the development of diagnostic tools.
Keywords
Systemic Lupus Erythematosus (SLE)
CD8+ T cells Transcriptomics
Gene Expression Analysis
Biological Networks
Biomarkers for SLE

1 Introduction
Systemic Lupus Erythematosus (SLE) is a chronic autoimmune disease characterized by the immune system's attack on its own tissues, which can affect both sexes. This leads to inflammation and, in some cases, permanent tissue damage affecting various body parts including the skin, joints, heart, lungs, kidneys, and brain (Cojocaru, 2011). The exact causes of SLE remain largely unknown; however, scientists have identified several potential triggers, such as genetic, environmental, and inflammatory factors (Robinson et al., 2021). It is postulated that an impairment in the normal clearance of apoptotic and necrotic cells may result in immune system dysregulation, whereby the immune system is misled into fighting itself, leading to SLE (Robinson et al., 2021). The course of disease progression is not linear, often characterized by relapse and remission phases, leading to considerable variability among patients, which presents significant difficulties in diagnosis and therapeutic interventions (Cojocaru, 2011).
The pathophysiology of SLE is mediated by autoantibodies and immune complexes. A deficiency in complement proteins (C1, C2, C3, C4) impairs the efficient removal of apoptotic cells by macrophages, resulting in the exposure of nuclear material and internal proteins (antigens). These antigens are captured by Antigen-Presenting Cells (APCs) and presented to naive T-helper cells, triggering their activation and differentiation. In SLE, IL-4 secretion favors T-helper 2 cell maturation, which in turn promotes antibody-mediated immune responses. Autoantibody production, particularly anti-nuclear antibodies (ANA) and anti-double-stranded DNA (anti-dsDNA) antibodies, is attributed to activated B-cells that evolve into plasma cells, which remember the antigen and secrete more autoantibodies. (Robinson et al., 2021).
When autoantibodies bind to nuclear proteins, they trigger inflammation through various mechanisms. Immune complexes may deposit on organs or bind to Fc receptors on immune cells, leading to complement activation and the release of pro-inflammatory cytokines like interferons and TNF-alpha (Robinson et al., 2021). After surrounding immune cells become sensitized to the antigens, they release cytokines upon recognizing the nuclear antigen through the TOLL-like receptor, exacerbating the inflammatory response and further damaging nearby cells. The inflammation eventually subsides due to the immune system's innate regulation (Robinson et al., 2021).
CD8+ cytotoxic T cells, part of the host defence mechanism, are activated by APCs presenting antigens via MHC-I molecule. Several studies have reported varied functions of CD8+ cells in SLE. In SLE patients, systemic CD8+ T cells demonstrate diminished effector functions and cytolytic activity, which compromises their ability to efficiently clear infections and autoreactive B-cells. These cells also demonstrate increased infiltration capacity, especially in the kidneys, contributing to organ damage (Chen and Tsokos, 2021). Despite various assumptions about the role of CD8+ T cells in SLE, the precise scenario remains unclear, warranting further exploration.
In this study, we have utilised the dataset from Buang et al., deposited in the Gene Expression Omnibus Database, containing mRNA samples from blood CD8+ T cells of SLE patients and healthy controls (Buang, 2021). We identified Differentially Expressed Genes (DEGs) between the SLE and control samples using the DESeq tool and categorized the upregulated and downregulated genes. To understand the functional and biological significance of these genes, we performed Gene Ontology (GO), Gene Family, and Reactome Pathway Enrichment analysis using the ToppGene Suite server. We also built a Reactome Functional Interactome Network and a STRING protein–protein interaction (PPI) network to identify hub genes in both networks. This study aims to unveil previously unexplored pathogenic genes, enhancing understanding of SLE's genetic-environmental interplay, aiding in diagnosis and treatment.
2 Methods and Materials
2.1 Rna-seq data from SLE patients and healthy controls
The raw data for this study were sourced from the RNA transcriptome deposited by Buang et al., (Buang, 2021) in the Gene Expression Omnibus (GEO) database under the entry GSE97264. The transcriptome was obtained from the blood CD8+ T cells of SLE patients and healthy controls. The study included 16 SLE patients with active disease, 18 with less active disease, and 14 healthy controls. The British Isles Lupus Assessment Group (BILAG) and Systemic Lupus Erythematosus Disease Activity Index (SLEDAI score) were used to classify the patients. For this study, we selected data from patients with active SLE and healthy controls from the GSE97264 dataset.
2.2 Differential Gene expression analysis
The differential gene expression (DGE) analysis was conducted using DESeq2, a Bioconductor package, in R platform. Initially the count data was converted into “DESeqDataSet” object using the function ‘DESeqDataSetFromMatrix’ from DESeq2 package v 1.40.2. Then the DGE analysis based on the Negative Binomial (a.k.a. Gamma-Poisson) distribution was performed using the ‘DESeq’ function. The function followed a default workflow of estimating size factors, estimating dispersions, fitting model and testing (replacing outliers and refitting genes). The Wald test was employed to evaluate the significance of DEGs. The resulting p-values were then adjusted for multiple testing using the Benjamini-Hochberg (BH) method to control for the false discovery rate (FDR). Finally, the genes that have log2FC > |1| and padj (FDR) < 0.05 were considered as DEGs.
2.3 Gene Ontology and pathway enrichment analyses
GO functional and pathway analyses was performed using the ToppGene Suite server. GO analyses (biological process, molecular function, cellular component), gene family, and pathway enrichment analyses were executed using the ToppFun function. The probability distribution function was selected for the p-value method, and a cut-off criterion of Gene count < 2 and FDR B&H q value < 0.05 was applied in the ToppFun function for these analyses (Premanand and Reena Rajkumari, 2023).
2.4 Motif analysis
The Homer v4.11 software was used to identify gene-based motifs in the promoter regions of the DEGs. For this study, the promoter regions were defined as 2,000 bp upstream and 200 bp downstream of the transcriptional start sites based on RefSeq genes (Hg38)). Motifs with a maximum length of 12 bases were probed, with a Benjamini-Hochberg-corrected p-value threshold of < 0.05 (Premanand and Reena Rajkumari, 2023).
2.5 STRING protein–protein network analysis
The STRING database was used to construct the PPI network for the identified DEGs. The Cytoscape plugin stringApp v2.0.1 was employed to generate the PPI interaction network, setting the highest confidence interaction score at 0.900 to refine the network (Premanand and Reena Rajkumari, 2023).
2.6 Reactome functional interaction network analysis
ReactomeFIViz v8.0.6, a Cytoscape tool, was used to create networks using the Reactome functional interaction (FI) network. The tool utilizes Reactome, a biological pathway database, to derive interaction information. The FI network for our DEGs was built using the 2022 version of the Reactome FI network (Premanand and Reena Rajkumari, 2023).
2.7 Network analysis and hub gene identification
Hub genes in the PPI and FI networks were identified using the Cytohubba v0.1 plugin. They were ranked according to six topological centralities and algorithms, including Maximal Clique Centrality (MCC), Maximum Neighbourhood Component (MNC), Density of Maximum Neighbourhood Component (DMNC), Degree, Closeness, and Betweenness (Premanand and Reena Rajkumari, 2023).
3 Results
3.1 Identification of DEGs in SLE CD8+ T cells
The DGE analysis identified 931 genes as DEGs with, 354 genes downregulated and 577 upregulated in CD8+ T cells from active SLE patients compared to healthy controls (Supplementary I). The top 10 upregulated and downregulated genes are shown in Fig. 1. Additionally, the DEGs identified in our analysis are statistically depicted using a volcano plot in Fig. 1.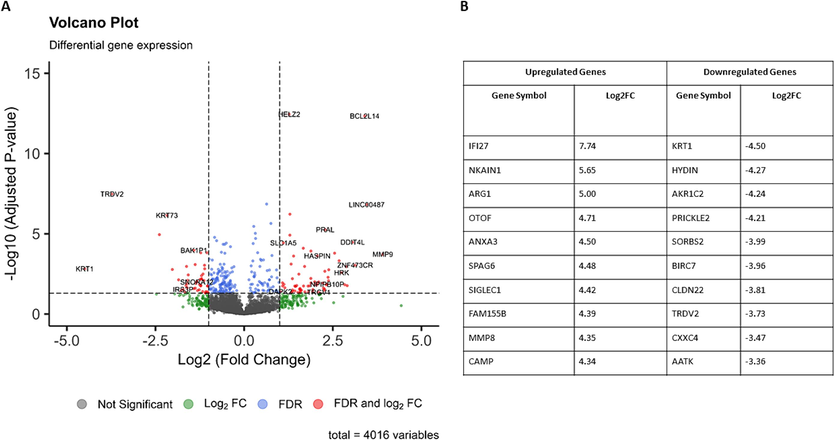
Volcano plot depicting the distribution of the DEGs identified in the SLE samples with the cut-off values log2FC>|1| and q-value < 0.05 and top 10 Up-Regulated and Down-Regulated DEGs Identified in the Study.
3.2 Gene Ontology and pathway enrichment analyses
Gene family enrichment analysis revealed that the upregulated DEGs are associated with immunoglobulins and CD molecules, while down-regulated DEGs are linked to keratins, collagens, fibronectin (Supplementary II-1). GO functional enrichment analysis (Fig. 2, Supplementary II-2) showed distinct profiles for DEGs in SLE. Upregulated genes were predominantly associated with inflammation-related GO terms across three categories: molecular function (MF), biological process (BP), and cellular component (CC). Specifically, the enriched GO MF terms included antigen binding and toll-like receptor binding. In the CC category, terms like IgA and IgG immunoglobulin complexes were prominent. Meanwhile, BP terms highlighted were adaptive immune response, chronic inflammatory response, cytokine production, innate immune response, interferon-mediated signaling pathway, and leukocyte migration involved in the inflammatory response (Fig. 2, Supplementary II-2). These terms collectively suggest heightened inflammatory activity consistent with the clinical manifestations typically observed in SLE (Gottschalk et al., 2015).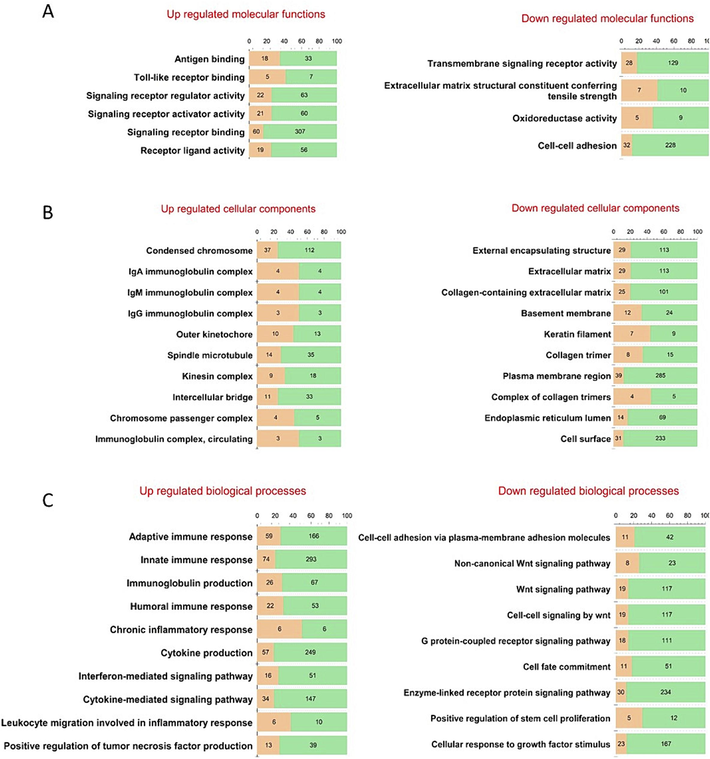
Gene Ontology analysis result of DEGs (FDR<0.05) using ToppGene Suite.
Conversely, downregulated genes were enriched with GO MF terms such as oxidoreductase activity, and BP terms like G protein-coupled receptor signaling pathway, Wnt signaling pathway, and cell–cell signaling by Wnt (Fig. 2, Supplementary II-2). The enrichment of these GO terms for downregulated DEGs reflects disrupted immune responses characterized by altered chemotaxis, impaired adhesion, and modified CD8+ T cell function, a known feature of SLE pathology (Gottschalk et al., 2015).
Pathway enrichment analysis enriched Reactome pathways such as FCGR3A mediated IL-10 synthesis, activation of B cell receptor, and several cell cycle associated pathways for upregulated DEGs. On the other hand, pathways related to matrisome, basement membrane and collagen were enriched for the downregulated DEGs (Supplementary II-3).
3.3 Motif analysis of dysregulated genes in SLE
The motif enrichment analysis on the promoter regions of DEGs provided insights on the potential transcription factors that might play a significant role in SLE pathogenesis (Fig. 3, Supplementary II-4&5). Downregulated genes had motifs for transcription factors such as MyoG, ASCL1, LRF, Gata1, EGR1, E2A, and NFAT (Fig. 3). MyoG, a basic helix-loop-helix (bHLH) family member, is involved in MEF2′s immune response in T lymphocytes (Maglott, 2007). ASCL1, also a bHLH factor, plays a role in T-cell development and the Wnt/β-catenin pathway (Johansson et al., 2009). LRF, a Kruppel family member, is crucial for T cell differentiation (Carpenter, 2012), while GATA1, a zinc finger transcription factor, is linked with T-cell differentiation (Sundrud, 2005). EGR1, another zinc finger transcription factor, activates macrophage transcription and is associated with immune response genes, including Tumor Necrosis Factor (Woodson and Kehn-Hall, 2022). E2A, a bHLH member, is essential for early B and T cell development (Wan, 2022). NFAT, a redox-dependent factor, affects CD8+ T cell cytotoxicity and metabolism (Klein-Hessling, 2017). The enrichment of these transcription factor motifs in the down-regulated genes suggests immune system aberration in SLE.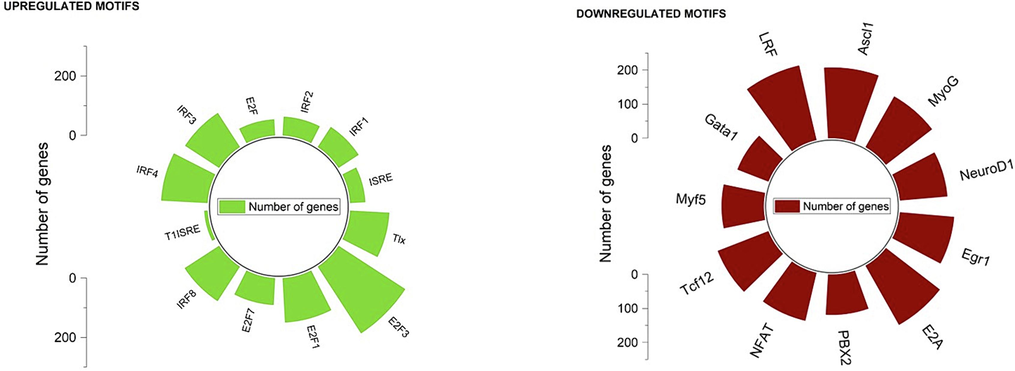
Motif enrichment analysis result.
Upregulated genes were enriched with motifs for IRF4, T1SRE, E2F7, E2F3, E2F1, IRF1, ISRE, IRF3, and IRF2 (Fig. 3). The Interferon Regulatory Factor family members (IRF1, IRF2, IRF3, and IRF4) were notably enriched, suggesting their involvement in SLE's pro-inflammatory processes (Matta, 2017). IRF1 is involved in pro-inflammatory transcription, characteristic of SLE pathology (Matta, 2017), while IRF2 responds to persistent IFN signaling, leading to CD8+ T cell exhaustion (Lukhele, 2022). IRF3 activation is associated with increased type I interferon expression in dendritic cells (Santana-de Anda, 2014), and IRF4 overexpression is linked to CD8+ T cell exhaustion (Man, 2017). The presence of T1ISRE hints at increased type 1 interferon gene expression. E2F1′s role in T cell apoptosis and its association with T cell cycle progression (Cao, 2004), alongside E2F7 and E2F3′s links to CD8+ T cell infiltration, further reveal SLE's complex cellular mechanisms (Wang, 2018). ISRE motifs in cytokine genes contribute to heightened type 1 interferon production, reflecting altered mitochondrial state of CD8+ T cells in SLE patients (Buang, 2021).
3.4 Construction and investigation of STRING protein–protein interaction network for the identification of hub genes
The primary PPI network, after discarding the disconnected nodes, constructed by the StringApp had 249 nodes (215 upregulated genes, 26 downregulated genes, and 8 linker genes) and 1478 edges (Fig. 4). Topological analysis revealed a clustering coefficient of 0.531, network diameter of 12, network density of 0.048, characteristic path length of 4.302, and an average of 11.871 neighbors per node. The nodes were further subjected to functional enrichment analysis by utilizing the STRING plugin available within the StringApp. This analysis enriched pathway terms related to cell cycle checkpoints, interferon alpha/beta signaling, cytokine signaling, IL-24 signaling and type II interferon signaling (Supplementary II-6). While GO analysis linked the PPI network genes to processes associated with cell cycle and immune system, such as apoptosis, chromosome segregation, DNA damage response, cytokine-mediated signaling pathway, and interleukin 27 signaling (Supplementary II-6).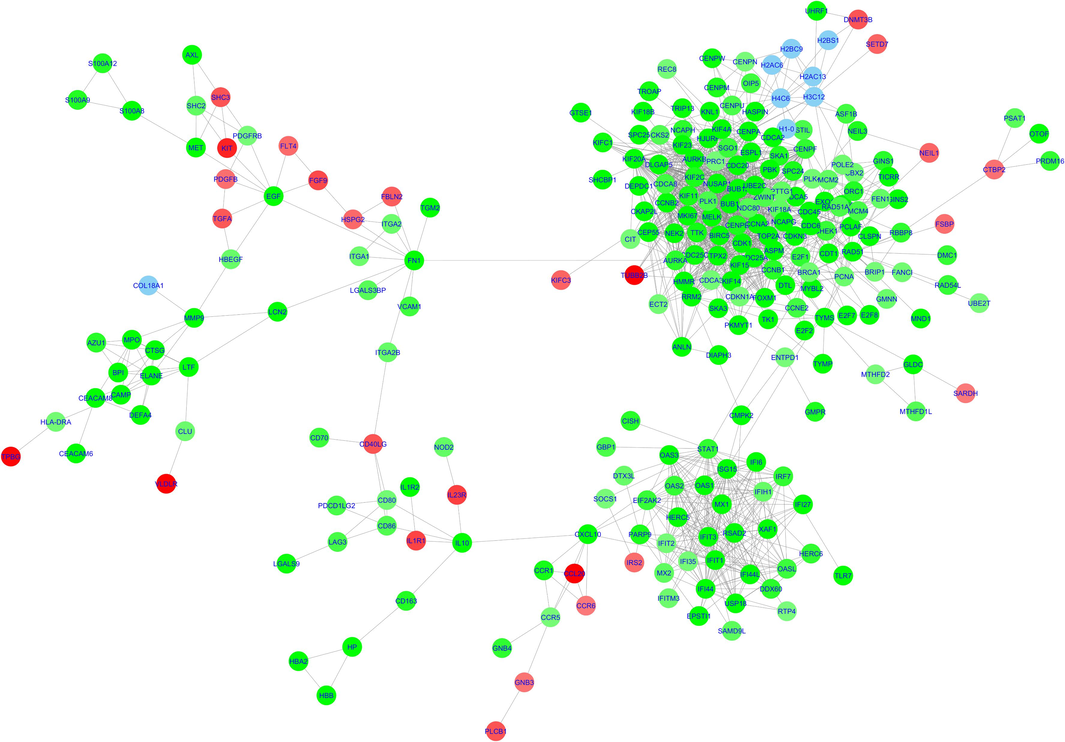
Protein-Protein interaction network built using stringApp The circles are designated for the genes (nodes) while the lines represent the edges. The downregulated genes are represented using the red nodes while the upregulated genes are represented using the green nodes. Linker genes have been represented using blue nodes. (For interpretation of the references to colour in this figure legend, the reader is referred to the web version of this article.)
To identify central or 'hub' genes in the PPI network, we applied four topological analysis methods- MCC, DMNC, MNC, and Degree − along with two measures of centrality, Closeness and Betweenness (Premanand and Reena Rajkumari, 2023). The top 20 hub nodes (genes) identified for each category in the PPI network are listed in Table 1. Genes appearing in at least three of the categories are considered significant and they are CDK1, KIF11, BUB1, KIF20A, TOP2A, KIF2C, BUB1B, CCNB1, DLGAP5, CDC20, CDCA8, UBE2C, TPX2, CENPF, CCNA2, NUSAP1, CCNB2 and BIRC5. The symbol code designates the presence of the highlighted genes in more than two columns— α indicates presence in five columns, β indicates presence in four columns, γ indicates presence in three columns, and δ indicates presence in two columns.
Topological Algorithms
Centralities
MCC
MNC
DMNC
DEGREE
BETWEENNESS
CLOSENESS
CDK1α
CDK1α
PBK
CDK1α
FN1
CDK1α
KIF11β
CCNA2α
NEK2
CCNA2α
AURKAγ
CCNA2α
BUB1β
CCNB1β
AURKAγ
CCNB1β
BRCA1
CCNB1β
KIF20Aβ
CDC20β
MKI67
CDC20β
STAT1
BUB1Bα
TOP2Aβ
BUB1β
PTTG1
BUB1β
CXCL10
CDC20β
KIF2Cβ
BUB1Bα
TTKδ
KIF11β
ISG15
BUB1β
BUB1Bα
KIF11β
CEP55δ
BUB1Bα
PCNA
KIF11β
CCNB1β
KIF20Aβ
CENPE
KIF20Aβ
LCN2
TOP2Aβ
DLGAP5β
TOP2Aβ
NUSAP1β
TOP2Aβ
EGF
KIF20Aβ
CDC20β
DLGAP5β
NCAPG
DLGAP5β
IL10
DLGAP5β
CDCA8α
KIF2Cβ
PRC1
KIF2Cβ
CCNA2α
PLK1γ
UBE2Cβ
CENPFα
CDCA8α
CENPFα
CDK1α
TPX2β
TPX2β
CCNB2β
ASPMδ
CCNB2β
LTF
CCNB2β
CENPFα
TPX2β
MELKδ
TPX2β
CENPA
UBE2Cβ
CCNA2α
CDCA8α
KIF15
PLK1γ
ITGA2B
AURKAγ
CEP55δ
AURKBγ
BIRC5β
CDCA8α
BUB1Bα
KIF2Cβ
MELKδ
PLK1γ
CENPFα
BIRC5β
TYMS
CENPFα
NUSAP1β
BIRC5β
CDCA3
AURKBγ
RAD51
AURKBγ
TTKδ
NUSAP1β
GBP4
NUSAP1β
CD40LG
CDCA8α
CCNB2β
UBE2Cβ
UBE2Cβ
ASPMδ
MMP9
BIRC5β
3.5 Construction and investigation of Reactome functional interaction network for the Identification of hub genes
The primary FI network, after discarding the disconnected nodes, generated using the ReactimeFIViz tool comprised of 361 nodes (278 up-regulated and 83 downregulated genes) and 4081 edges (Fig. 5). Topological analysis of this FI network revealed an average node count of 22.609, a network diameter of 14, a characteristic path length of 3.958, a clustering coefficient of 0.481, and an average network density of 0.0653 neighbors. Pathway enrichment and Gene Ontology biological process analyses were conducted using the inbuilt network function plugin in ReactomeFIViz. This analysis highlighted terms predominantly related to the cell cycle, such as mitotic cell cycle, cell division, chromosome segregation, cell cycle checkpoint, mitotic prometaphase and G1/S transition (Supplementary II-7).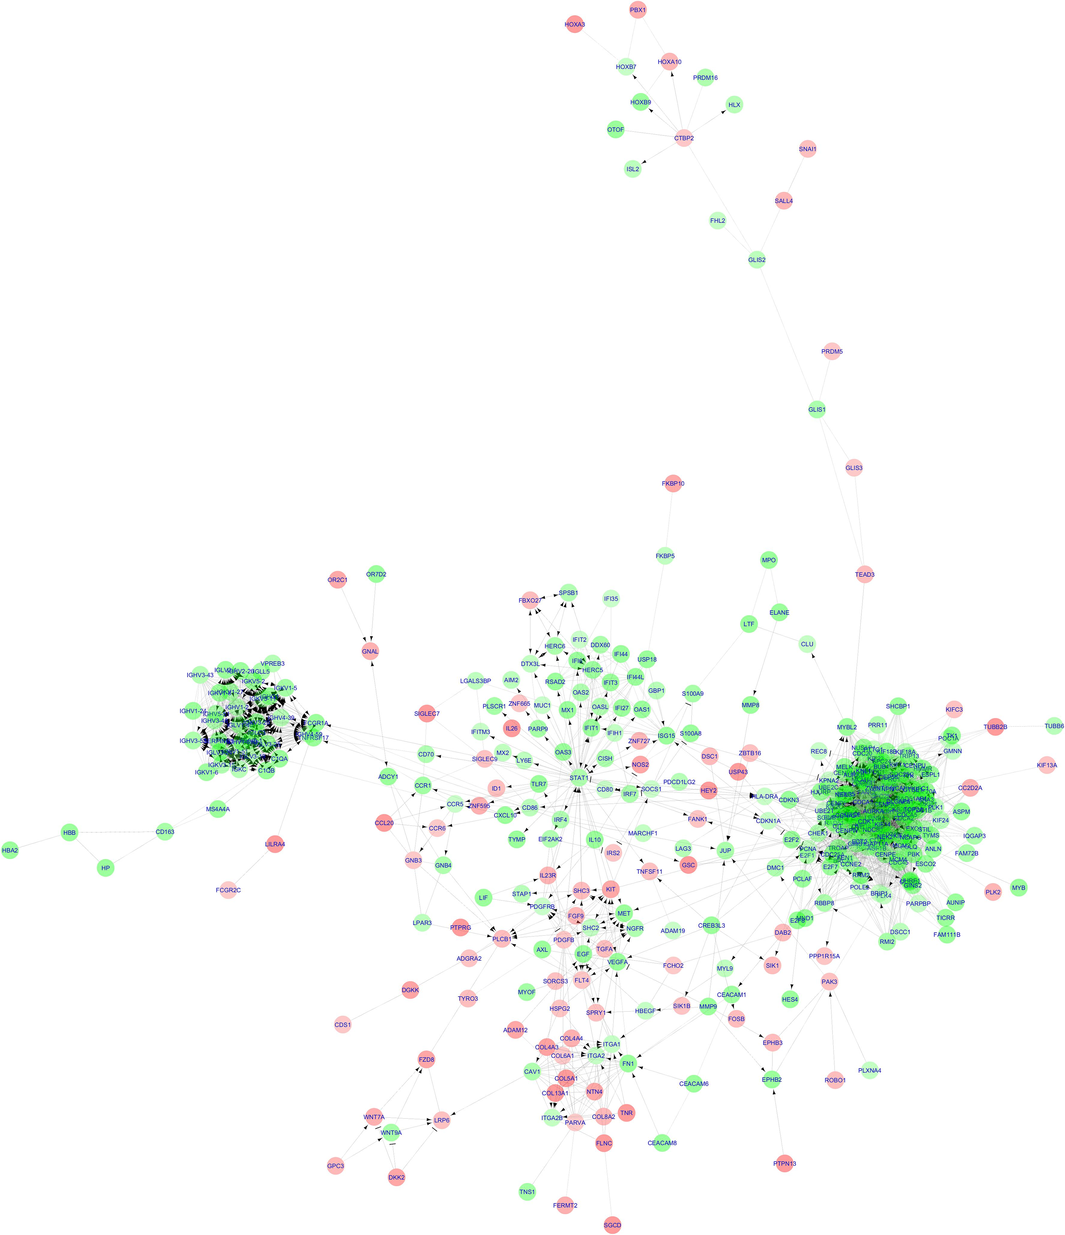
Reactome functional interaction network created using ReactomeFIViz The circles are designated for the genes (nodes) while the lines represent the edges. The downregulated genes are represented using the red nodes while the upregulated genes are represented using the green nodes. (For interpretation of the references to colour in this figure legend, the reader is referred to the web version of this article.)
Similar to the PPI network, the top 20 hub nodes (genes) for each category in the FI network were identified using four topological analysis methods and two centralities. These hub nodes are detailed in Table 2. Genes appearing in at least three of the categories are considered significant and they are CDK1, CCNA2, AURKA, CDCA5, NDC80, CDCA8, CENPE, ZWINT, CCNB2, SPC25, BUB1, BUB1B, PLK1, EXO1, FOXM1, NEK2, TPX2, KIF2C and BIRC5. The symbol code designates the presence of the highlighted genes in more than two columns— α indicates presence in five columns, β indicates presence in four columns, γ indicates presence in three columns, and δ indicates presence in two columns.
Topological Algorithms
Centralities
MCC
MNC
DMNC
DEGREE
BETWEENESS
CLOSENESS
ZWINTγ
CDK1α
SGO1δ
CDK1α
STAT1δ
CDK1α
CDK1α
CCNA2β
SPC24
CCNA2β
BRCA1δ
CCNA2β
CCNB2γ
PLK1γ
KNL1
PLK1γ
FCGR1A
PLK1γ
SKA1
CDCA8β
CDCA3
CDCA8β
BIRC5γ
AURKAβ
SPC25γ
EXO1γ
CENPN
EXO1γ
TEAD3
EXO1γ
NDC80β
CCNB2γ
IGHV2-26
AURKAβ
GLIS1
FOXM1γ
SKA3δ
AURKAβ
IGHV1-24
CCNB2γ
HLA-DRA
NEK2γ
CCNA2β
FOXM1γ
IGHV1-69D
FOXM1γ
GLIS2
STAT1δ
AURKAβ
NEK2γ
IGHV3-43
NEK2γ
KIT
CDCA8β
BUB1γ
NDC80β
IGHV5-51
NDC80β
E2F1
CENPEβ
BUB1Bγ
ZWINTγ
IGHV6-1
ZWINTγ
CHEK1
NDC80β
CDCA5β
CDCA5β
OIP5
CDCA5β
PLCB1
BRCA1δ
CCNB1δ
CENPEβ
IGKV1-27
CENPEβ
CDK1α
CDCA5β
CDC20δ
BUB1Bγ
IGKV1-8
BUB1Bγ
CTBP2
KIF11
SGO1δ
SPC25γ
IGKV1-6
SPC25γ
CDKN1A
KIF2Cγ
AURKB
TPX2γ
CENPM
TPX2γ
CCR5
CENPF
CDC25C
KIF2Cγ
CKS2
KIF2Cγ
MET
CCNB1
CENPEβ
BUB1γ
PTTG1
BUB1γ
VEGFA
TPX2γ
CDCA8β
CENPAδ
SKA3δ
CENPAδ
EGF
CDC20δ
3.6 Prospective genetic markers of SLE pathology
A total of 29 hub genes were identified from the analysis of PPI and FI networks, (Supplementary II-8). All these hub genes were found to be up-regulated. Among these, 10 genes − CDK1, TPX2, BIRC5, CCNA2, BUB1, BUB1B, AURKA, KIF2C, PLK1 and CDCA8 were found to be hub genes in both networks and are thus considered to be prospective genetic markers of SLE pathology. GO biological process and pathway enrichment analyses implicated these genes in several cell-cycle related processes (Supplementary II-9).
CDK1, a serine-threonine kinase and part of the M phase-promoting factor, plays a pivotal role in the cell cycle, particularly at the G1-S and G2-M checkpoints. It is instrumental in the IFN type I induced phosphorylation of STAT-1 and elevating ISG expression, a process central to SLE prognosis and inflammation (Wu, 2016). Inhibition of CDK1 has been linked to reduced expression of pro-inflammatory genes (Mehl, 2022). TPX2, a key protein in mitotic spindle development and function, is associated with increased expression of pro-inflammatory cytokines. Studies in CRS-affected mice suggest that silencing TPX2 diminishes inflammation, indicated by changes in GSK3β, IL-10, TNF-α, IL-6, and IL-8 levels (Gu et al., 2020). BIRC5 which encodes the protein survivin, significant for immune system maintenance, shows enrichment in leukocytes accumulated in inflamed tissues, a common feature in autoimmune disorders. It particularly affects the activity threshold of cytotoxic T lymphocytes against other survivin-expressing cells (Pahlavan, 2019). In rheumatoid arthritis, BUB1 is associated with abnormal cell proliferation, migration, invasion, PI3K/Akt pathway disruption, and pro-inflammatory cytokine release (He, 2023). AURKA, found in psoriasis patients, promotes inflammation by impeding autophagy-mediated AIM2 inflammasome suppression and activating the Akt/mTOR pathway. It has also been linked to increased TNF- α expression in gastric mucosa of mice with gastrointestinal cancer (Tang, 2021). KIF2C, coding for Mitotic centromere-associated kinesin, influences cell motility and migration by affecting the actin-MT cytoskeleton and FA turnover (Moon, 2021). BUB1B, linked to exhausted T-cell signature and inflammatory CD8+ cells, has been shown to reduce invasion and proliferation in RCC cell lines upon knockdown (Sekino, 2021). PLK1, increases the activity of the NLRP3 inflammasome, a critical component in SLE pathophysiology. It affects the microtubule-organizing centre architecture and activation of NLRP3 causes cell damage and death in lupus nephritis (Baldrighi, 2023). CDCA8, essential for mitosis and chromosome segregation, has shown a significant correlation with tumor purity and immune cell infiltration levels in a study (Wan, 2022). CDCA5, AURKB, CCNB1, and FOXM1, enriched in the transcriptomes of SLE patients, correlate with autoantibody titers (Mikhail, 2022). NDC80 and its constituent SPC25, were linked to increased levels of pro-inflammatory cytokines and chemokines in RA and are involved in regulating cell proliferation through the PK/AKT/Notch1 signaling pathway (Luo, 2023). CENPE, an autoantigen in systemic sclerosis, has been found to trigger the formation of specific autoantibodies (Rattner, 1996). ZWINT, significant for kinetochore and mitotic checkpoint function, is implicated in enhanced CD8+ T cell infiltration (wang, s., et al., ZWINT is a cancer prognosis and immune infiltration-related biomarker from pan-cancer analysis., et al., 2023). NEK2 overexpression affects IL-22 mediated inflammation and cytokine production in psoriasis patients (Peng, 2023). KIF20A and DLGAP5, correlated with elevated pro-inflammatory cytokines in RA, along with CDC20, a hub gene in the disease, are integral to inflammatory processes (Luo, 2023). CCNB2, positively correlated with various immune cells, plays a role in immune infiltration (Zou, 2020). NUSAP1, causing aberrant mitosis, is positively correlated with inflammatory gene expression (Mo, 2023). UBE2C is associated with regulating the expression of several immunological checkpoints including chemokines (Yu, 2022). CENPF expression is closely tied with CD8+ T cell immunological infiltration (Li, 2022). Exo1, KIF11, and TOP2A, enriched in SLE and other autoimmune conditions, are critical in the disease's pathology (Sun, 2015).
Since most of the hub genes were associated with cell-cycle functions, a single-sample Gene Set Enrichment Analysis (ssGSEA) of 16 gene sets related to cell-cycle processes and diseases (Supplementary II-10) obtained from the GSEA-MSigDB webserver was conducted on the samples using the GSVA v1.52.3 and GSEABase v1.66.0 Bioconductor packages. The ssGSEA heatmap (Fig. 6) revealed that these 16 gene sets are up-regulated in SLE-active patients compared to healthy controls. This upregulation of cell-cycle-related gene sets suggests that the hub genes involved in cell-cycle functions likely play a significant role in SLE pathology. Therefore, these hub genes are proposed as potential biomarkers and therapeutic targets for further investigation in SLE.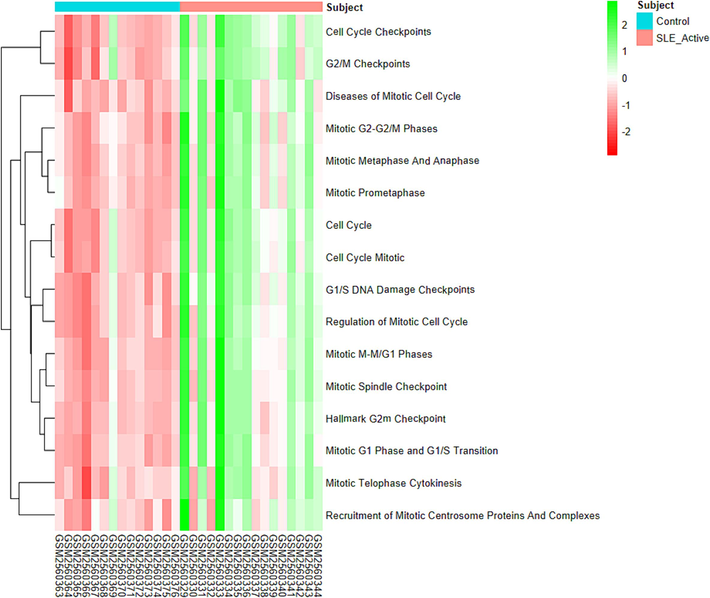
Single sample gene set enrichment analysis (ssgsea) of cell cycle related gene sets on the samples.
4 Discussion
Our study identified 931 genes with differential expression between control and diseased samples, including 577 upregulated and 354 downregulated genes (Supplementary I). To elucidate the biological significance of these DEGs, we utilized the ToppGene Suite server. The analysis revealed that the upregulated genes predominantly belong to immune-related gene families, such as immunoglobulins, C-type lectin domain family, and kinesins, among others (Supplementary II-1). These genes are crucial in various immune responses, including toll-like receptor binding and cytokine production, as indicated by Gene Ontology (GO) enrichment analysis (Fig. 2). Pathway enrichment analysis further underscored their involvement in pathways such as FCGR3A-mediated IL-10 synthesis, B cell receptor activation, and several cell cycle-related pathways (Supplementary II-3). Conversely, the downregulated genes are associated with gene families including keratins, type II collagens, fibronectin type III domain-containing proteins, receptor tyrosine kinases, FERM domain-containing proteins, low-density lipoprotein receptors, and fibulins (Supplementary II-1). These downregulated genes are linked to signaling pathways such as G protein-coupled receptors and Wnt signaling (Fig. 4). Pathways related to the matrisome, basement membrane, and collagen were particularly enriched for the downregulated genes in pathway enrichment analysis (Supplementary II-3).
Our investigation also identified several motifs in the promoter regions of both downregulated and upregulated genes. Downregulated genes exhibited motifs for transcription factors involved in T- cell activation (MyoG), T-cell differentiation (LRF, GATA1), regulation of T-cell development (ASCL1), transcriptional activation, TNF signalling and maturation of immune cells (EGR1), B and T-cell development (E2A) and cell cytotoxicity (NFAT). Notably, GATA1 is linked to transcriptional regulation of dendritic cell development and lineage separation of dendritic cells and macrophages (Gutiérrez, 2007). In contrast, upregulated genes had motifs for IRF1, IRF3, and IRF4 (immune regulatory transcription factors), as well as T1ISRE and ISRE. These motifs are associated with increased type 1 interferon production and expression. The binding of IRFs to ISRE motifs in the promoter regions of cytokine genes results in heightened type 1 interferon production and continuous exposure to IFNα in SLE patients. This may lead to alterations in mitochondrial metabolism of CD8+ T cells, contributing to their apoptosis (Buang, 2021).
The analyses of two biological networks namely the String PPI and Reactome FI networks, identified 29 important genes. Among these, 10 genes—CDK1, TPX2, BIRC5, CCNA2, BUB1, BUB1B, AURKA, KIF2C, PLK1, and CDCA8—were found to be enriched in both networks. These common hub genes play significant roles in the abnormalities observed in CD8+ T cells in SLE.
CDK1 facilitates the phosphorylation of STAT-1, upregulates ISG expression and enhances type 1 IFN signalling, which has been linked to accelerated disease activity in SLE patients (Wu, 2016). TPX2 was associated with increased production of pro-inflammatory cytokines and could thus be contributing to the exaggerated inflammation seen in SLE patients (Gu et al., 2020). BIRC5 was associated with CD8+ T cell production, innate and adaptive immune responses and increased accumulation of defective CD8+ T cells in tissues. Moreover, cytotoxic T lymphocytes expressing this gene were found to have a lowered activity threshold against survivin expressing cells, implying that these cytotoxic T cells became increasingly active and attacked healthy cells expressing survivin, leading to autoimmune-like conditions (Pahlavan, 2019).
Pathways such as E2F targets, interferon alpha response, G2M checkpoint, IL6-JAK-STAT signalling, interferon gamma response, and inflammatory response were all regulated by CCNA2, which also increases CD8+ T cell invasiveness (Jiang, 2022). BUB1 facilitates cytokine release, regulates the PI3K/Akt signaling pathway associated with autoimmune development, and enhances tissue infiltration (He, 2023). AURKA promotes inflammation, activates the Akt/mTOR and is associated with increased TNF-α expression which may have an impact on inflammation, CD8+ T cell apoptosis, and the production of autoantigens (Tang, 2021). KIF2C enrichment suggests a potential dysregulation of motility and migratory functions of the CD8+ T cells (Moon, 2021). BUB1B is linked to exhausted T cell signature, inflammatory CD8+ and IFN-gamma signature, cell proliferation and invasion (Sekino, 2021). The activation of the NLRP3 inflammasome is crucial in autoimmune development by triggering the production of pro-inflammatory cytokines and inducing pyroptosis through GSMD. PLK1 enriched in our study is a major player in NLRP3 inflammasome activation suggesting a central role of this gene in SLE pathogenesis (Baldrighi, 2023). Finally, CDCA8 may be involved in determining the immunological environment linked to SLE pathology because of the positive correlation found between CDCA8 expression and immune cell infiltration in SLE, including B cells, CD8+ T cells, CD4+ T cells, and macrophages (Wan, 2022).
Our study aligns with the previously established role of CD8+ T cell in the clinical manifestation of SLE which indicated that these cells exhibit improper cytotoxic activity, increased infiltration in the sites of tissue damage and increased cytokine production (Chen and Tsokos, 2021). Although this aspect of the disease had been previously explored, the specific genes responsible for these abnormalities were not well understood. In this study, we utilised computational methods to investigate the genes underlying these aberrations by analysing the RNA transcriptome from SLE patients. We identified genes such as CDK1, TPX2, BIRC5, CCNA2, BUB1, BUB1B, AURKA, KIF2C, PLK1 and CDCA8 as biomarkers of dysfunctional CD8+ T cells in SLE patients. These genes may serve as potential therapeutic targets and warrant further investigation to elucidate their roles more comprehensively.
5 Conclusion
SLE represents a highly complex multigenic disorder characterized by its multifaceted nature and the diverse array of factors influencing its symptomatology. Despite extensive research, the precise mechanisms underlying its pathophysiology remain elusive. Our study leveraged bioinformatics tools to pinpoint genes potentially instrumental in the aberrant functioning of CD8+ T cells in SLE patients. We identified ten key genes − CDK1, TPX2, BIRC5, CCNA2, BUB1, BUB1B, AURKA, KIF2C, and PLK1, along with CDCA8 − as critical in this context. Although these genes are primarily recognized for their roles in cell cycle regulation, our analysis suggests they may also have a broader impact. Their dysregulation could influence immune responses, potentially contributing to the autoimmune-like conditions observed in SLE and similar disorders. Importantly, some of these genes have been implicated in other autoimmune diseases, indicating their potential as biomarkers for SLE. However, to fully understand their relevance and mechanism in SLE pathology, further targeted studies are necessary. This research represents a significant step toward unraveling the genetic underpinnings of SLE, and could guide future diagnostic and therapeutic strategies.
Compliance with ethical standards.
Conflict of interest: The authors confirm that there are no conflicts of interest associated with this publication.
Ethical approval: This article does not include any research involving human or animal subjects conducted by the authors.
Informed consent: The study does not gather original data, it does not fall under the purview of ethical approval, and formal consent is not necessary.
CRediT authorship contribution statement
Premanand Adaikalasamy: Writing – review & editing, Visualization, Methodology, Conceptualization. Shruti Kumari: Writing – original draft, Investigation, Formal analysis, Data curation. Sona Elizabeth Jacob: Writing – original draft, Investigation, Formal analysis, Data curation. Sudhriti Bhuiyan: Writing – original draft, Investigation, Formal analysis, Data curation. Reena Rajkumari Baskaran: Writing – review & editing, Supervision, Resources, Conceptualization. Shobana Sampath: Writing – review & editing, Validation. Sandhanasamy Devanesan: Writing – review & editing, Validation.
Acknowledgement
The authors express their gratitude to the Vellore Institute of Technology, Vellore, India, for the provision of computational resources utilized in this study. The authors express their sincere appreciation to the Researchers Supporting Project Number (RSP2024R398) King Saud University, Riyadh, Saudi Arabia.
Declaration of competing interest
The authors declare that they have no known competing financial interests or personal relationships that could have appeared to influence the work reported in this paper.
References
- PLK1 inhibition dampens NLRP3 inflammasome-elicited response in inflammatory disease models. J Clin Invest. 2023;133(21)
- [Google Scholar]
- Type I interferons affect the metabolic fitness of CD8(+) T cells from patients with systemic lupus erythematosus. Nat Commun. 2021;12(1):1980.
- [Google Scholar]
- The E2F–1 transcription factor promotes caspase-8 and bid expression, and enhances Fas signaling in T cells. J Immunol. 2004;173(2):1111-1117.
- [Google Scholar]
- The transcription factors Thpok and LRF are necessary and partly redundant for T helper cell differentiation. Immunity. 2012;37(4):622-633.
- [Google Scholar]
- The role of CD8+ T-cell systemic lupus erythematosus pathogenesis: an update. Curr Opin Rheumatol. 2021;33(6):586-591.
- [Google Scholar]
- Manifestations of systemic lupus erythematosus. Maedica (bucur). 2011;6(4):330-336.
- [Google Scholar]
- Pathogenic inflammation and Its therapeutic targeting in systemic lupus erythematosus. Front Immunol. 2015;6:550.
- [Google Scholar]
- Up-regulation of microRNA-335-5p reduces inflammation via negative regulation of the TPX2-mediated AKT/GSK3β signaling pathway in a chronic rhinosinusitis mouse model. Cell Signal. 2020;70:109596
- [Google Scholar]
- Gata1 regulates dendritic-cell development and survival. Blood. 2007;110(6):1933-1941.
- [Google Scholar]
- Knockdown of BUB1 inhibits tumor necrosis factor-α-induced proliferation and migration of rheumatoid arthritis synovial fibroblasts by regulating PI3K/Akt pathway. Int J Rheum Dis. 2023;26(10):2024-2030.
- [Google Scholar]
- CCNA2 as an Immunological biomarker encompassing tumor microenvironment and therapeutic response in multiple cancer types. Oxid Med Cell Longev. 2022;2022:5910575.
- [Google Scholar]
- Identification of Achaete-scute complex-like 1 (ASCL1) target genes and evaluation of DKK1 and TPH1 expression in pancreatic endocrine tumours. BMC Cancer. 2009;9:321.
- [Google Scholar]
- CENPF as an independent prognostic and metastasis biomarker corresponding to CD4+ memory T cells in cutaneous melanoma. Cancer Sci. 2022;113(4):1220-1234.
- [Google Scholar]
- The transcription factor IRF2 drives interferon-mediated CD8(+) T cell exhaustion to restrict anti-tumor immunity. Immunity. 2022;55(12):2369-2385.e10.
- [Google Scholar]
- Integrated bioinformatics analysis and experimental validation reveals hub genes of rheumatoid arthritis. Exp Ther Med. 2023;26(4):480.
- [Google Scholar]
- Entrez Gene: gene-centered information at NCBI. Nucleic Acids Res. 2007;35(Database issue):D26-D31.
- [Google Scholar]
- Transcription Factor IRF4 Promotes CD8(+) T Cell exhaustion and limits the development of Memory-like T Cells during chronic infection. Immunity. 2017;47(6):1129-1141.e5.
- [Google Scholar]
- Interferon regulatory factor signaling in autoimmune disease. Cytokine. 2017;98:15-26.
- [Google Scholar]
- Blockage of lamin-A/C loss diminishes the pro-inflammatory macrophage response. iScience. 2022;25(12):105528
- [Google Scholar]
- 2104 Lupus autoantibodies associated with cell cycle gene expression in peripheral blood of SLE patients. Lupus Science & Medicine. 2022;9(Suppl 3):A110.
- [Google Scholar]
- A recurrent de novo variant in NUSAP1 escapes nonsense-mediated decay and leads to microcephaly, epilepsy, and developmental delay. Clin Genet. 2023;104(1):73-80.
- [Google Scholar]
- Mitotic Centromere-Associated Kinesin (MCAK/KIF2C) regulates cell migration and invasion by modulating microtubule dynamics and focal adhesion turnover. Cancers (basel). 2021;13(22)
- [Google Scholar]
- Survivin modulatory role in autoimmune and autoinflammatory diseases. J Cell Physiol. 2019;234(11):19440-19450.
- [Google Scholar]
- NEK2 overexpression aggravates IL-22-induced keratinocyte proliferation and cytokine level increases and IMQ-induced psoriasis-like dermatitis. Biochim Biophys Acta Mol Cell Res. 2023;1870(8):119525
- [Google Scholar]
- Bioinformatic analysis of gene expression data reveals Src family protein tyrosine kinases as key players in androgenetic alopecia. Front Med (lausanne). 2023;10:1108358.
- [Google Scholar]
- The centromere kinesin-like protein, CENP-E. An autoantigen in systemic sclerosis. Arthritis Rheum. 1996;39(8):1355-1361.
- [Google Scholar]
- The Role of immunometabolism in the pathogenesis of systemic lupus erythematosus. Front Immunol. 2021;12:806560
- [Google Scholar]
- Interferon regulatory factor 3 as key element of the interferon signature in plasmacytoid dendritic cells from systemic lupus erythematosus patients: novel genetic associations in the Mexican mestizo population. Clin Exp Immunol. 2014;178(3):428-437.
- [Google Scholar]
- BUB1B overexpression is an independent prognostic marker and associated with CD44, p53, and PD-L1 in renal cell carcinoma. Oncology. 2021;99(4):240-250.
- [Google Scholar]
- Identification of genes associated with osteoarthritis by microarray analysis. Mol Med Rep. 2015;12(4):5211-5216.
- [Google Scholar]
- Transcription factor GATA-1 potently represses the expression of the HIV-1 coreceptor CCR5 in human T cells and dendritic cells. Blood. 2005;106(10):3440-3448.
- [Google Scholar]
- AURKA facilitates the psoriasis-related inflammation by impeding autophagy-mediated AIM2 inflammasome suppression. Immunol Lett. 2021;240:98-105.
- [Google Scholar]
- Overexpression of CDCA8 Predicts Poor Prognosis and promotes tumor cell growth in prostate cancer. Front Oncol. 2022;12:784183
- [Google Scholar]
- Analysis of the correlation between E2F3 expression and the number of tumor-infiltrating CD8(+)T cells in invasive bladder cancer tissues. Xi Bao Yu Fen Zi Mian Yi Xue Za Zhi. 2018;34(1):1-8.
- [Google Scholar]
- wang, s., et al., ZWINT is a cancer prognosis and immune infiltration-related biomarker from pan-cancer analysis. 2023, Research Square.
- Examining the role of EGR1 during viral infections. Front Microbiol. 2022;13:1020220.
- [Google Scholar]
- Identification of Cyclin-Dependent Kinase 1 as a Novel Regulator of Type I Interferon signaling in systemic lupus erythematosus. Arthritis Rheumatol. 2016;68(5):1222-1232.
- [Google Scholar]
- Integrative bioinformatics analysis reveals CHEK1 and UBE2C as luminal a breast cancer subtype biomarkers. Front Genet. 2022;13:944259
- [Google Scholar]
- CDK1, CCNB1, and CCNB2 are Prognostic Biomarkers and correlated with immune infiltration in hepatocellular carcinoma. Med Sci Monit. 2020;26:e925289.
- [Google Scholar]
Appendix A
Supplementary data
Supplementary data to this article can be found online at https://doi.org/10.1016/j.jksus.2024.103417.
Appendix A
Supplementary data
The following are the Supplementary data to this article:


