

Translate this page into:
Evaluation of corrosive behaviour and scaling potential of shallow water aquifer using corrosion indices and geospatial approaches in regions of the Yamuna river basin
⁎Corresponding authors. salmanahmed.rs@amu.ac.in (Salman Ahmed), maalam@ksu.edu.sa (Manawwer Alam)
-
Received: ,
Accepted: ,
This article was originally published by Elsevier and was migrated to Scientific Scholar after the change of Publisher.
Peer review under responsibility of King Saud University.
Abstract
The research was conducted in the district of Mathura, Uttar Pradesh, India, and samples were obtained and analysed from 65 locations in different parts of the Mathura region in June 2016. Using the obtained water quality parameters of the study area, different types of indices including Ryznar index (RI), Langelier saturation index (LSI), Aggressive index (AI), Larson–Skold index (LS), Puckorius index (PI) and chloride sulfate mass ratio (CSMR) has been assessed and compared. The spatial distribution maps were prepared using the Inverse Distance Weight method and reveal that more than 75% of the total samples lie in the category of LI < 0, while 23% of samples indicate the water to be supersaturated with scaling forming tendency. However, 83% of the total samples point towards moderate corrosive behavior and the Ryznar index of these samples lies between limit of 6.8–8.5. The Ryznar index value of 11% of the total samples is found to be more than 8.5 thus indicating a rigorous corrosive tendency towards the water. The Puckorius index value of less than 6 has been assessed in 20% of the total samples thus conforming to the tendency of water towards scaling. The Puckorius index value between 6 and 7 has been observed in 46% of the total samples analyzed in the present study, thus indicating the water to be little corrosive in nature. The chloride sulfate mass ratio value is found to be greater than 0.5, which is observed in more than 90% of the samples of the study area, thus conforming to the corrosiveness of water towards the distribution system. Most of the indexes show that the corrosion trends in water samples are very high, so that domestic and industrial water quality and distribution systems may have more deteriorated in the future.
Keywords
Langelier saturation index
Larson–Skold index
Mathura
Chloride sulphate mass ratio
Corrosion

1 Introduction
The accessibility of groundwater is an irreplaceable component for drinking horticulture, industrial and irrigation systems (Nagaraju et al., 2014). Due to the increase in anthropogenic activities by humans the groundwater is polluted to its maximum. In order to mitigate the situation, there is a need to continuously monitor the water quality parameters and to identify the sources of contamination (Akoto and Abankwa, 2014). The quality of water also changes due to undesirable physical, synthetic and biochemical responses that aggregate after some time (Edwards, 2004). The main elements which affect corrosion are the flow of water and temperature, under low flow and high-temperature corrosion increases. One such potential prognostic influence, which was predominantly seen in the domestic and industrial disciplines is the corrosion or scaling impacts commonly generated in water supplies and production lines (Egbueri and Mgbenu, 2020; Tyagi and Sarma, 2020).
Low pH and moderate dimensions of dissolved oxygen, low bicarbonate levels contribute altogether to the destructive propensity of water. Although it has been known that change of pH alone frequently lacks in water with low alkalinity on the grounds and the deposited calcium carbonate provides very little protection from the decrease in pH values. The connection of low bicarbonate levels to the chloride and sulphate levels likewise impacts the destructive inclination of water. Options in contrast to supplementation with alkalinity incorporate lime, carbon dioxide, soda ash and sodium bicarbonate which provides a defensive layer by introducing sufficient buffering and then diminishing corrosiveness.
The aggressiveness of water towards metal corrosion can be calculated by determining the physicochemical parameters of the samples including the corrosive index, different types of indices include Ryznar index (RI), Langelier saturation index (LSI), Aggressive index (AI), Larson–Skold index (LS), Puckorius index (PI) and chloride sulphate mass ratio (CSMR) (Davil et al., 2009; Nguyen et al., 2011). Sajil Kumar (2019) stated that the Ryznar and Langelier indices were intended to demonstrate severe damage to the machineries in the industries. Rabbani et al. (2009) investigated the agrarian water assets and the majority of the samples were found to be very much corrosive thus escalating the potential to frame scales of Ryznar, Langelier and Puckorius indices. Kurdi et al. (2015) investigated on the affectability of erosion and reported the scaling records dependent on particles. An assessment of the corrosive activity of groundwater can be obtained from corrosion and scaling records. In any case use of experimental techniques in terms of electrochemical estimations is needed to evaluate the aggressiveness of water (Kalyani et al., 2017). Considering the above-mentioned facts in view a study was being planned with the objectives to investigate the destructive potential of river water and surface water that can cause health issues and economic loss to the society.
2 Study area
The present study has been carried out in the Mathura district situated on the bank of river Yamuna Uttar Pradesh, India (Fig. 1). It lies between latitudes 27° 14′ and 27° 17′ North and longitudes 77° 17′ and 78° 12′ East and covers an area of about 3303.28 km2(Khan, 2017). The climate of the area is characterized by cold winter (December to February) an intensive hot summer (March–June) followed by the monsoon season (July–September) and thereafter brief autumn (October and November). During the pre-monsoon period of the year 2016, the water level below the ground has been reported to be 3.5 m to 15.55 mbgl (meter below ground level) as shown in Fig. 2.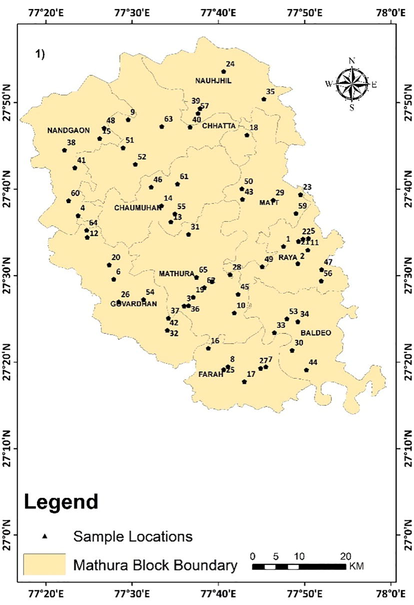
Study area sampling location map of the Mathura District.
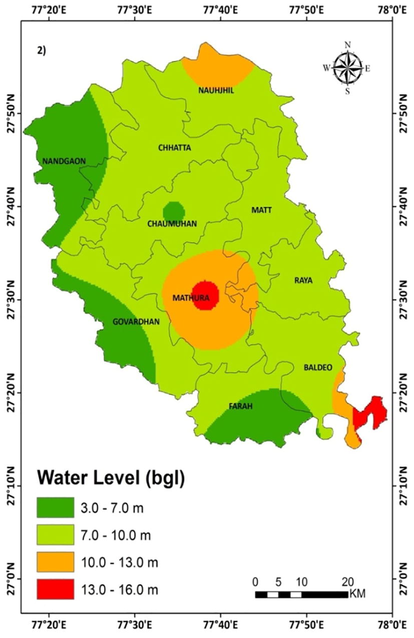
Water level map of the study area during the premonsoon season 2016.
During the months of July and August, the relative moisture of the district ranges maximum up to 80–90% due to monsoon precipitation. During the month of January to March, the lowest relative humidity ranges from 20% to 40%. The shallow aquifer group is 50 m below the ground level (mbgl), whereas there is a deeper aquifer group ranging from 135 to 185 mbgl. The aquifers are usually lenticular and clustered. Typically, the aquifer material consists of medium to low grain sand. Kankars are typically connected with sand and clay in the old Alluvium plain. According to the research of the Central Ground Water Board, India, the total number of wells and wells in the region in 2012 is 61456.
3 Sampling and analysis
The samples in the present study have been collected from 65 locations in different parts of the Mathura city from the hand pumps bore holed by Jal Nigam including Yamuna river flowing through the stretch in the month of June 2016. Geographic coordinates of the sampling points were recorded using a GARMIN GPSMAP 60Cx. The water from the hand pump assembly is pulled back at first for the expulsion of the dormant water from the aquifer. After the evacuation of the dormant water, the samples were gathered in a pre-cleaned (1N-HCl) 1 L polyethylene bottle. Temperature, pH and Electrical conductivity of the collected samples were being determined at the field by thermometer (Generic Digital Thermometer Temperature Test Pen TP101), portable EC (HANNA HI96304) and pH meter (HANNA HI98107) respectively. In keeping with the traditional methodologies recommended in the American Waterworks Association and American Public Health (APHA, 2005), however, variables such as significant positive metal ions (Mg2+, K+, Na+, Ca2+) and major anions (HCO3−, SO42−, CO32−, NO3−, Cl−, F−), TDS, hardness, calcium, carbonates and bicarbonate have been evaluated in the Geochemistry Laboratory, Department of Geology, Aligarh Muslim University Aligarh. The flare photometer (EIL, PAT-NO-712700 REG, DES.-NO-866150) has been used to determine the sodium (Na+) and potassium (K+). Spectrophotometric procedure (SHIMADZU CORP. 07410, SERIAL no. A114549) evaluated the fluoride, sulfate, and nitrate. The observations were checked using the ion balance error test with the reliability of ±10% and results were compared with the World Health Organization reports. On the basis of obtained results, the indices including Langelier Saturation Index (LI), Ryznar Stability Index (RI), Puckorius Index (PI), Larson-Skold Index (LS) and Aggressive Index (AI) has been determined in the present study. Chloride Sulphate mass ratio has also been calculated to identify the behavior of the water for corrosion in water samples. The ArcGIS 10.3 software has been used to prepare maps by using the Inverse Distance Weighted interpolation method that helps to determines cell values using a linearly weighted combination with a set of sample points.
3.1 Corrosivity indices
The corrosivity scale is classified on the basis of water quality parameters and it can be interpreted by Puckorius Index (PI), Langelier Index (LI), Ryznar Index (RI), Aggressive Index (AI), and Larson – Skold Index (LS). The Ryznar index (RI; Ryznar, 1944) is a mechanism that is utilized to foresee the probability of calcium carbonate scale to form in a given specimen of water. The Langelier Index (LI; Langelier, 1946) is one tool being used by water operators for stabilizing water to control both internal corrosion and the deposition of scale. Water supply operators can optimize their water supply systems and identify leakage potentials with the Langelier Index. Langelier index (LI) depends on the dissolvability attributes of compounds including calcium carbonate. The aggressive index is developed by a relation of pH, calcium and total alkalinity.
Count of RI utilizes LI as a segment in predicting the scaling or corrosion susceptibility of water. In the Puckorius index (PI), the measured pH utilizes in LI and RI as a substitute by the balance of pH as pHeq. Larson Skold index includes groupings of chlorides, sulfates, carbonates and bicarbonates in its numerical equation. The scientific equations used to compute different indices are summarized in Supplementary Table S1 (Yousefi et al., 2016).
4 Results and discussion
In the present study to develop corrosion indices analysis of all 65 samples for various water quality parameters are carried out, parameters including pH, Temperature, Total Dissolved Solids (TDS), Ca2+, HCO3−, SO42−, CO32−, Cl− and Alkalinity and summarized in Supplementary Table S2. The pH value of samples lies between 6.5 and 8.6 with an average of 7.3 whereas the lowest and highest value of pH was observed in the Usfar village and Yamuna River samples respectively. The temperature of the ground and surface water sample ranges from 28.7 °C to 38.1 °C with a mean of 29.24 °C, the highest water temperature of 38.1 °C observed in the Yamuna river sample.
The Total Dissolved Solids of groundwater samples of the present study ranges from 848 to 17,172 mg/l with a mean concentration of 4963 mg/l. The highest TDS value has been observed in the Neemgaon station sample. The calcium concentration in all the samples lies in the range of 4.8–881 mg/l with a mean concentration of 82.5 mg/l. However, the highest calcium concentration has been observed in Neemgaon samples.
In the study area, HCO3−concentration ranges from 39 to 1027 mg/l with a mean concentration of 465.5 mg/l and the highest found in the Trauli Janhvi sample. Sulphate concentration ranges from 5.1 to 2237 mg/l with a mean of 437 mg/l and the highest concentration of 2237 mg/l observed in Nunera samples whereas chlorides concentration ranges from 13 to 3905 mg/l with an average of 1083 mg/l and the highest concentration of 3905 mg/l observed in Nagla Sanjna.
The alkalinity concentration of all the samples in the present study ranges from 39 mg/l to1027mg/l as CaCO3 with an average concentration of 483 mg/l as CaCO3. The carbonate concentration in the present study in all samples ranges from 0 mg/l to 104 mg/l with an average concentration of 17 mg/l.
4.1 Langelier index
Langelier Index indicates the degree of saturation of CaCO3 in water and is calculated by pH, alkalinity, calcium concentration, total dissolved solids and water temperature of a water sample collected from the sample site. The positive value of Langelier shows water is over-saturated with CaCO3 and has a tendency to form CaCO3 scales in the distribution system whereas negative values of Langelier indicate water is undersaturated with CaCO3 and affinity toward corrosiveness.
The Langelier Index value close to zero indicates the water is saturated with calcium carbonate and is neither corrosive nor scale forming. Langelier Index from −1 to +1 has a low corrosive impact on metallic components, Water is unsaturated and corrosive for LI > 10. Langelier Index values outside this range may result in laundry stains or leaks. In the present analysis nearly 75% of the samples have LI < 0 and 23% of the samples are supersaturated having scaling tendency, supersaturated water is indicated by LI > 0. In the study area, a value of 1.56 observed in Yamuna river samples, a minimum value of −1.45 observed in the sample of Goverdhan site showing high corrosive nature of water and Narisemri site water is observed with no scaling tendency. The mean LI values are −0.020 depicting positive behavior toward corrosiveness in maximum samples of the study area.
4.2 Ryznar stability index
Ryznar index was given by John Ryznar to predict the saturation of CaCO3 in a given sample and the likelihood of CaCO3 scale formation and also indicates CaCO3 saturation state and scale formation. In the study area Minimum and Maximum RSI value observed in the Yamuna river and Goverdhan location samples is 5.49 and 10 whereas the average RSI value of 7.74 has been observed in all the samples. RSI value less than 5.5 represents a high scaling tendency, whereas values between 5.5 and 6.2 show moderate scaling tendency. In the study area, 8% of the samples have RSI values ranges from 6.2 to 6.8 having a low corrosive tendency, 83% of the samples depict moderate corrosive behavior with RSI values between 6.8 and 8.5 and the remaining 11% of the samples have more than 8.5 RSI values having rigorous corrosive tendency.
4.3 Aggressive index
Aggressive Index is developed for monitoring water in the asbestos pipe and due to its simplicity and convenience is a better substitute for the Langelier Index to indicate corrosivity of water. This aggressive index is determined using pH, total alkalinity and calcium hardness concentration in a given water sample. The AI value of 12 or above indicates nonaggressive (not corrosive) water, below 10 indicates extremely aggressive (corrosive) conditions and between 10 and 11.9 suggests the water to be moderately aggressive.
In the present study, 47% of the total samples of water have less than 10 AI value which shows high aggressiveness for corrosion, 52% of the sample have AI value between 10 and 12 showing moderate corrosive nature of water whereas the mean of AI values is 10.06 of all the samples and no sample is having AI value greater than 12 indicating a non-aggressive tendency of water toward corrosion. The minimum AI value of 9.06 observed in the Govardhan area and the Yamuna river samples have a maximum AI value of 11.30 in the study area.
4.4 Puckorious Scaling Index (PSI)
Puckorious Scaling Index (PSI: Puckorius and Brooke, 1991) is an important tool to establish a relationship between saturation state and scale formation by buffering capacity incorporation of water in the Index. Water having high calcium, low alkalinity and buffering capacity can have a high calcite saturation level which increases ion activity product whereas the decrease in carbonate concentration drastically decreases ion activity due to the small quantity present prior to initiation of precipitation having a high tendency to form scales due to driving force, but in very small quantity and is unobservable.
In the present study, the PSI value of less than 6 in 20% of the total samples thus conforming scales formation. In the study area, a minimum value of 4.56 and a maximum of 9.91 observed in Chaumaha and Goverdhan areas samples.46% of the samples have PSI values between 6 and 7 indicating water little corrosive in nature and 33% of the samples show PSI value greater than 7 shows the significant corrosive property of water. The mean PSI value of 6.69 has been assessed in all the samples of the study area.
4.5 Larson Skold Index (LSI)
The Larson Skold Index describes the ratio of the concentration of chloride and sulfate ions to the concentration of bicarbonate and carbonate ions. The LSI value of less than 0.8 indicates that chlorides and sulfate will not interfere with natural film formation.
LSI values between 0.8 and 1.2 designate chlorides and sulphates interference with natural film and value greater than 1.2 show higher corrosion and there is a higher corrosion rate tendency expected as index increases. In the study area, 6% of samples show less than 0.8 value indicating low corrosion and high scaling tendency whereas 12% of sample ranges between 0.8 and 1.2 indicate moderate corrosive nature of water and 80% of the samples have a value greater than 1.2 showing high corrosivity of water. Pirsua and Paintha sample has low 0.34 and high 25.74 of LSI value in the study area.
4.6 Chloride sulphate mass ratio (CSMR)
CSMR (Edwards and Triantafyllidou, 2007) is a basic parameter that defines the ratio in water as a major cause of lead leaching to water. CSMR ratio is calculated by chloride and sulphate concentration in a water sample and expressed in mg/l. In the study area, Shahpur has 0.013 and Usfar has 182.88 minimum and maximum CSMR values of water sample.9% of the total samples have less than 0.5 CSMR value showing water sample to be non-corrosive whereas 90% of the total sample has greater than 0.5 CSMR values indicates corrosiveness of water toward the distribution system.
4.7 Spatial distribution map of corrosive indices
Spatial distribution maps are prepared by Inverse Distance Weight (IDW) interpolation in the GIS environment of obtained results (Figs. 3a–d and 4a-b). The prepared maps correspond to the present water quality situation of the Mathura district. Prepared Map classified based on different indices as Ryznar Index, Langelier Saturation Index, Aggressive Index, Puckorious Index, Larson Skold Index and Chloride Sulphate Mass Ratio. The RI maps, Fig. 3(a)classified by red color as heavy, brown color as moderate scale formation whereas corrosiveness by a pale yellow color, moderate by blue color and green color heavy corrosiveness. In the study area, the maximum part has moderate corrosive behavior whereas distribution patches in the western and central parts have a corrosive tendency and small patches in the central part have moderate scale formation. The Langelier Index Fig. 3(b) designates that a large part is denoted by pink color has a corrosive tendency. Extension of purple patches in the study area is found from central to the eastern and northern side and very small patches are also found on the western side indicating the nature of water as scale forming. Aggressive Index map Fig. 3(c) of the study area shows corrosive behavior through yellow color and moderate corrosiveness through green patches. From Fig. 3(c) it is inferred that high and moderate corrosive nature of water has equal distribution whereas western, eastern and southern parts show large distribution compared to the central and northern part where small patches are seen.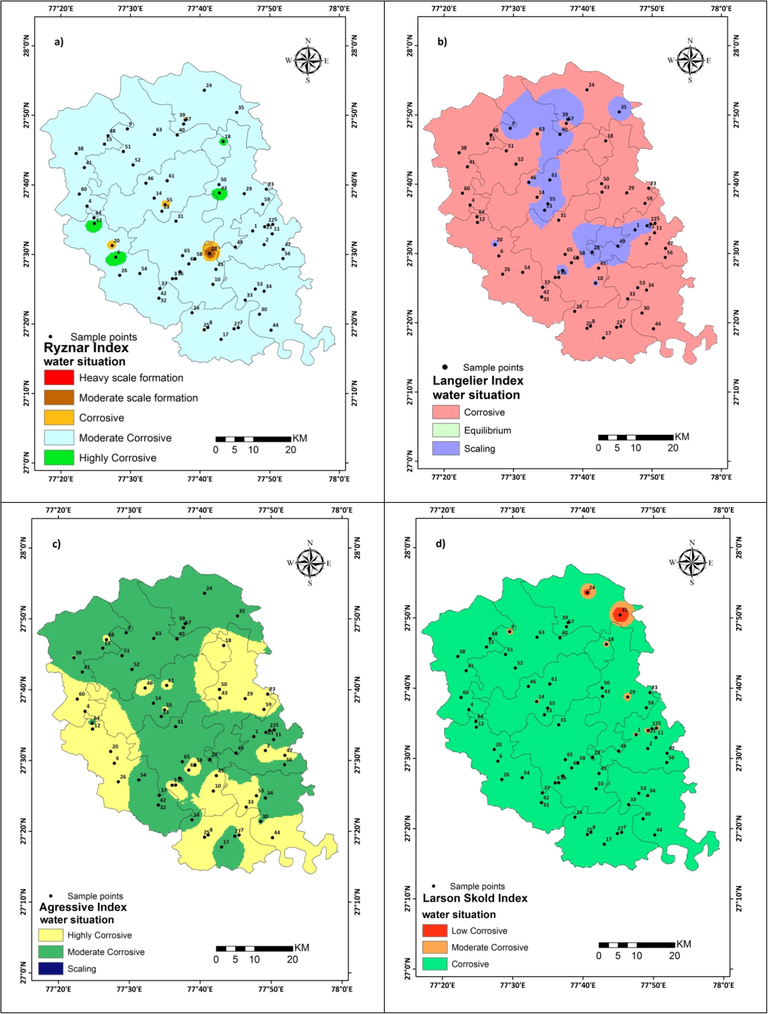
Spatial distribution map of Study area (a)Ryznar Index (b) Langelier Index c) Aggressive Index (d) Larson Skold Index.
The Larson Skold Fig. 3(d) is assessed portrayed. The bluish-green indicates very high, red color in the northeast show high, patches of orange color show moderate corrosive nature of water in the study area. The Puckorious Index map is also prepared and shown in Fig. 4(a). In the study area, dark green color patches distributed in western, southeastern, central and eastern part indicates water condition is highly corrosive. However, a brown color patch in western, central and near the boundary in the east confirms the scaling tendency of water. The remaining part shows little tendency of corrosiveness. In Chloride Sulphate Mass ratio map Fig. 4(b) is prepared and portrayed, purple color in the map indicates the highly corroding potential of water whereas small pink color patches in the northern region indicate a low corrosive behavior of water in the study area.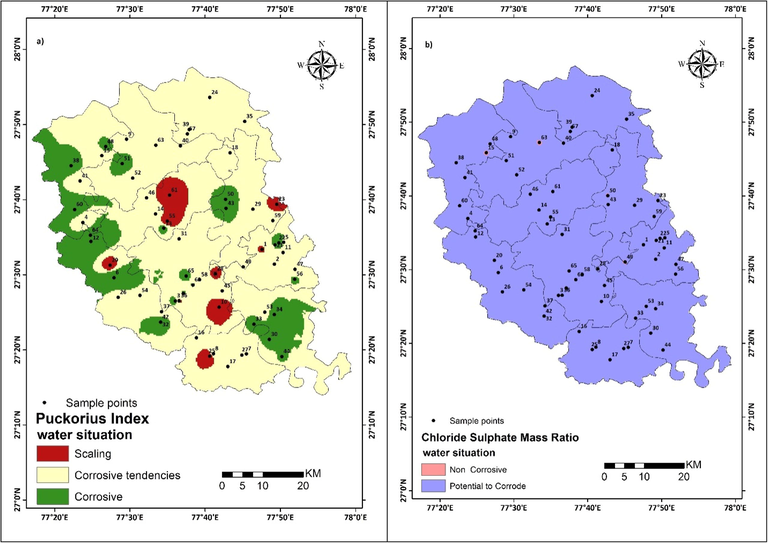
Spatial distribution map of Study area (a) Puckorius Index (b) Chloride Sulphate Mass Ratio.
It can be reported from the current study that the Mathura district lies within the Indo Gangetic Basin has a heavy influx of TDS, Na, Cl, and SO4. The area lies in an arid and semi-arid region where the salinity enhances due to excessive yield from tubewells and pumping stations provided by the state government. The present study can be connected well with the study conducted by Misra et al. (2006), thus indicating a high concentration of chemical constituents in the region's groundwater sources in terms of Na+, K+, Cl− & HCO3−. MacDonald et al. (2016) also mentioned the salinity issues that impact the area's Indo Gangetic Basin aquifers. The high evapotranspiration rate and low rainfall pattern in the area of assessment may also be attributed to this. Kapoor et al. (1981), demonstrated that the soil of the Indo Gangetic region was sodic in nature and salinity could be caused by aluminosilicate weathering in the region.
A research carried out by Kumar (1998) has shown us that the environment is rich in salt and plays a prominent role in alluvial deposits of the Ganga plain. Gurunadha Rao et al. (2000) performed research and found that the rapid increase in chloride, metals and sulphate in the studied region is attributed to the release of 10,000 m3/day of contaminated wastewater from the Mathura refinery. Ahmed et al. (2020) show that 75% of the study region specimen have high chloride concentration levels that affect the quality of water.
Ahmed et al. (2019) conducted a study and determined the heavy metals in terms of nickel, chromium and iron and reported the concentration to be much higher than the permissible limits prescribed by the World Health Organisation. It can be inferred that the concentration of chloride and sulphate is highly receptive to the corrosion of chromium and nickel and thus increases the aggressive behavior of water towards corrosion.
It can also be inferred that the increased chloride concentration in water can induce corrosion when coming in contact with borehole assembly and casing pipe because it tended to corrode stainless steel pipe material.
From the present study, it can be inferred that the high concentration of chlorides and sulfates escalates chromium, nickel and iron concentration in water that results in high corrosion in the study area. However, the results obtained from Langelier Index, Ryznar Index, Aggressive Index, Puckorius Index, Larson Skold Index and Chloride Sulphate Mass Ratio (Supplementary Table S3) reveals the fact that the ground and surface water in the area of Mathura District is highly corrosive in nature and not suitable for construction usage and also not feasible for carrying in the distribution system for water supplies. Therefore the study indicates the alarming situation in the study area as it can lead to a big economic loss and cause several human health problems in the area.
5 Conclusion
The analysis shows a high level of TDS, Na, Cl and SO4 concentration of the groundwater and surface waters in the Mathura district and the area lies within the arid and semi-arid zone. Besides, due to the excessive yield from tubewells and hand pumps provided by the State Government, the salinity of the area is rising. The tube wells and government hand pumps are the major sources for water being utilized for household and irrigation purposes. From the present study, it can also be inferred that the high concentration of chlorides and sulphates escalates chromium, nickel and iron concentration in water that results in high corrosion in the study area. The samples were jointly reported by the LI, RSI, AI and PSI to have strong corrosive reveals the fact that the ground and surface water in the area of Mathura District is highly corrosive in nature and not suitable for construction usage. The groundwater in the region is therefore not feasible to be used in the water distribution network for municipal water supplies. This study however reveals an alarming condition because it can lead to substantial economic losses and cause many issues in the field of human health research. The use of several indices of efficiency, corrosivity and scaling demonstrate that they provide immense knowledge which is significant for residents, industrialists and decision-makers. The insight presented in this research article will support the decision-making processes required in the study area for the care, conservation and preservation of water supplies.
Acknowledgments
We thank you for providing all the requisite facilities for analytical research to the Chairman, Department of Geology, AMU, Aligarh. This research work is part of the thesis work and is widely regarded by the University Grants Commission (UGC) to include Non-NET Fellowships. The authors are grateful to the Researchers Supporting Project number (RSP-2020/113), King Saud University, Riyadh, Saudi Arabia for the support.
Declaration of Competing Interest
The authors declare that they have no known competing financial interests or personal relationships that could have appeared to influence the work reported in this paper.
References
- Water quality assessment of shallow aquifer based on Canadian Council of Ministers of the environment index and its impact on irrigation of Mathura District, Uttar Pradesh. J. King Saud Univ. – Sci.. 2020;32(1):1218-1225.
- [CrossRef] [Google Scholar]
- Heavy metals and geo-accumulation index development for groundwater of Mathura City, Uttar Pradesh. Desalin. Water Treat.. 2019;138:291-300.
- [CrossRef] [Google Scholar]
- Evaluation of Owabi Reservoir (Ghana) water quality using factor analysis. Lakes Reserv. Res. Manage.. 2014;19(3):174-182.
- [CrossRef] [Google Scholar]
- Standard Methods for the Examination of Water and Wastewater (21th ed.). Washington, D.C.: APHA AWWA & WPCF; 2005.
- Survey of corrosion and scaling potential produced water from Ilam water treatment plant. World Appl. Sci. J.. 2009;7(11):11-24.
- [Google Scholar]
- Controlling corrosion in drinking water distribution systems: a grand challenge for the 21st century. Water Sci. Technol.. 2004;49(2):1-8.
- [CrossRef] [Google Scholar]
- Chloride-to-sulfate mass ratio and lead leaching to water. J. – Am. Water Works Assoc.. 2007;99(7):96-109.
- [CrossRef] [Google Scholar]
- Chemometric analysis for pollution source identification and human health risk assessment of water resources in Ojoto Province, southeast Nigeria. Appl. Water Sci.. 2020;10(4):1-18.
- [CrossRef] [Google Scholar]
- Mass transport modelling for assessement of groundwater contamination around Mathura oil refinery, Mathura, Uttar Pradesh, India. Environ. Geol.. 2000;39(10):1138-1146.
- [CrossRef] [Google Scholar]
- Correlation between corrosion indices and corrosiveness of groundwater: a study with reference to selected areas of Krishna District, Andhra Pradesh, India. Environ. Earth Sci.. 2017;76(16)
- [CrossRef] [Google Scholar]
- Weathering of micaceous minerals in some salt-affected soils. J. Indian Soc. Soil Sci.. 1981;29(4):486-492.
- [Google Scholar]
- Khan, S. 2017. Hydrogeology of Uttarpradesh. Development, River Rejuvenation, Ganga, Central Ground Water Board, Northern Region. pp. 37.
- Kumar, R., 1998. Role of Himalayan Orogeny in the formation of salt affected soils of the Indian sub-continent. In: Proceedings of 16th World Congress of Soil Science, Held at Montpellier, pp. 20–26.
- Sensitivity of corrosion and scaling indices based on ions; case study Iran. Water Qual. Expo. Health. 2015;7(3):363-372.
- [CrossRef] [Google Scholar]
- Chemical Equilibria in water treatment. J. – Am. Water Works Assoc.. 1946;38(2):169-178.
- [CrossRef] [Google Scholar]
- Groundwater quality and depletion in the Indo-Gangetic Basin mapped from in situ observations. Nat. Geosci.. 2016;9(10):762-766.
- [CrossRef] [Google Scholar]
- Escalation of groundwater fluoride in the Ganga alluvial plain of India. J. Fluoride. 2006;39(1):35-38.
- [Google Scholar]
- Assessment of groundwater quality for irrigation: a case study from Bandalamottu lead mining area, Guntur District, Andhra Pradesh, South India. Appl. Water Sci.. 2014;4(4):385-396.
- [CrossRef] [Google Scholar]
- Role of chloride, sulfate, and alkalinity on galvanic lead corrosion. Corros. J.. 2011;67(6):065005-1-065005-9.
- [CrossRef] [Google Scholar]
- A new practical index for calcium carbonate scale prediction in cooling tower systems. Corros. J.. 1991;47(4):280-284.
- [CrossRef] [Google Scholar]
- Studying rural water corrosion and sedimentation indices under Abfar Company authority, Kashan, 2007–2009. J. Feyz, Sci. Res. Q. 2009;XV(4):382-388.
- [Google Scholar]
- A new index for determining the amount of calcium carbonate scale formed by a water. J. –Am. Water Works Assoc.. 1944;36(4):472-483.
- [Google Scholar]
- Assessment of corrosion and scaling potential of the groundwater in the Thanjavur district using hydrogeochemical analysis and spatial modeling techniques. SN Appl. Sci.. 2019;1(5):395.
- [CrossRef] [Google Scholar]
- Qualitative assessment, geochemical characterization and corrosion-scaling potential of groundwater resources in Ghaziabad district of Uttar Pradesh, India. Groundwater Sustainable Dev.. 2020;10(February):100370
- [CrossRef] [Google Scholar]
- Assessment of scale formation and corrosion of drinking water supplies in Ilam city (Iran) Environ. Health Eng. Manage.. 2016;3(2):75-80.
- [CrossRef] [Google Scholar]
Appendix A
Supplementary data
Supplementary data to this article can be found online at https://doi.org/10.1016/j.jksus.2020.101237.
Appendix A
Supplementary data
The following are the Supplementary data to this article:


