

Translate this page into:
A methodological framework integrating habitat suitability and landscape connectivity to identify optimal regions for insecticide application: A case study in Tongzhou, China
⁎Corresponding authors. wanghekunyuan@189.cn (Kunyuan Wanghe), jiujiu@bjfu.edu.cn (Kai Li)
-
Received: ,
Accepted: ,
This article was originally published by Elsevier and was migrated to Scientific Scholar after the change of Publisher.
Abstract
Insecticide application is still a standard method in pest management. However, the current regions for insecticide application usually focus on the host of the pest but ignore the migration pathways, continually resulting in pests’ periodic outbreaks. This research provides a valuable modeling framework to identify optimal regions for insecticide application to solve this problem. This modeling framework optimizes insecticide areas based on habitat suitability and landscape connectivity, combining the MaxEnt and circuit theory. We conducted a case study in Beijing, China, to elucidate the application of this modeling framework. The input data included 517 occurrence points of Semiothisa cinerearia collected in the fieldwork and the environmental variables related to the eco-physiological characteristics of this species. The results indicated that the Chinese scholar tree (Styphnolobium japonicum) was the most vulnerable species. Increasing the pesticide region by 11.9% at some crucial corridors of the target species, the pest management effectiveness increased by 27.7%, compared with the pesticide applied only to the Chinese scholar trees. In summary, this study proposed a convenient and efficient modeling methodology for planning optimal regions for insecticide application.
Keywords
Styphnolobium japonicum
Pest control
Ecology model
Species distribution models
Circuit theory
Invasive species management

1 Introduction
Pest outbreaks in natural and artificial forest ecosystems result in degradation of tree fitness, thus significantly increasing rates of tree mortality (Ferrenberg, 2016; Marini et al., 2021). For example, Semiothisa cinerearia (Bremer et Grey; Lepidoptera: Geometridae) has caused severe damage to the Chinese scholar tree (Styphnolobium japonicum), a widely planted urban green tree species in China and East Asia (Tang et al., 2014; Zhu et al., 2020b). The S. cinerearia consumes the entire tree leave in 2–3 days and causes disease and ultimately death to the host tree (Wu et al., 1998; Zhang et al., 2013). In some cities, 50% to 100% of S. japonicum had been hosted by S. cinerearia (Zhang et al., 2013) and therefore warrant special attention to control urban green trees loss, especially in like Beijing where air pollution is a severe issue. Additionally, over the last decades, climate change has triggered an increase in the range expansion and outbreaks of some pests (Fernandez-Carrillo et al., 2020; Venäläinen et al., 2020). Forest insect pace with climate change are expected to be highly propagative, due to shorter life cycle, and have higher fecundity and survival rate (Jactel et al., 2019). Spraying insecticide is still a common practice in pest management, especially in the urban modified forestry ecosystems (Meissle et al., 2010).
However, using insecticides could not wholly solve some pests’ periodic/sporadic outbreaks. For example, Simulium chutteri (a blackfly) broke out periodically in South Africa, even though some wide insecticide control measures have been conducted (Rivers-Moore et al., 2008). Instead, unchecked and excessive insecticides caused damage to the natural ecosystem and would be lethal for the pests’ natural predators (Frolov, 2015; Tang et al., 2008). The ever-growing list of pests is damaging natural and artificial forest ecosystems worldwide (Aukema et al., 2010; Loo, 2008; Ramsfield et al., 2016; Santini et al., 2013). Therefore, it is urgent to determine the efficient regions for pesticides to decrease the risk of periodic outbreaks and the damage of insecticides to the natural ecosystem.
The hypothesis that some insects occupy multiple niches (or hosts) during their life histories and migration processes could be the basis to explain these issues (Buckley et al., 2010; Melin et al., 2007; Singer, 1983). For instance, the Asian long-horned beetle (Anoplophora glabripennis) attack more than 15 families of tree species throughout their invasion pathways (Dodds and Orwig, 2011; Haack et al., 2010). Therefore, if the controlling measures had been conducted at the most suitable habitat (e.g., the food source of the pest), the other adjacent and suitable niches would still provide habitat to the survived individuals of the pests (Cowley et al., 2015; Demirozer et al., 2012; Dupas et al., 2014; Laćan and McBride, 2008). This hypothesis implied that if the spread pathways had not been cut off, the periodic outbreaks would possibly happen again (Tang et al., 2008). Therefore, not only the habitat suitability should be considered (Phillips et al., 2006), but the dispersal pathways should also be cut off by anthropogenic barriers to decrease the risk of secondary pest outbreaks (Dickson et al., 2019; Hlásny et al., 2016).
Previous studies (Marchioro and Krechemer, 2021; Reil et al., 2018; Schöneberg et al., 2020) merely estimated the habitat suitability or landscape connectivity to optimize the pest management regions. Habitat suitability and landscape connectivity are two critical requirements for periodic pest outbreaks (Zhu et al., 2020a; Zhu et al., 2020b). Still, little has been done to integrate these two essential requirements to identify regions for efficiently applying insecticide for pest management (Elmes et al., 2019). On the one hand, habitat suitability quantifies the suitable niche of the targeted pest. Thus, the realized niche of this targeted species (specific environmental condition) would identify (Zhu et al., 2020a; Zhu et al., 2020b). The MaxEnt model was a commonly used species distribution model (SDM) to estimate the habitat suitability (Phillips et al., 2017; Phillips and Dudík, 2008; Yang et al., 2018), especially for pest management (Kumar et al., 2014; Wang et al., 2010), which is based on a machine-learning algorithm to predict the suitable habitat distribution with the maximum entropy solution (Phillips et al., 2006). On the other hand, landscape connectivity measures the dispersal ability in the pest invasion pathways (Dickson et al., 2019). As a result, the potentially spatial movement patterns across their incontiguous and heterogeneous habitats can be simulated (Dupas et al., 2014; Viani et al., 2018). The circuit theory estimates the landscape connectivity of species based on the equivalence between graph theory representations of random flow of electrons in a circuit (McRae et al., 2008). Many studies applied this method on species invasion (Elmes et al., 2019; Falaschi et al., 2018), distribution range shift of endangered mammals (Puddu and Maiorano, 2016; Zhao et al., 2019), gene flow of a disease vector (Medley et al., 2015), and phylogeographic analysis (Dupas et al., 2014). Therefore, it is necessary to develop an integrated approach considering both habitat suitability and landscape connectivity, contributing to the prevention of periodic pest outbreaks.
This research provided a useful modeling framework integrating MaxEnt and the circuit theory to identify optimal regions for insecticide application of S. cinerearia, as a case study in Tongzhou district, Beijing, China. The result was a raster map representing the SDM-circuit values. This article aimed at 1) constructing a combine model, integrating MaxEnt and circuit theory using the field surveyed data points; 2) testing the hypothesis that S. cinerearia occupied multiple niches in an urban ecosystem, and 3) customizing the strategy for efficient and economical pest control in their inherent outbreak regions and dispersal pathways.
2 Materials and methods
2.1 Study area
The study area was the entire region of Tongzhou District (39°36′-40°02′N, 116°32′-116°56′E, area 912.34 km2, altitude 8.2–27.6 m) of Beijing, China (Fig. 1). The mean annual temperature record in the area is 11.3 °C, while the average annual precipitation is 620 mm, and the frost-free period is about 190 days per year. The outbreaks of S. cinerearia in 2013 had critically damaged the urban green trees in the study area (Tang et al., 2014). Some insecticides were subsequently adopted for pest control, but based on our fieldwork findings, the population of S. cinerearia persisted with periodic outbreaks in the area (Fig. 1). The adverse impact in this sprawling city caused by the S. cinerearia was a heavy financial burden to the local government. A new city is in the construction and development phase here, as the Chinese capital sub-center (Wanghe et al., 2019). Therefore, it is essential to efficiently control pest outbreaks in the future, which is critical to the new city's development.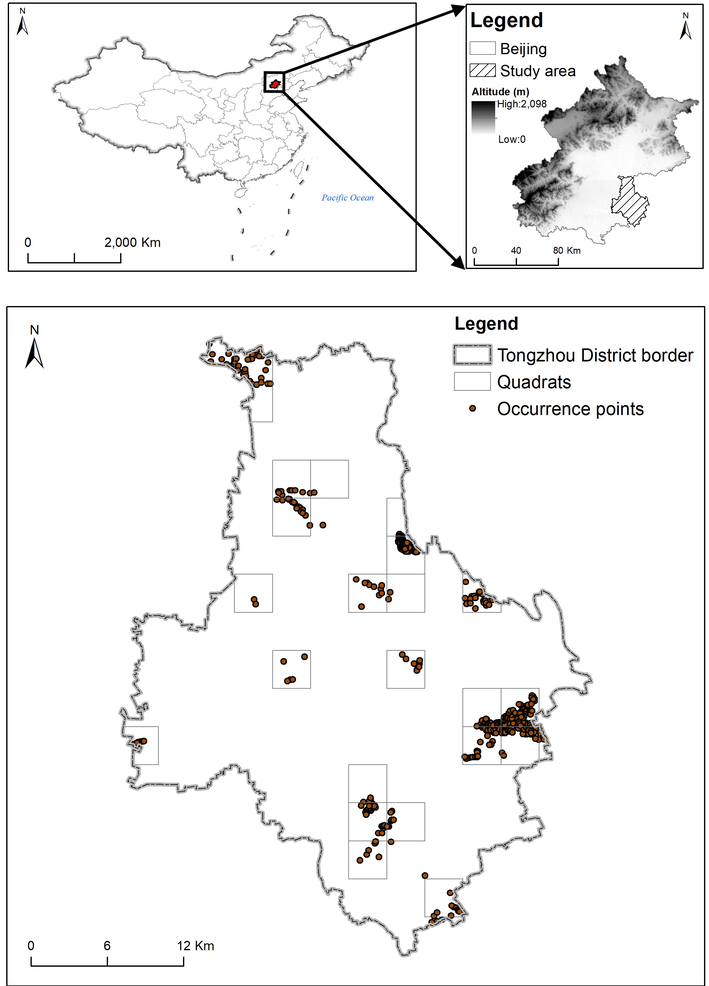
Locations of our study area and the quadrats selected randomly, as well as S. cinerearia occurrence points surveyed.
2.2 Sampling
We randomly set 24 quadrats (3 km × 3 km) in the urban and rural areas of Tongzhou District (Fig. 1). To achieve random placement of those quadrats, we first divided the study areas into 101 grids. Secondly, 1,000 random points were generated on the grids. These random points were developed by the “Create Random Points” tool in the system toolbox of ArcGIS 10.2.2 software. After repeating the second step 10 times, the top 24 quadrats with the most randomly generated points were selected as the sampling quadrats. Fieldwork was conducted from June to August 2018. We searched and collected the target specimens S. cinerearia using the “Sweep Sampling Method” (Gadagkar et al., 1990) in each quadrat, in which we systematically swept all the ground level vegetation (<2.5 m). The occurrence points were recorded with the help of a Global Position System (GPS) with the World Geodetic System 1984 (WGS 84) coordinate system. Five hundred and seventeen individuals of S. cinerearia were collected in the fieldwork (Fig. 1 and Table S1). The collected voucher specimens were deposited in the Natural Museum of Beijing Forestry University, Beijing, China.
2.3 The scope, assumption, and framework of the modeling
Fig. 2 illustrates the modeling framework of this study. A combine model, integrating MaxEnt and the circuit theory was applied. The scope of this combination was to predict the dispersal ability of the target pest relating to the original habitat suitability without any control measurements and the changes of habitat suitability after some control measures were conducted. This study was based on certain assumptions. First, we assumed that the results of MaxEnt represent the present habitat suitability before pest control. Second, we assumed that the control measures change the current habitat suitability of the pest. By comparing the SDM-circuit values among those different scenarios (explained in Section 2.8), the pest management effectiveness among the scenarios was identified.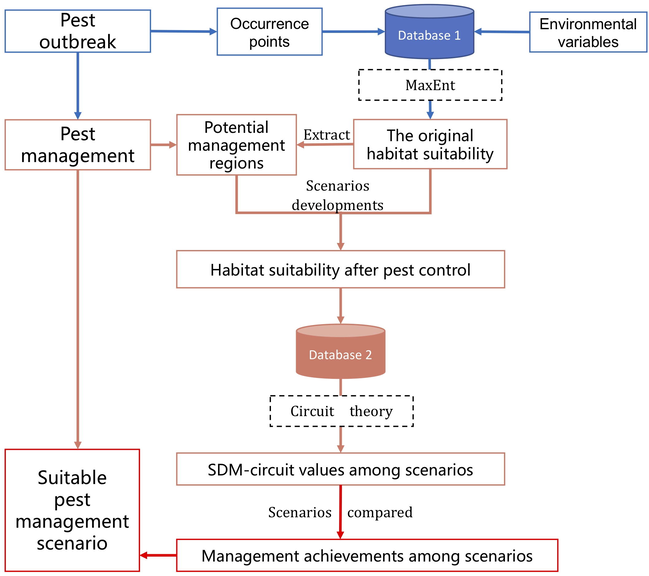
Modeling framework of the study.
2.4 Environmental variables
Eight environmental variables (Table 1) were selected to model habitat suitability based on current knowledge of the eco-physiological characteristics of targeted species (Jiang et al., 2018; Lozier and Mills, 2011), especially in the urban areas (Godefroid et al., 2020). Additionally, our study area landscape is plain and relatively small, without apparent altitude and climate differences, so we did not select altitude and climate as the environmental variables.
Sources
Names
Descriptions
Ranges
The forest resource inventory database
Host
The distance to the nearest tree Styphnolobium japonicum (the primary host of S. cinerearia)
0–2,084 m
Forest
The percentage coverage of forests in a raster
0–100%
Shrub
The percentage coverage of shrubs in a raster
0–100%
Meadow
The percentage coverage of meadows in a raster
0–100%
The land-use dataset
Building
The distance from a raster to the nearest buildings
0–1,086 m
Road
The distance from a raster to the nearest roads
0–1,694 m
Cropland
The distance from a raster to the nearest croplands
0–3,569 m
Water
The distance from a raster to the nearest water
0–2,381 m
The environmental variables were extracted from the forest resource inventory database and the land-use dataset (Table 1). The forest resource inventory database in 2015 was a polygon shapefile provided by the Beijing Tongzhou Forestry Bureau. The locations of S. japonicum (the primary host of S. cinerearia), the percentage coverages of forests, and shrubs and meadows in a cell were extracted from this database as raster maps at the resolution of 10 m × 10 m. The land-use dataset in 2015 was interpreted from a series of Gaofen-2 satellite images (resolution = 0.80 m) (Wanghe et al., 2020b; Wanghe et al., 2020a; Wanghe et al., 2019). Subsequently, four environmental variables, the distance from a raster to the nearest building, road, cropland, and water, were derived from the land-use dataset using the Euclidean Distance System Toolboxes of ArcGIS 10.2 software (Environmental Systems Research Institute Inc., Redlands, USA).
2.5 Species distribution model (SDM)
2.5.1 Correlation analyses of the environmental variables
To avoid model overfitting in calibration caused by multicollinearity among predictors (Warren and Seifert, 2011), we conducted the pairwise correlation (r) analyses among the environmental variables by the Band Collection Statistics Tool of ArcGIS 10.2 software, Following Dormann et al., (2013) suggestion (conservative threshold of r = |0.7|) All eight environmental variables exhibited low bivariate correlation coefficients < |0.7| (Table S2) in the current study. Therefore, all eight variables were retained for further analyses.
2.5.2 Parameter setting of MaxEnt model
The MaxEnt model version 4.4.1 (Phillips et al., 2006) was used to estimate the habitat suitability from the 517 surveyed occurrence points of S. cinerearia and the eight derived environmental variables of these occurrence points. The model was submitted to 10 repetitions, and for each repetition, cross-validation was performed. The occurrence dataset was randomly split into ten equal parts; each was employed as the model built with the remnants nine test dataset. Accordingly, all records were practiced nine times for training and one for testing the model, and all the observations were equally weighted in the training and testing of the model (Merow et al., 2013). A convergence threshold of 0.00001 was inputted, with 500 interactions and 10,000 background points. The Jack-Knife test quantified the participation of each environmental variable in the modeling. To avoid overfitting, MaxEnt was operated, allowing only “linear”, “product” and “quadratic” features (Falaschi et al., 2018). The accuracy of the final result was assessed by the area under the receiver operating characteristics curve (AUC). The range of AUC was from 0 to 1, and the relatively high value of AUC indicated that the model's prediction result was relatively accurate and agreeable (Fig. S1) (Phillips et al., 2006). This approach produced a raster habitat suitability map with values ranging from 0 to 1.
2.6 Connectivity model
The connectivity model was built using Circuitscape version 4.0.5 (McRae and Shah, 2014), a software designed to model habitat connectivity using the electrical circuit theory (McRae et al., 2008). The input was a conductance map from the habitat suitability map estimated by the MaxEnt model. The standard conductance of each cell was defined by rescaling the habitat suitability map between 0 (minimum suitability) to 1 (maximum suitability). Circuitscape ran in advanced mode to allow for the use of arbitrary current sources and grounds. The cells at the host location were set as current sources of one ampere. The cells at the perimeter of the study areas represented the ground of one ohm, following Falaschi et al., (2018). Thus, the model could predict the possible spread of S. cinerearia, considering all possible directions in one fell swoop (Cowley et al., 2015). The current densities of the cells estimated by this connectivity model were defined as the SDM-circuit values. The higher SDM-circuit indicated cells with more necessary net passage probabilities for random movement, moving from one raster to another (McRae et al., 2008). The movement boundaries and the “pinch points” among populations were identified by Kernel Density analyses (Silverman, 2018) based on the SDM-circuit values, using the Kernel Density Tool (Silverman, 2018) of ArcMap 10.2 software (ESRI, 2011).
2.7 Scenario developments
The SDM and connectivity model identified the regions of suitable habitat and corridors of S. cinerearia. However, widely spraying insecticide at all those regions was costly and would further impose some unfavorable impacts on the ecosystem, such as damaging the pests’ natural enemies Therefore, a cost-effective solution was to detect the significant and economical regions/areas for chemical control. To determine that cost-effective solution, we developed five scenarios and compared the pest management effectiveness of those scenarios.
Firstly, we defined that part A was the host’s location and part B was the location of other tree species except for the host. Secondly, part B was divided into five sub-parts based on the SDM-circuit values ranked by Jenks natural breaks method (Chen et al., 2013): top 20% (sub-part B20), top 40% (sub-part B40), top 60% (sub-part B60), top 80% (sub-part B80), and top 100% (sub-part B100). Those natural break classifications were in terms of natural groupings inherent to their SDM-circuit values, whose class breaks were identified that the best group was similarly valued and that maximizes the differences between classes (ESRI, 2011). Thirdly, the regions for insecticides of scenario Bn were defined as the union of part A and sub-part Bn (n = 20, 40, 60, 80, and 100, respectively) (Fig. S2). Based on the second and third assumptions described in section 2.3, the habitat suitability of the regions for insecticides was modified to a value approaching zero. The habitat suitability of the regions without insecticides remained unchanged. Finally, the five scenarios were independently inputted to the connectivity model.
2.8 Scenario comparisons
To examine pest management performance/effectiveness, those five scenarios were compared with the connectivity model's original result (without the assumptive scenario). The “fuzzy numerical” algorithm (Jiang and Chen, 2003) (Eqs. (1) and (2)) was implemented, allowing a cell-to-cell comparison between two raster maps. In Eqs. (1) and (2), map A was the initial result of the connectivity model, and map B was one of the scenarios. The raster maps A and B were in the same location with the same rows and columns. The ai and bi were one cell on the maps A and B in the same location, and j was the total number of cells. Consequently, S(ai,bi) depicted a new map highlighting the divergences between maps A and B. S(A,B) referred to the average differentiation between the entire maps of A and B, ranging from zero to one: one meaning two completely different maps, and zero representing an identical pair. Therefore, a higher S(A,B) indicated a better pest management performance of a sub-scenario than the original result (Visser and De Nijs, 2006). Those calculations were programmed by Python 2.2 using the ArcPy site package (ESRI, 2011).
Ultimately, a regression model between the two variables, S (A, B) and the control area of sub-part Bn, was conducted by the basic Trendline R package. The computer device executing all analyses was a Mac Pro (2019) graphic workstation with 3.5 GHz Intel Xeon W CPU, 32 GB RAM, and Windows 10 Professional operating system.
3 Results
3.1 S. cinerearia habitat suitability
The AUC value (0.895 ± 0.018, mean ± standard deviation) indicated that the results of SDM had a receivable result (Fig. S1). The high AUC value (compared to the possible maximum 1.0) indicated that the quality of habitat suitability map derived by the MaxEnt models was high and the sampling quadrats were sufficient (Phillips et al., 2006). The relative importance of environmental variables was assessed by the Jack-Knife test (Fig. 3), which implied that forests and hosts appeared to have the most useful statistical information. The contributions of environmental variables are in Table S3. The habitat suitability map of S. cinerearia (Fig. 4) illustrated that the average suitability in the entire study was 0.1231 (SD = 0.1791). Comparably, the mean suitability in the location with S. japonicum was 0.5315 (SD = 0.1468), while the average suitability in the regions without S. japonicum was 0.1101 (SD = 0.1640). Our results indicated that the places of S. japonicum were ordinarily more suitable for S. cinerearia than other land-use types.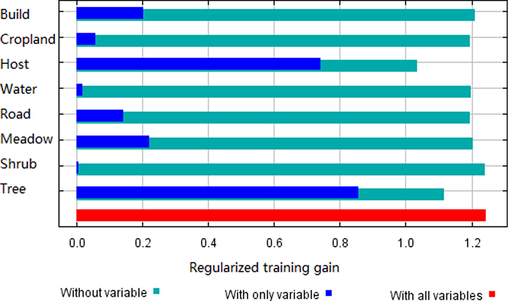
Relative importance of environmental variables (training gains) in MaxEnt models by the Jack-knife test. The names and descriptions of those environmental variables see Table 1.
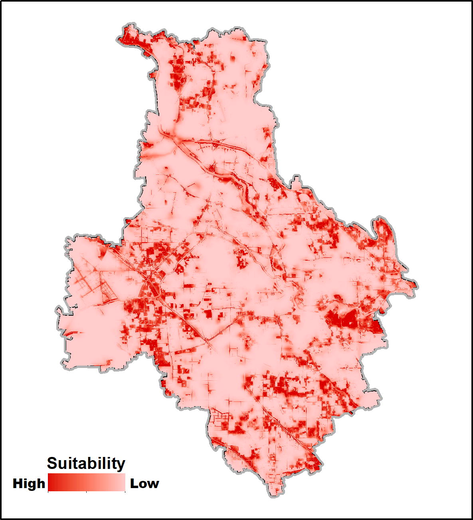
Habitat suitability map for S. cinerearia.
We compared the habitat suitability among the top ten widely planted tree species in Tongzhou District (Fig. 5). S. japonicum, the host of S. cinerearia, provided the most suitable habitat for this pest insect. In other words, S. japonicum was the most vulnerable species to S. cinerearia, compared with the other nine tree species, which was also widely planted in the study area. The genus Populus (P. tomentosa and P. canadensis) presented the least suitable habitat to S. cinerearia compared to the other eight species.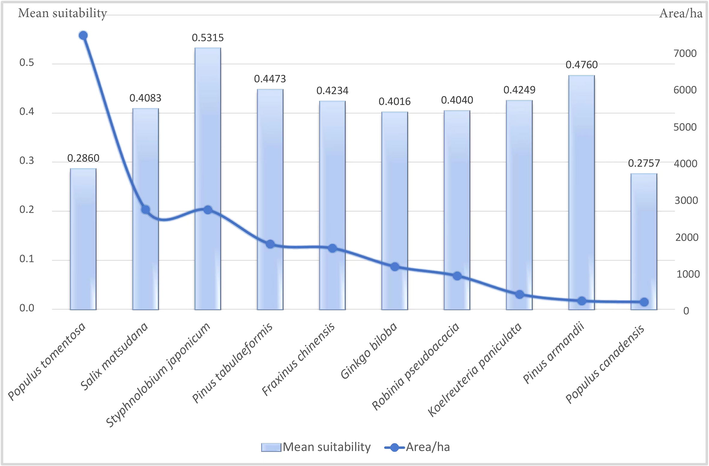
Comparison of habitat suitability providing to S. cinerearia among the top ten widely planned urban greening tree species.
3.2 S. cinerearia habitat connectivity
The map of current densities/SDM-circuit values (Fig. 6) indicated the passage probabilities of the target pest. A cell with a high current density value implied that it would provide great landscape connectivity to S. cinerearia (McRae et al., 2008). Our results showed that the mean current density of the host tree species (S. japonicum) was 39.268 (SD = 30.456), while the average current density of other tree species was 25.973 (SD = 25.892).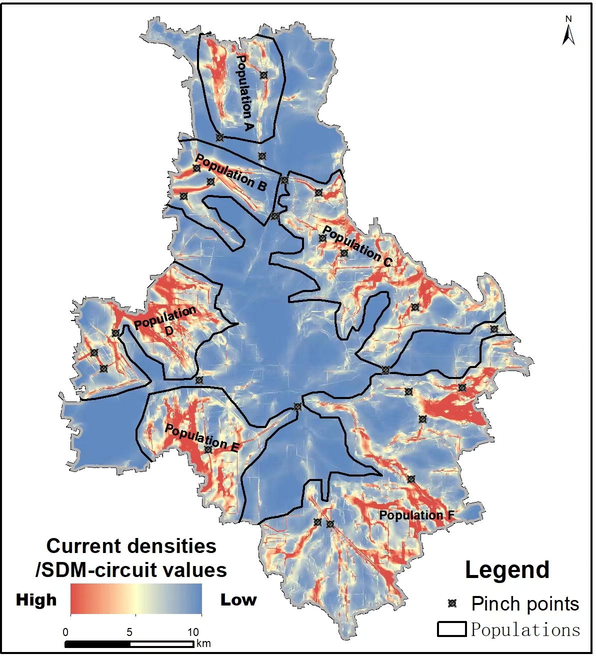
Map of the current densities/SDM-circuit values of S. cinerearia. Higher current densities indicate cells with higher net passage probabilities for random walkers moving from one patch to the other. The map highlights “pinch points”, which are in some linear narrow pathways but providing critical habitat connections between or within two populations.
Six populations with high current densities were distinguished (Fig. 6). Our results recognized some “pinch points” (Fig. 6). The “pinch points” were narrow linear pathways of S. cinerearia between or within those populations.
3.3 Scenarios comparisons
The area of part A is 27.03 km2, and the areas of sub-parts B20, B40, B60, B80, and B100 (the red patches in Fig. S2) are 3.22, 20.55, 65.47, 137.90, and 253.28 km2, respectively. Fig. 7 describes the differences in management performances among these scenarios. While the effectiveness of pest management on the host was similar from scenarios B20 to B100, by increasing the area of chemical control, the passage probabilities of S. cinerearia in the other tree species were decreasing.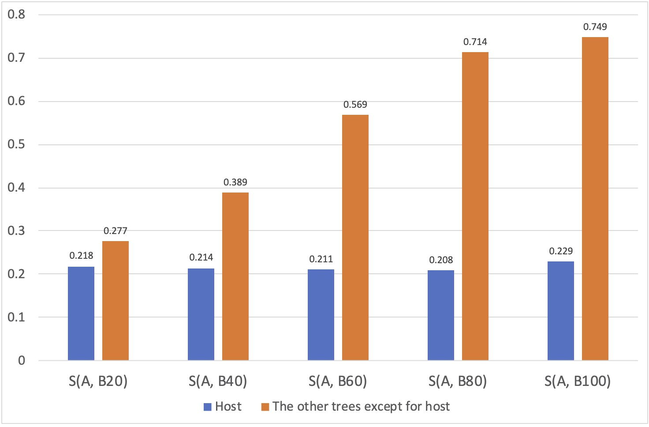
The management performances among the scenarios. The y-axis is the value of S(A,B) described in Equation (2). In the x-axis, “A, Bn” means the scenario Bn vs. the original connectivity model.
Fig. 8 displays the regression model results between two variables, S (A, B) and A (the area of the sub-part Bn). The most suitable model was the polynomial regression, whose R2 = 0.9937. This result indicated that management effectiveness increased while enlarging the regions of chemical control when A < 200 km2. The marginal benefit of scenario B20 was the maximum among all scenarios. Therefore, scenario B20 was the most efficient one to conduct chemical prevention, in which the areas of chemical application were increased only by 3.22 km2 (11.9%). At the same time, the connectivity of the other trees species was decreased by 27.7%.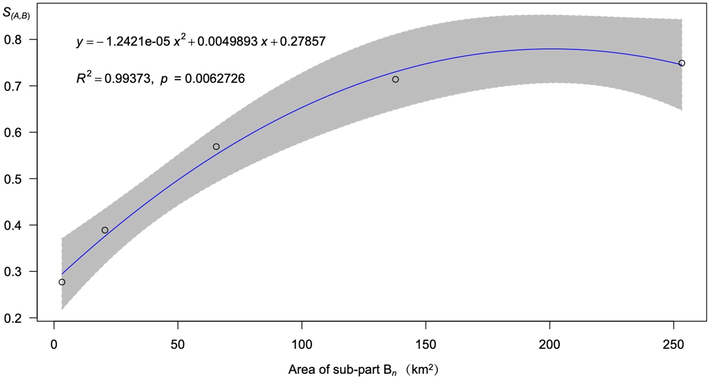
Result of the regression model. The y-axis is the value of S(A,B) described in Equation (2). The x-axis means the area of sub-part Bn (km2). The grey shaded areas are 95% confidence intervals.
4 Discussion
4.1 The implications for pest management
The list of forests being damaged by pests is growing worldwide (Aukema et al., 2010; Loo, 2008; Ramsfield et al., 2016; Santini et al., 2013). Compared with natural forests, urban trees are more vulnerable to pest incursions (Paap et al., 2017). The limited tree diversity in the urban ecosystem further predisposes urban forests to potentially devastating pest outbreaks (Laćan and McBride, 2008; Paap et al., 2017). For example, ash is a widely planted city street tree in the United States, consisting primarily of a limited number of cultivars of white and green ash (Fraxinus americana and Fraxinus pennsylvanica) (MacFarlane and Meyer, 2005). This situation resulted in low genetic diversity and enhanced the risk of pest incursions to urban plants. As a result, extensive damage occurred in urban greening of the northeastern United States with the accidental incursions of the emerald ash borer (Agrilus planipennis) (Kovacs et al., 2010). In the current study, the urban forests were composed of dozens of different tree species (Fig. 5). However, the periodic outbreaks of S. cinerearia have been causing significant disruption to the urban forests, although some chemical control focused on the host. Similarly, Simulium chutteri broke out periodically in South Africa, even though some integrated control measures have been adopted (Rivers-Moore et al., 2008). The issues remained as neither increasing the diversity of urban forest nor host-specific pest management measures may completely solve periodic pest outbreaks, which could be explained by the theory of island biogeography and landscape ecology (Simberloff, 1974; Zimmerman and Bierregaard, 1986). Our study focused on an area of the urban ecosystem at the local scale, where the urban trees were always isolated by some artificial surfaces and infrastructures, such as road networks and buildings (Wanghe et al., 2019). Consequently, each isolated land unit of urban greenery (e.g., an urban park) could be regarded as an analogous island (Zimmerman and Bierregaard, 1986). Because of the homogenous environment at the local scale, these widely planted urban greening trees (Fig. 5) in each island likely occupied similar niches (Shushan et al., 2016), whose community structure would adapt itself to a dynamic equilibrium among the parasitoid and host, as well as their habitat (Zimmerman and Bierregaard, 1986).
Our results highlighted that the targeted insect's connectivity and migration should be considered a significant component within pest management. In many cases (Dodds and Orwig, 2011; Haack et al., 2010; Paap et al., 2017; Santini et al., 2013; Smith et al., 2007), some clear evidence proposed that after the arrival of these pests into urban areas, their subsequent spread into natural or planted forest landscapes was through multiple means and migratory pathways. For example, the invasive pathways of Asian long-horned beetles contained more than 15 families of trees, which remained in the urban settings until the 2008 outbreak in the natural forest in Massachusetts, the United States (Dodds and Orwig, 2011; Haack et al., 2010). In the current study, although S. japonicum was the primary host and provided the most suitable habitat to S. cinerearia, other tree species might still provide multiple niches to the moth (Zhang et al., 2013). The current study identified 42.9% of the occurrence points near but not located in S. japonicum. This result indicated that the imago of S. cinerearia could migrate and select multiple niches (tree species) other than its primary host (Fig. 5). In addition, the result of the connectivity model (Fig. 6) identified that not only the host tree species of S. cinerearia helped the pest to migrate, but other tree species also served the same purpose. We built and tested different scenario comparisons, suggesting that there would be multiple migratory pathways of S. cinerearia if the most suitable habitat (i.e., the primary host) had been removed. Those representations possibly supported the hypothesis of insects’ multiple niches because of their migration and adaptation abilities.
We presumed that decreasing the pests’ connectivity at some momentous pathways (e.g., the pinch points in Fig. 6) might sufficiently alleviate the probability of periodic outbreaks and consequential spread. S. japonicum was the most vulnerable to the incursion of S. cinerearia, compared with the other widely planted nine tree species found in the area. A study suggested that S. japonicum was not the only food source of S. cinerearia (Tang et al., 2014). The pest prevalence in other plant species indicated that it could survive at different habitats in an urban ecosystem. Therefore, spraying pesticides only in its favorable habitat (S. japonicum) would not eliminate the outbreak, as some survivors with resistance genes could move to the other niches through some high connectivity corridors (Feng et al., 2019; Tang et al., 2019). As a result, there would always be a risk of a secondary pest outbreak. Those representations might explain the reasons for periodic pest outbreaks in our study area, even if some chemical control had been conducted on the most vulnerable tree (i.e., S. japonicum). The other habitat providing critical landscape connectivity, such as sub-part B20 (Fig. S2a), was also the potential and efficient pest management region (Fig. 9). Our results showed that the genus Populus (P. tomentosa and P. canadensis) presented the most miniature habitat suitability. In other words, it was more resistant to S. cinerearia than the other eight species. Therefore, planting P. tomentosa and P. canadensis at “pinch points” would probably halt the outbreak and migration of S. cinerearia. Moreover, some anthropogenic barriers should be built in the “pinch points” to decrease the connectivity. For example, although the Sixth Ring Road isolated the Populations B and C (Fig. 6), some “pinch points” between the two populations still acted as corridors for S. cinerearia. Thus, cutting off those “pinch points” could minimize the probability of migration between Populations B and C.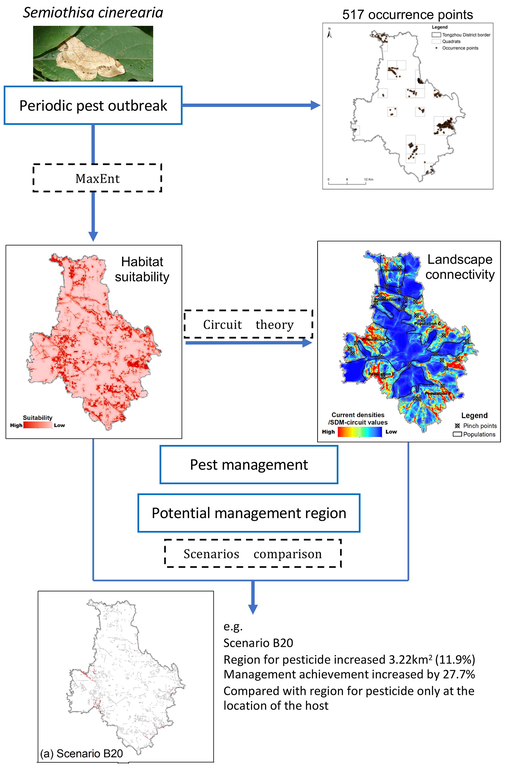
Flow chart for the combinational modeling between habitat suitability and landscape connectivity to identify the potential regions for pest management.
4.2 The availability and limitation of this combinational model for pest management
Many studies (Fischbein et al., 2019; Jiang et al., 2018; Müller et al., 2019) recognized potential habitat aimed at pest management by SDM without analyzing landscape connectivity. Thus, some significant pathways of the target species could not be identified (Cowley et al., 2015). For example, the potential dispersal of the Asian long-horned beetle was predicted using (but not combining) SDM and the circuit theory (Elmes et al., 2019), but the relationship between habitat suitability and landscape connectivity was ignored. However, few studies used this associated method on pest insect management (Elmes et al., 2019). Nonetheless, combining these two methods could identify a more practical pest management strategy without increasing the fieldwork labor and data input. In the current study, we illustrated a straightforward working procedure of this combinational modeling (Figs. 2 and 9). This integrated method has also been empirically applied to predict the expansion of species invasion (Elmes et al., 2019; Falaschi et al., 2018), distribution range shift of endangered mammals (Puddu and Maiorano, 2016; Zhao et al., 2019), the process of gene flow of a disease vector (Medley et al., 2015), and phylogeographic analysis (Dupas et al., 2014). These case studies identified that this combination model was available to different ecological processes.
Geographic information system (GIS) has grown in popularity in recent years, and it has realized the integration of various types of data and algorithms, providing sophisticated tools for analyzing, editing, mapping, and performing spatial queries on data (Günen, 2021a). Meanwhile, some integrated GIS-based spatial models have improved the decision support processes in many research fields, such as energy planning (Günen, 2021b), urban greening planning (Pelorosso et al., 2014), endangered animal conservation (Ahmad et al., 2020b; Ahmad et al., 2020a), and even helping to clarify the extent and impact of the COVID-19 pandemic (Franch-Pardo et al., 2020). In this paper, we proposed an integrated GIS-based modeling framework to improve research and applications focused on pest management. Three advantages were concluded as follows. Firstly, the researcher easily acquired the input data, only including the occurrence points (Fig. 1) and eco-physiological environment layers (Table 1) of the targeted pest. Secondly, the results explicitly determined the relationship between the pest and the environment of its habitat (Table S3), as well as the potential regions for pest management. These results mapped the pests' vulnerable regions for forestry managers (e.g., the suitable habitat in Fig. 4 and the pinch points and corridors in Fig. 6). Thirdly, the management effectiveness (Figs. 7 and 8) of different scenarios were reasonably quantified. Thus, customized solutions could be proposed in various pest situations (scenario B20 in Fig. 9).
We concluded that our model has great potential in designing pest management policies and strategies in other similar situations around the world. Nonetheless, this approach had some limitations, which could be eliminated in further studies. For example, the spatial autocorrelation and pseudo-replicates may decrease the results’ confidence (e.g., AUC value). Because our occurrence points were only obtained by our fieldwork at the local scale, whose spatial autocorrelation and pseudo-replicates were likely ignorable (Guisan et al., 2017), we did not examine the spatial autocorrelation in model residuals. Instead, if the occurrence points were from different sources at a large scale, the spatial autocorrelation should be detected by the Moran’s I test on the generalized linear models (Guisan et al., 2017). Additionally, our results lacked validation. In a future study, we would experimentally implement scenario B20 to validate this model.
5 Conclusions
Tree being damaged by pest is global problem, especially in metropolitan cities. To eradicate pest and manage its outbreak, it is necessary to identify suitable habitat, corridors, and cut off the migratory pathway rather than only insecticide application. Because the only chemical eradication is not only expensive, laborious but also disturb the biological control mechanism and alleviate ecosystem function. Landscape connectivity has been defined as the degree to which the landscape facilitates or impedes movement among different patches, is a critical component of ensuring healthy ecosystems.
In the current study, we proposed a spatially explicitly GIS-based modeling framework, including MaxEnt and circuit theory to identify optimal regions for insecticide application. The AUC value indicated the parsimony results of SDM. The high AUC value indicated that the quality of habitat suitability map (derived by the MaxEnt models) was high and the sampling quadrats were sufficient.
This modelling framework can minimize damage to the natural ecosystem related to the unchecked and excessive use of pesticides and decrease the risk of periodic outbreaks. These optimal locations were targeted on potentially suitable habitat and the critical migration pathways, supporting precise insecticide application to save operation costs (e.g., travel and human efforts). Furthermore, this proposed modeling framework could be rerun for different parameters and newly collected points data to apply to similar urban areas for pest management.
Author Contributions
XG, WK, and KL contributed to conception and design of the study. XG and KZ investigation and sample collection. XG, SA and WK performed the statistical analysis and wrote the first draft of the manuscript. IIS, GN, KL, LZ wrote sections of the manuscript. All authors contributed to manuscript revision, read, and approved the submitted version
CRediT authorship contribution statement
Xinle Guo: Investigation. Kunyuan Wanghe: . Shahid Ahmad: . Ghulam Nabi: . Ke Zhang: . Dengguo Lu: . Dezhong Han: . Kai Zhou: Investigation. Ivan Igorevich Strelnikov: . Tauheed Ullah Khan: . Kai Li: . Kai Zhao: .
Acknowledgements
This study was supported by the China Postdoctoral Science Foundation No. 2021M693373, the Natural Science Foundation of Qinghai province [2020-ZJ-912], National Natural Science Foundation of China under Grants [32071489], the joint foundation from Chinese Academy of Sciences-People's Government of Qinghai Province on Sanjiangyuan National Park (LHZX-2021-03), and investigation of Aquatic Biological Resources in the Aquatic Germplasm Resources Conservation Area of the Qinghai Section of the Yangtze River (No. E039831D01).
Declaration of Competing Interest
The authors declare that they have no known competing financial interests or personal relationships that could have appeared to influence the work reported in this paper.
References
- Critical assessment of Asiatic ibex (Capra ibex sibirica) for sustainable harvesting in northern areas of Pakistan. Global Ecol. Conserv.. 2020;22:e00907.
- [CrossRef] [Google Scholar]
- Using an ensemble modelling approach to predict the potential distribution of Himalayan gray goral (Naemorhedus goral bedfordi) in Pakistan. Global Ecol. Conserv.. 2020;21:e00845.
- [CrossRef] [Google Scholar]
- Aukema, J.E., McCullough, D.G., Von Holle, B., Liebhold, A.M., Britton, K., Frankel, S.J., 2010. Historical accumulation of nonindigenous forest pests in the continental United States. BioScience 60, 886–897.
- Phylogeography and ecological niche modelling of the New Zealand stick insect Clitarchus hookeri (White) support survival in multiple coastal refugia. J. Biogeogr.. 2010;37(4):682-695.
- [Google Scholar]
- Research on geographical environment unit division based on the method of natural breaks (Jenks) Int. Arch. Photogramm. Remote Sens. Spat. Inf. Sci. 2013;3:47-50.
- [Google Scholar]
- Using electric network theory to model the spread of oak processionary moth, Thaumetopoea processionea, in urban woodland patches. Landscape Ecol.. 2015;30(5):905-918.
- [Google Scholar]
- Frankliniella occidentalis (Pergande) integrated pest management programs for fruiting vegetables in Florida. Pest Manag. Sci.. 2012;68(12):1537-1545.
- [Google Scholar]
- Circuit-theory applications to connectivity science and conservation. Conserv. Biol.. 2019;33(2):239-249.
- [Google Scholar]
- An invasive urban forest pest invades natural environments—Asian longhorned beetle in northeastern US hardwood forests. Can. J. For. Res.. 2011;41:1729-1742.
- [Google Scholar]
- Collinearity: a review of methods to deal with it and a simulation study evaluating their performance. Ecography. 2013;36(1):27-46.
- [Google Scholar]
- Phylogeography in continuous space: coupling species distribution models and circuit theory to assess the effect of contiguous migration at different climatic periods on genetic differentiation in B usseola fusca (L epidoptera: N octuidae) Mol. Ecol.. 2014;23(9):2313-2325.
- [Google Scholar]
- Modeling the Potential Dispersal of Asian Longhorned Beetle Using Circuit Theory. Profess. Geograp.. 2019;71(4):580-594.
- [Google Scholar]
- ArcGIS 10.2 for Desktop. Redlands: ESRI; 2011.
- Electric circuit theory applied to alien invasions: a connectivity model predicting the Balkan frog expansion in Northern Italy. Acta Herpetol.. 2018;13:33-42.
- [Google Scholar]
- Molecular systematics of the Triplophysa robusta (Cobitoidea) complex: extensive gene flow in a depauperate lineage. Mol. Phylogenet. Evol.. 2019;132:275-283.
- [Google Scholar]
- Fernandez-Carrillo, A., Patočka, Z., Dobrovolný, L., Franco-Nieto, A., Revilla-Romero, B., 2020. Monitoring Bark Beetle Forest Damage in Central Europe. A Remote Sensing Approach Validated with Field Data. Remote Sensing 2020, Vol. 12, Page 3634 12, 3634. Doi: 10.3390/RS12213634.
- Modelling the distribution of forest pest natural enemies across invaded areas: Towards understanding the influence of climate on parasitoid establishment success. Biol. Control. 2019;132:177-188.
- [Google Scholar]
- Spatial analysis and GIS in the study of COVID-19. A review. Sci. Total Environ.. 2020;739:140033.
- [Google Scholar]
- The beet webworm Loxostege sticticalis L. (Lepidoptera, Crambidae) in the focus of agricultural entomology objectives: I. The periodicity of pest outbreaks. Entomol. Rev.. 2015;95(2):147-156.
- [CrossRef] [Google Scholar]
- Current and future distribution of the invasive oak processionary moth. Biol. Invasions. 2020;22(2):523-534.
- [Google Scholar]
- Habitat suitability and distribution models: with applications in R. Cambridge University Press; 2017.
- A comprehensive framework based on GIS-AHP for the installation of solar PV farms in Kahramanmaraş, Turkey. Renew. Energy. 2021;178:212-225.
- [CrossRef] [Google Scholar]
- Determination of the suitable sites for constructing solar photovoltaic (PV) power plants in Kayseri, Turkey using GIS-based ranking and AHP methods. Environ. Sci. Pollut. Res.. 2021;28:57232-57247.
- [CrossRef] [Google Scholar]
- Managing Invasive Populations of Asian Longhorned Beetle and Citrus Longhorned Beetle: A Worldwide Perspective. Annu. Rev. Entomol.. 2010;55(1):521-546.
- [Google Scholar]
- Multi-decade patterns of gypsy moth fluctuations in the Carpathian Mountains and options for outbreak forecasting. J. Pest. Sci.. 2016;89(2):413-425.
- [Google Scholar]
- Responses of forest insect pests to climate change: not so simple. Curr. Opin. Insect Sci.. 2019;35:103-108.
- [CrossRef] [Google Scholar]
- Mapping the potential global codling moth (Cydia pomonella L.) distribution based on a machine learning method. Sci. Rep.. 2018;8:1-8.
- [Google Scholar]
- A numerical algorithm of fuzzy reliability. Reliab. Eng. Syst. Saf.. 2003;80(3):299-307.
- [Google Scholar]
- Cost of potential emerald ash borer damage in US communities, 2009–2019. Ecol. Econ.. 2010;69(3):569-578.
- [Google Scholar]
- Using district-level occurrences in MaxEnt for predicting the invasion potential of an exotic insect pest in India. Comput. Electron. Agric.. 2014;103:55-62.
- [Google Scholar]
- Pest Vulnerability Matrix (PVM): A graphic model for assessing the interaction between tree species diversity and urban forest susceptibility to insects and diseases. Urban For. Urban Greening. 2008;7(4):291-300.
- [Google Scholar]
- Loo, J.A., 2008. Ecological impacts of non-indigenous invasive fungi as forest pathogens, in: Ecological Impacts of Non-Native Invertebrates and Fungi on Terrestrial Ecosystems. Springer, pp. 81–96.
- Predicting the potential invasive range of light brown apple moth (Epiphyas postvittana) using biologically informed and correlative species distribution models. Biol. Invasions. 2011;13(10):2409-2421.
- [Google Scholar]
- Characteristics and distribution of potential ash tree hosts for emerald ash borer. For. Ecol. Manage.. 2005;213(1-3):15-24.
- [Google Scholar]
- Prevention is better than cure: Integrating habitat suitability and invasion threat to assess global biological invasion risk by insect pests under climate change. Pest Manag. Sci.. 2021;77(10):4510-4520.
- [Google Scholar]
- Using circuit theory to model connectivity in ecology, evolution, and conservation. Ecology. 2008;89(10):2712-2724.
- [Google Scholar]
- Circuitscape user’s guide. Santa Barbara: The University of California; 2014.
- Human-aided and natural dispersal drive gene flow across the range of an invasive mosquito. Mol. Ecol.. 2015;24(2):284-295.
- [Google Scholar]
- Pests, pesticide use and alternative options in European maize production: Current status and future prospects. J. Appl. Entomol.. 2010;134(5):357-375.
- [CrossRef] [Google Scholar]
- Effects of colour vision phenotype on insect capture by a free-ranging population of white-faced capuchins, Cebus capucinus. Anim. Behav.. 2007;73(1):205-214.
- [Google Scholar]
- A practical guide to MaxEnt for modeling species’ distributions: what it does, and why inputs and settings matter. Ecography. 2013;36(10):1058-1069.
- [Google Scholar]
- Potential distribution of Bactrocera oleae and the parasitoids Fopius arisanus and Psyttalia concolor, aiming at classical biological control. Biol. Control. 2019;132:144-151.
- [Google Scholar]
- Urban trees: bridge-heads for forest pest invasions and sentinels for early detection. Biol. Invasions. 2017;19(12):3515-3526.
- [Google Scholar]
- Bio-Energy Connectivity and Ecosystem Services. An assessment by PANDORA3.0 model for land use decision making. J. Land Use, Mobil. Environ. 2014
- [Google Scholar]
- Opening the black box: an open-source release of Maxent. Ecography. 2017;40(7):887-893.
- [CrossRef] [Google Scholar]
- Maximum entropy modeling of species geographic distributions. Ecol. Model.. 2006;190(3-4):231-259.
- [Google Scholar]
- Modeling of species distributions with Maxent: New extensions and a comprehensive evaluation. Ecography. 2008;31(2):161-175.
- [CrossRef] [Google Scholar]
- Puddu, G., Maiorano, L., 2016. Combining multiple tools to provide realistic potential distributions for the mouflon in Sardinia: species distribution models, spatial pattern analysis and circuit theory. Hystrix 27.
- Forest health in a changing world: effects of globalization and climate change on forest insect and pathogen impacts. Forestry. 2016;89(3):245-252.
- [Google Scholar]
- Transpacific coalescent pathways of coconut rhinoceros beetle biotypes: Resistance to biological control catalyses resurgence of an old pest. Mol. Ecol.. 2018;27(22):4459-4474.
- [Google Scholar]
- A model to predict outbreak periods of the pest blackfly Simulium chutteri Lewis (Simuliidae, Diptera) in the Great Fish River, Eastern Cape province, South Africa. River Res. Appl.. 2008;24(2):132-147.
- [Google Scholar]
- Biogeographical patterns and determinants of invasion by forest pathogens in Europe. New Phytol.. 2013;197(1):238-250.
- [Google Scholar]
- Pruning of small fruit crops can affect habitat suitability for Drosophila suzukii. Agric. Ecosyst. Environ.. 2020;294:106860.
- [CrossRef] [Google Scholar]
- Using virtual reality environments to unveil the imageability of the city in homogenous and heterogeneous environments. Comput. Environ. Urban Syst.. 2016;58:29-38.
- [Google Scholar]
- Silverman, B.W., 2018. Density estimation: For statistics and data analysis. Density Estimation: For Statistics and Data Analysis. Doi: 10.1201/9781315140919.
- Equilibrium theory of island biogeography and ecology. Annu. Rev. Ecol. Syst.. 1974;5(1):161-182.
- [Google Scholar]
- Determinants of multiple host use by a phytophagous insect population. Evolution. 1983;37(2):389-403.
- [Google Scholar]
- Recent non-native invertebrate plant pest establishments in Great Britain: origins, pathways, and trends. Agric. For. Entomol.. 2007;9(4):307-326.
- [Google Scholar]
- Development Characteristics and Control Measures for Semiothisa cineraria Bremer & Grey. Agricult. Sci. Technol.. 2014;15:933.
- [Google Scholar]
- Multiple attractors of host–parasitoid models with integrated pest management strategies: Eradication, persistence and outbreak. Theor. Popul Biol.. 2008;73(2):181-197.
- [Google Scholar]
- Convergent evolution misled taxonomy in schizothoracine fishes (Cypriniformes: Cyprinidae) Mol. Phylogenet. Evol.. 2019;134:323-337.
- [Google Scholar]
- Climate change induces multiple risks to boreal forests and forestry in Finland: A literature review. Glob. Change Biol.. 2020;26(8):4178-4196.
- [Google Scholar]
- Synergism between payments for water-related ecosystem services, ecological restoration, and landscape connectivity within the Atlantic Forest hotspot. Trop. Conservat. Sci.. 2018;11
- [CrossRef] [Google Scholar]
- Predicting potential distribution of chestnut phylloxerid (Hemiptera: Phylloxeridae) based on GARP and Maxent ecological niche models. J. Appl. Entomol.. 2010;134(1):45-54.
- [Google Scholar]
- Spatial coincidence between mining activities and protected areas of giant panda habitat: The geographic overlaps and implications for conservation. Biol. Conserv.. 2020;247:108600.
- [CrossRef] [Google Scholar]
- Assessment of Urban Green Space Based on Bio-Energy Landscape Connectivity: A Case Study on Tongzhou District in Beijing, China. Sustainability. 2019;11(18):4943.
- [CrossRef] [Google Scholar]
- Gravity model toolbox: An automated and open-source ArcGIS tool to build and prioritize ecological corridors in urban landscapes. Global Ecol. Conserv.. 2020;22:e01012.
- [CrossRef] [Google Scholar]
- Ecological niche modeling in Maxent: the importance of model complexity and the performance of model selection criteria. Ecol. Appl.. 2011;21(2):335-342.
- [Google Scholar]
- Forecast on the fourth and fifthgeneration ovipositing amount and pupal stage of Semiothisa conerearia Bremer et Grey. Forest Pest Dis.. 1998;2:9-11.
- [Google Scholar]
- Long-term ecological data for conservation: Range change in the black-billed capercaillie (Tetrao urogalloides) in northeast China (1970s–2070s) Ecol. Evol.. 2018;8(8):3862-3870.
- [CrossRef] [Google Scholar]
- Potential Distribution Prediction of Semiothisa cinerearia in China Based on GARP Ecological Niche Model. Adv. Mater. Res. Trans. Tech. Publ. 2013:4678-4681.
- [Google Scholar]
- Climate change, grazing, and collecting accelerate habitat contraction in an endangered primate. Biol. Conserv.. 2019;231:88-97.
- [Google Scholar]
- Assessing the ecological niche and invasion potential of the Asian giant hornet. Proc. Natl. Acad. Sci.. 2020;117(40):24646-24648.
- [Google Scholar]
- Analysis of chemosensory genes in Semiothisa cinerearia reveals sex-specific contributions for type-II sex pheromone chemosensation. Genomics. 2020;112(6):3846-3855.
- [Google Scholar]
- Relevance of the equilibrium theory of island biogeography and species-area relations to conservation with a case from Amazonia. J. Biogeogr.. 1986;13(2):133.
- [CrossRef] [Google Scholar]
Appendix A
Supplementary data
Table S1: The occurrences database of Semiothisa cinerearia, Table S2: The detail results of Pearson correlation analyses among the eight environmental variables, Table S3: The relative contributions of eco-physiological variables used in the MaxEnt model for habitat suitability of Semiothisa cinerearia, Figure S1: The area under the receiver operating characteristics curve (AUC) of the MaxEnt model, Figure S2. The pest management locations of Scenario Bn (red and grey patches). The grey patches are the locations of hosts (sub-part A described in section 2.7 of the main body). The red patches are the locations of the other trees (sub-part Bn described in section 2.7 of the main body). From scenarios B20 to B100, the pest management locations are enlarging based on the range of landscape connectivity ranked by Jenks natural breaks. Supplementary data to this article can be found online at https://doi.org/10.1016/j.jksus.2022.101905.
Appendix A
Supplementary data
The following are the Supplementary data to this article:


