

Translate this page into:
Solvent role in molecular structure level (TD-DFT), topology, and molecular docking studies on liquid 2′, 4′-dichloroacetophenone
⁎Corresponding author at: Centre for Research, Department of Physics, Arignar Anna Government Arts College (Affiliated to Bharathidasan University), Musiri-621211, Tiruchirappalli, Tamilnadu, India. brevathi1965@gmail.com (B. Revathi),
⁎⁎Corresponding author at: Department of Biomedical Science, Faculty of Science, University Tunku Abdul Rahman, Jalan University, Bandar Barat, Kampar 31900, Malaysia sinouvassane@utar.edu.my (Sinouvassane Djearamane)
-
Received: ,
Accepted: ,
This article was originally published by Elsevier and was migrated to Scientific Scholar after the change of Publisher.
Abstract
The study investigated the structure, spectroscopy, and chemical reactivity of 2′,4′-dichloroacetophenone using DFT and Hartree-Fock (HF) methods. The B3LYP and LC DFT (CAM-B3LYP) methods were applied to a 6–311++G (d, p) basis set combination. The bond angles and bond lengths are appraised in depth to understand the geometrical framework. The FT-IR and FT-Raman spectra of the respective compound were analyzed within the regions of 4000–400 cm−1 respectively. The experimental spectra were compared and discussed in connection with the theoretical spectrum. The VEDA program was implemented to accomplish the vibrational assignments of all the fundamentals highlighted using the PED analysis. TD-DFT level was used to explore the essential electronic properties of LUMO and HOMO energies. To forecast reactive sites, the MEP surface was examined. NBO was computed according to the compound’s reactivity and biological requirements. The Multi-Wave Function Analyzer 3.6 was designed to examine and compare topological inquiries, specifically focusing on the LOL and ELF. The detailed investigation specifies the drug likeness and molecular docking that assisted in the prediction of the physicochemical, pharmacokinetic, and biological availability of 2′,4′-dichloroacetophenone.
Keywords
Vibrational assignments
Drug-likeness
NCI
Molecular docking, 2′,4′-dichloroacetophenone

Data availability
Data will be made available on request.
1 Introduction
Acetophenones are the most prevalent type of aromatic carbonyl and exhibit intriguing physical, chemical, and biological properties (Balan et al., 2009). Natural sources of them include chicory, beef, bananas, apples, apricots, spearmint, watermelon, cauliflower, and cheese. They can also be acquired using various synthesis techniques (Subramanian et al., 2008). Nevertheless, the acetophenone structure is used in the pharmaceutical and related industries. It's also worth noting that amino acetophenone derivatives have some level of local anesthetic activity (Huang et al., 2010). An orange-scented, colorless liquid known as acetophenone has a sweet and pungent flavor. Skin and eye irritation may result from brief, acute exposure to the acetophenone vapor. Twenty acetophenones were studied, and electronic and topological indices were used to correlate the compounds' antibacterial activity with their structural properties (GRIFFIN, 1968). Furthermore, diazonium salts with a dihydroxy acetophenone structure have anti-microbial activity (Sudarshan et al., 2024). Aside from that, substances between p-substituted acetophenone and benzoyl hydrazone have antifungal properties (Sivakumar et al., 2008). In contrast, substituted acetophenones are promoted as reagents for synthesis in certain organic processes. Acetophenone is one of the most basic aromatic ketones (Sudarshan et al., 2015). Numerous beverages and sweets with cherry flavors frequently contain it as a flavoring ingredient. Numerous plant species have been found to contain acetophenone, which is also a volatile component of honey. It has a role as a photosensitizing agent, an animal metabolite, and a xenobiotic. It is utilized in the field of medicine, and it was marketed as a hypnotic and anticonvulsant under the brand name Hypnone. The chemical formula [C8H6Cl2O] describes the structure of 2′,4′-dichloroacetophenone (24DCA) derived from benzene. It is used in the preparation of Schiff base derivatives. Chloroacetophenone is a chemical mace and is primarily used as a riot-control agent (tear gas) (Vinod P. Singh and Katiyar, 2009). It is also used in pharmaceuticals and was previously used as an alcohol denaturant. Based on a literature review; it has come to our attention that no researchers have tried any quantum chemical approaches for this molecule. A comprehensive structural and spectroscopic profile of the 24DCA molecule is the primary emphasis of the present exploration. Molecular geometrical parameters, spectroscopic techniques, reactivity descriptor investigations, and Mulliken, were performed by HF/B3LYP/CAMB3LYP techniques invoking 6–311++G (d, p) level. Computational studies were also assessed and the theoretical and experimental results were compared (Ramanan et al., 2016). Chemical stability, band gap energy, and biological presumption were studied for gas, ethanol, methanol, and dimethyl sulfoxide using HOMO-LUMO and UV–visible inquiry.
To determine the reactive sites of the molecule, the molecular electrostatic potential (MEP) surface of the molecule was activated. The NBO analysis successfully demonstrated the hyper-conjugation of different intra-molecular interactions in the molecule. To further enhance the topological examination of interatomic interactions within the ligand-enzyme pocket, non-covalent interactions (NCI) have been conducted. Furthermore, molecular docking and ADMET drug-likeness aid in the justification of intramolecular drug-receptor interactions and provide a pathway for designing new molecules. The investigation also encompassed an examination of the process and biological activity of the 24DCA compound about its antifungal (IPCV), antioxidant (2 V32), insulin inhibitor (IBCV), antiseptic (5ZEC), and antiviral (6UEI) attributes. A molecular docking study aimed at incorporating relevant proteins collected from the RCSB-protein data bank site.
2 Experimental details
A liquid sample of 2′,4′-dichloroacetophenone with a purity level of over 98–99 % was purchased from Sigma-Aldrich Chemical Company. The sample was used to record FT-IR and FT-Raman spectra, without undergoing any further purification. An Alpha II Bruker FT-IR spectrometer was used to capture FT-IR spectra in the wave number range of 4000–400 cm−1. The spectra were obtained utilizing a high-sensitivity, temperature-controlled DLaTGs detector, and the KBr pellet method. The resolution of the spectra was ± 2.0 cm−1. The FT Raman spectrum was obtained using the BRUKER RFS 100/S apparatus, which utilizes a Nd: YAG laser source operating at a constant power of 150 MW and an excitation wavelength of 1064 nm. The spectrum was recorded at room temperature to measure Raman scattering. The spectrum measurements included a range of 4000–400 cm−1, and the reported wave number is expected to have an accuracy within 1 cm−1.
3 Details of computations
The Gaussian 09 W software package was adopted to accomplish structural optimizations, energy, and vibrational frequency computations on the aforementioned compound leveraging the HF/B3LYP/CAM-B3LYP/6–311++G (d, p) basis set to characterize the molecular framework, electronic, and other properties (Frisch et al., 2009). Utilizing VEDA 4 software potential energy distribution calculations were used to interpret the theoretical vibrational wave number. Gauss View 5.0 was employed by scrutinizes like FMO (Frontier molecular orbital), NBO (Natural bond orbital), & MEP (Molecular electrostatic potential),and a variety of polar solvents, such as CH3OH (protic), ethanol, and DMSO (aprotic), deployed in UV–vis absorption measurements (N. Elangovan et al., 2024a). The topological traits of LOL (Localized orbital locator) and ELF (Electron localization function)were done with the aid of a Multiwfn software package and plotted by a visual molecular dynamics program (Lu and Chen, 2012). To ascertain the characteristics of drug-likeness, the Swiss ADME package was used. Furthermore, the Auto Dock 4.2 program was implemented to explore the biological roles of the molecule (Goodsell et al., 2021). The molecular graphics software PYMOL and Discovery Studio have been deployed to portray the protein–ligand combination.
4 Results and discussion
4.1 Structural properties
The optimization of geometrical parameters are notably indispensable step in quantum chemical calculations. The structure after optimizing 2′, 4′-dichloroacetophenone in addition to the atom numbering is portrayed in Fig. S1. The HF/B3LYP/CAM-B3LYP /6–311++G (d, p) methods were deployed to optimize the system. The optimized geometric parameters for the named chemical are shown in Table S1, along with their correlation to the experimental XRD data (Demircioğlu et al., 2015). The studied compound includes two ‘Cl’ and one ‘C = O’ group with a benzene ring, along with the theoretical value we can figure out that the measured value of the bond length is marginally lower than the optimized value. The reason for the inclusion of isolated molecule theoretical computations in the gaseous phase is noteworthy. Simultaneously, the experimental outcome is a constituent of the solid-state molecule. The vibrational frequencies were measured primarily based on calculated geometrical parameters and it’ll be a good approximation for the calculation of the above parameters. As an effect of the electronegative substituent on the benzene ring little distortion seems within the benzene ring and the angle is barely out of perfect hexagonal structures. Evaluating bond angles and bond length reckoned leveraging the B3LYP is better than HF and well correlates with the experimental value (Elkaeed et al., 2022). As a result of the hydrogen atoms being substituted with chlorine, oxygen, and CH3 groups, the phenyl rings are marginally deformed and deviate slightly from their hexagonal shape. For the benzene ring, the reckoned CC bond spacing ranges from 1.405 Å to 1.379. The HF approach yielded the smallest CC bond length of 1.379 Å, whereas the prolonged CC bond length measured 1.514 Å by DFT. In the most extreme cases, they differ by 0.1 Å within the same method of calculation. The C-Cl bond lengths vary between 1.760 Å to 1.739 Å, and when the observed values exhibit a strong concurrence with the values measured 1.736 Å & 1.732 Å (Abozeed et al., 2022). The estimation of this bond length is observed to be overestimated in the DFT approaches, while it is diminished in the HF method.
The C–H bond lengths of aromatic benzene rings and methyl groups were reckoned in the present work ranging from 1.072 Å to 1.093 Å. However, the experimental values had been stated as 1.082, 0.930, 1.090 Å, and 1.000, 0.860, and 0.910 Å respectively. The C = O bonds have respective lengths of 1.189, 1.215, and 1.209 Å. The arrangement of bond angles makes it evident that the phenyl ring is asymmetrical. C2-C1-C12 < C1-C6-C5 < C1-C12-C14 < C3-C4-C5 < C1-C2-C3 < C2-C3-C4. As a result of the substitution of Cl and CH3 At 117.5,121.6,121.1° for HF 117.0,121.7, 121.1° for B3LYP, and 117.3,121.5,121.0° for CAM- B3LYP. The calculated bond angles that differ from experimental values are 116.7, 122.3, and 120.5°.
4.2 Vibrational spectral analysis
In organic chemistry, vibrational spectroscopy is frequently used to analyze to identify functional groups in organic compounds, as well as to investigate molecular confirmations, kinetics, and reaction mechanisms. The 2′, 4′-dichloroacetophenone is composed of 17 atoms and has the molecular formula C8H6Cl2O. It has 45 normal vibrational modes, including stretching, bending, torsion, and a few mixed vibrations, and it is symmetrical in the Cs point group, classified into 29A′ and 16A″ species (Jeyavijayan, 2015a). The in-plane and out-of-plane vibrations are denoted by the A′ and A′′ species, respectively. The reckoned frequencies, PED, and complete vibration assignments of 24DCA are documented in Table 2. The present research effort primarily aims to figure out the correct experimental wave number by comparing it to theoretically scaled wave numbers with PED adopting the aforementioned methodologies, along with the aid of normal mode studies (N. Elangovan et al., 2021b). According to the findings, the DFT values tend to exhibit less variation than HF values. Figs. 1 & 2 exhibit the correlation graph of the reported and predicted FT-IR and FT-Raman vibrational frequencies providing visual comparison.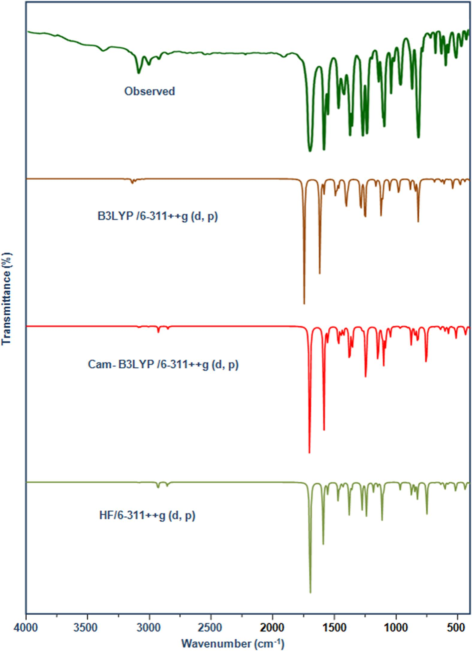
Observed and Calculated FTIR spectrum of 24DCA.
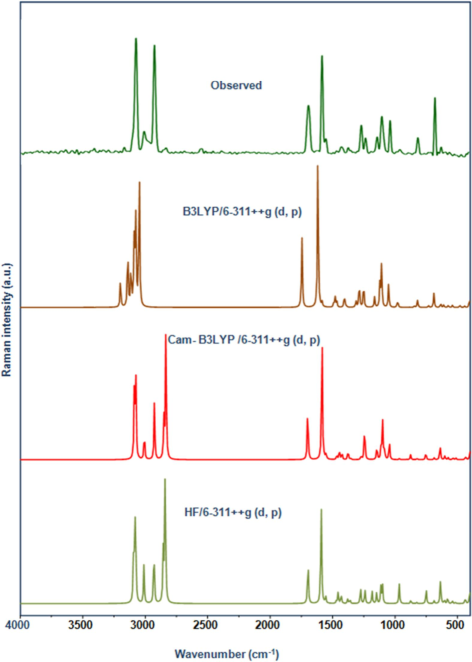
Observed and Calculated FT-Raman spectrum of 24DCA.
4.2.1 Carbon −Hydrogen vibration
In heteroaromatic substances, C–H stretching is often detected in the 3100–3000 cm−1 wavelength range. This region is renowned for its rapidity in detecting such vibrations. The nature of the substituent group interaction has an impact on the region that can be used to identify the C–H stretching vibration (Sundaraganesan et al., 2006). The Trifluoromethyl compound was studied by Balachandran et al., who observed the υ(C–H) modes, in both spectra, with bands spanning 3075/3047 & 3090/3020 cm−1. Within the research, the bands are seen in the recorded IR & Raman bands located at 3087/ 3004 & 3073/ 3007 cm−1, While stretching modes were envisioned at 3090, 3077, 3010, 3088, 3075, 3005, 3086, 3074, and 3006 cm−1, respectively. The bands appeared with medium and weak intensities except for one band in FT-Raman and the expected region and contributing 98 % of PED. The vibration mode numbers of 1, 2, and 3 are also supported by experimental data and aforementioned works of literature. The bands arising from δ(C–H) mode linked to υ(C–C) mode are seen as an array of spectra in the range 1465–1281 cm−1. In this compound, the above vibrations are seen in the region at 1465, 1372, 1235 cm-1 (IR), and 1375, 1237 cm−1(Raman), respectively. The corresponding computed values, which show good correlation with experimental data, reckoned theoretically at 1468, 1378, 1240 1465, 1374, 1237, 1466, 1375, 1242 cm−1 (Mode nos: 10, 13, and 16). The aromatic C–H out-of-plane bending mode appears in the range of 900–667 cm−1, and it is calculated theoretically, can be seen in the following configuration: 750, 635, 515 751, 630, 510,752, 638, 512 cm−1. Similarly, the experimental peaks at 511 and 632 cm-1 are correspondingly identified. All calculated wave numbers are well consistent with those obtained through experimentation and are figured in Table 1. The relative intensities of the experiments are abbreviated as follows:υ-stretching;δ-in-planebending;γ-out-of-planebending;r-rocking;τ-tortion;ipr-In-plane-rocking;opr-out-of-plane rocking:ipb-In-plane bending:opb-out-of-plane bending subscript; ss-symmetric stretching: ass-asymmetric stretching.
ModeNo.
Symmetry
Spices
Observed frequencies
cm−1
Calculated frequencies
cm−1
Vibrational
Assignments
%PED
FT-IR
FT-Raman
HF
6–11++G(d,p)
B3LYP
6–311++G (d,p)
CAM-B3LYP
6–311++G(d,p)
1.
A'
3087
3090
3088
3086
υCH(98)
2
A'
3073
3077
3075
3074
υCH(98)
3
A'
3004
3007
3010
3005
3006
υCH(98)
4
A''
2924
2925
2929
2925
2925
υassCH3(97)
5
A''
2850
2854
2851
2850
υassCH3(97)
6
A'
2833
2839
2834
2833
υssCH3(98)
7
A'
1697
1693
1696
1695
1698
υCO(72),δCC(17)
8
A'
1584
1585
1590
1584
1588
υCC(75),δCH(15)
9
A'
1552
1555
1550
1552
υCC(75),δCH(14)
10
A'
1465
1468
1465
1466
δCH(72,) υCC(10),
11
A'
1446
1454
1450
1445
δopbCH3(78)
12
A'
1422
1430
1430
1425
1423
δipbCH3(72)
13
A'
1372
1375
1378
1374
1375
δCH(68),υcc(12)
14
A'
1356
1360
1356
1354
δsbCH3(72)
15
A'
1268
1270
1275
1269
1270
υCC(70),δCCl(21)
16
A'
1235
1237
1240
1237
1242
δCH(68,) υCC(12),δCO(10)
17
A'
1139
1144
1146
1142
1145
υCC(65),δCH(14)
18
A'
1106
1112
1110
1110
δCO(68)
19
A'
1094
1099
1095
1098
υCC(71),δCH(12)
20
A'
1079
1083
1080
1082
δoprCH3 (63), υCCl(14)
21
A'
1040
1047
1042
1045
δiprCH3(68)
22
A'
962
963
965
962
963
υCC(70),δring(16)
23
A''
900
906
901
904
γCO(66)
24
A'
869
872
870
874
υCC(68)
25
A'
845
843
843
υCCl(66)
26
A'
817
825
820
822
υCCl(68)
27
A''
750
751
752
γCH(63)
28
A'
679
682
686
682
685
υCC(59),δCH(12)
29
A''
632
635
630
638
γCH(68)
30
A'
596
600
604
599
600
δCC(58,) δCO(17),
31
A'
575
567
578
570
574
δCC(55,)
32
A'
533
540
536
535
δCCl(56,)
33
A''
511
515
510
512
γCH(59)
34
A'
433
440
435
436
δCCl(55)
35
A''
429
434
428
430
γCCl(58)
36
A''
401
397
400
γCCl(52)
37
A''
327
320
322
γCC(53)
38
A'
298
292
295
δring(59)
39
A''
250
241
245
γCC(55),γCCl(12)
40
A''
210
207
208
τCH3(48)
41
A''
184
180
182
γring(48)
42
A''
175
169
171
γring(48)
43
A''
161
155
160
γring(48)
44
A''
80
75
78
γring(48)
45
A''
47
40
45
γring(45)
Solvent
Energy cm−1
Wavelength (nm)
Oscillator Strength
Energy (eV)
Symmetry
Major Contributions
Gas
22014.90
454.23
0.0001
2.7292
Singlet-A
H->L (96%)
34071.27
293.50
0.047
4.2238
Singlet-A
H-3->L (12%),H-2->L(60%),H-1->L (19%)
34701.19
288.17
0.052
4.3019
Singlet-A
H-3->L (76%), H-1->L (19%)
Ethanol
23960.31
417.35
0.0002
2.9703
Singlet-A
H->L (91%)
32446.07
308.20
0.0076
4.0223
Singlet-A
H-2->L (57%), H-1->L (27%)
33057.44
302.50
0.0585
4.0981
Singlet-A
H-3->L (78%), H-1->L (20%)
Methanol
23987.74
416.73
0.0002
2.9737
Singlet-A
H->L (90%)
32438.01
308.28
0.0764
4.0213
Singlet-A
H-2->L (57%), H-1->L (27%)
33042.12
307.12
0.0551
4.0962
Singlet-A
H-3->L (78%), H-1->L (20%)
DMSO
23995.80
416.73
0.0002
2.9747
Singlet-A
H->L (90%)
32437.20
308.28
0.076
4.0212
Singlet-A
H-2->L (57%), H-1->L (26%)
33034.86
302.50
0.0573
4.0953
Singlet-A
H-3->L (78%), H-1->L (20%)
4.2.2 Methyl group vibrations
The vibrations of methyl groups are often associated with substituents that contribute electrons in aromatic chains. The inclusion of a CH3 group in a compound entails the generation of one symmetric stretching vibration and two asymmetric stretching vibrations, and usually, asymmetric stretching vibrations are recorded at higher frequencies than those of the symmetric mode. In general, CH3 exhibits asymmetric and symmetric stretching vibrations with wavenumbers of 2962 and 2872 cm−1, respectively. The robust band at 2862 cm−1 was attributed to the CH3 symmetric stretching vibration of 5-chloro-2-hydroxyacetophenone. The weak to medium bands observed at 2850/2924 cm−1 (IR) and a very sturdy peak found at (Raman) at 2925 cm−1 shows asymmetric stretching vibrations of CH3 whereas a faint band observed at 2833 cm−1 (Raman) assignable to symmetric stretching mode. These assignments found support from the calculation followed by Gaussian showed the peaks at υassCH3 = 2929, 2854, 2925, 2851, 2925 &2850 cm−1 respectively, with mode nos; 4 and 5 having considerable PED values of 97 %. The υssCH3 is reckoned at 2839, 2834, and 2833 cm−1(mode no; 6), nearly 98 % of PED impacts are confirmed, and its corresponding counterpart couldn’t be detected in the FT-IR spectrum. The CH3 deformation is expected in the region 1485 − 1400 cm−1. The molecule in question, the medium and weak in-plane bending methyl deformation modes CH3δipb observed at 1422/1430 cm−1 in both spectra line up with the reckoned values at 1430,1425, and1423 (mode no;12) with PED 72 %. Thus, the band observed (calculated) at 1446 (1454, 1450, 1445 cm−1) ascribed to out-of-plane bending vibration. These two bending are quite similar in the assigned values during the experiment and computations. The computational data for symmetrical methyl deformation modes CH3sb was obtained at 1360, 1356, and 1354 cm−1 with PED 72 % (mode no; 14). Theoretical calculations using the B3LYP method at 1356 cm−1 are perfectly in line with measured values of 1356 cm−1 in the FT-IR spectrum. The methyl rocking vibration bands are typically seen in the vicinity of 1045 and 970 cm−1, respectively, in aromatic compounds. The methyl group rocking vibrations of the compound under consideration are spotted at 1040 & 1079 experimentally, agree with the theoretical computations at δipr = 1047, 1042, 1045 cm−1(mode: no21) and δopr = 1083, 1080, 1082 cm−1(mode no: 20) with PED 68 & 63 % respectively.
4.2.3 Carbon-Chlorine vibrations
The C-Cl stretching mode furnishes typically sturdy bands at 765–505 cm−1. Compounds comprising multiple chlorine atoms exhibit exceptionally vivid bands as a result of the asymmetric and symmetric stretching modes. Additionally, there's a possibility that vibrational interaction with other groups might intensify an absorption shift to 840 cm−1. In this study, mode no:(25,26) is ascribed to υ=(C-Cl) stretching vibrations in a strong band at 817 cm−1 (IR) band, and these outcomes obtained match precisely with the experimental data of 812, 800 & 800 (Nickless et al., 2016). Experimentally, the CCl stretching mode did not exhibit a Raman spectrum, and its matched harmonic wave numbers at ʋ(C-Cl) of 845,843,843,825, 820, 822 cm−1 respectively, it has notable PED values such as 66 %, 68 %, respectively. In the current exploration, the weak bands reported at δ(C-Cl) = 533,433 cm−1(Raman), and the reckoned values lies in the range δ(C-Cl) of 540–436 cm−1, (mode nos: 32 & 34) respectively. With adequate PED and substantiated by experimental data of 429 cm−1(IR) and their related harmonic frequencies are; 434–400 cm−1 with a PED contribution of 58 % showed the γ (C-Cl) vibrations.
4.2.4 Carbon = Oxygen vibrations
The frequencies of carbonyl stretching exhibit a strong sensitivity to stimuli that influence the characteristics of the carbonyl group. Their specific frequency is distinctive to the particular type of carbonyl molecule that is under scrutiny. The frequency of carbonyl bond stretching has been the subject of particularly through correlations. Conjugation may enhance the strength of these bands, offering assistance in both the detection of Raman lines and the rising infrared band intensities. Since the aforementioned group is extremely polar (C+=O-), It typically generates a prominent infrared absorption spectrum. Typically, the carbonyl C = O absorption contributes significantly to the spectra which are most prominent between 1800 and 1690 cm−1. A very prominent infrared band linked to the υ(C = O) vibration of 2′, 4′ dibromo acetophenone, was observed at 1692 cm−1 in IR and the calculated value is 1693 cm−1 an intense peak observed at υ(C = O) at 1695 cm−1(IR) and 1693 cm−1 (Raman) a theoretically predicted frequency at 1694 cm−1 is assigned to this mode, respectively (Jeyavijayan, 2015b). In the current study, it has been demonstrated that the (C = O) stretching frequencies display notable bands in 24DCA. These bands appear to have a significant impact on the projected frequencies of mode number 7, specifically at 1696, 1695, and 1698 cm−1, respectively. The IR spectra of the compounds exhibited an intense absorption peak measured at 1697&1693 cm−1 (Raman) as a medium band, being over 72 % of the total, as can be seen in the PED column. The observed picture in this υ(C = O) spectral range is quite similar to those predicted in the cited literature. The FT-Raman spectrum of a molecule showed the C = O group's in-plane and out-of-plane bending vibrational modes at 1106 cm-1 and 900 cm-1 respectively. A tight agreement is seen between the reckoned value and the measured frequencies. This C = O molecule was unaffected by other vibrational modes, as the PED contribution of the vibration is 66 and 68 correspondingly.
4.2.5 C–C vibrations
The aromatic ring's ring stretching vibrations are quite distinctive, so they play an important part in the benzene and derivative spectrum. The substitution of aromatic rings in benzene derivatives has a consequence on the many ring vibrations. The six carbon atoms in each ring experience coupled vibrations known as skeletal vibrations. Ring stretching vibrations, notably C–C and C = C vibrations, which are alternatively referred to as semi-circle stretching vibrations, generate distinct bands in the infrared and Raman spectra, covering the spectrum of 1430–1650 cm−1. Substitution of the aromatic ring changes most of the ring modes. The specific location of these modes is more influenced by the substitution pattern around the ring system rather than the nature of the substituent. The frequency is undoubtedly diminished by the heavy halogens. (Bhat and Ahmad, 2016). The band with different intensities explored here was found to match with 1584, 1552, 1268,1139, 1094, 962, 869, and 679 cm−1/FT-IR, and the same type of bands were noted at 1585, 1270, 1144, 963 and 682 cm−1/ FT-Raman spectrum and they were appointed to CC stretching vibrations. Theoretical calculations indicate that the C–C stretching vibrations account for 75 %, 75 %, 70 % 65 % 71 % 70 %, and 68 % 59 %, respectively. The spectral bands at 1590, 1588, 1584, 1555, 1552, 1550, 1275, 1270, 1269, 1146, 1145, 1142, 1099, 1098, 1095,965, 963, 962, 874, 872, 686, 685, 682 cm−1 are reported. The observed data and all calculated frequencies line up perfectly. The benzene ring's out-of-plane and in-plane bending vibrations are noticed below 1002 cm−1. In this instant study, the ring out-of-plane and in-plane and bending modes are affected to a great extent by the substituents and produce medium to weak bands at 596/575 cm−1 (IR) and weak bands at 600/ 567 cm−1 (Raman) ascribe to C–C in-plane bending and corresponding theoretically fitted band at 604–574 cm-1for 24DCA. The scaled theoretical wave number corresponding to in-plane bending vibrations goes well with their available Experimental observations. Additionally, C–C out-of-plane bending modes computed at 327, 322, 320, 250, 245, and 241 cm−1 with PED contribution accounting for 53 % & 55 %. The (δring) and (βring) bending modes in the titled molecule are greatly affected by the substituent and theoretically produce bands at 298–45 cm−1, not been found experimentally.
4.3 Frontier molecular orbital analysis
The energy of the atomic orbital and atomic contribution coefficients constitute significant in articulating the reactivity of molecular properties. The orbitals have an enormous effect on the overall molecular behavior. Molecular orbital offers essential perspectives into the bonding and other chemical properties of molecules. HOMO serves as the orbital responsible for supplying electrons, whereas LUMO, which occupies a lower energy level, operates as the orbital responsible for receiving electrons termed as Frontier molecular orbital. It has the potential to function as a as a straightforward indicator of kinetic stability. Both possess the ability to absorb and release electrons. These specific orbitals allow the molecule to have its strongest interactions with itself (Diya et al., 2023). The ligand s' optimized structure was employed to figure out the electron cloud shapes and electronic transition energies of the substance, the graphical representation of the FMOs depicts the outcomes of the calculation done in this work on gas, Dimethyl sulfoxide, ethanol, and methanol solvents respectively, also depicted in Fig. 3. The green and red regions respectively represent negative and positive charges. The primary focus of the current investigation on the 24DCA compound is on the HOMO charge distribution, with particular emphasis on the chlorine & hydrogen atoms throughout the whole ring system. By contrast the dislocation of the LUMO-π nature, specifically the benzene ring, across all C–C bonds, is symbolized by the HOMO → LUMO transition. This transition proposes an electron distribution movement from the chlorine atom to the C–C bond of the benzene ring and the CO-CH3 group. The determination of the compound's transition energy from HOMO → LUMO with the shortest to the highest energy gap: 4.458 eV (ethanol), 4.461 (methanol), 4.464 (DMSO), 4.467 (water), 4.546 (Gas). As the header compound's gas phase had a wide energy gap, we may infer that the molecule was more stable than compared to other solvents with chemical harness 2.273. Water was discovered to have the greatest chemical hardness (2.233) among all solvents. The header molecule has a softness index of 0.439 (Gas), 0.447 (methanol), 0.430 (DMSO), 0.447 (water), and 0.449 (ethanol) which means that the molecule under exploration possessed non-toxic traits. The 24DCA complex exhibits higher Electronegativity (χ) values across all phases 5.212 for gas, 5.182 for water, 5.179 for DMSO, 5.174 for ethanol, and 5.177 for methanol, indicating that the screened molecules function as Lewis’s acids (Elangovan and Sowrirajan, 2021). Having higher electron-accepting indices (ω+) in the water phase seems to be linked to a better ability to handle electron density. Moreover, the ability to donate electrons (ω−) in the water phase was higher (8.882) compared to other solvent phases. The reckoned global reactivity parameters are documented in Table S2.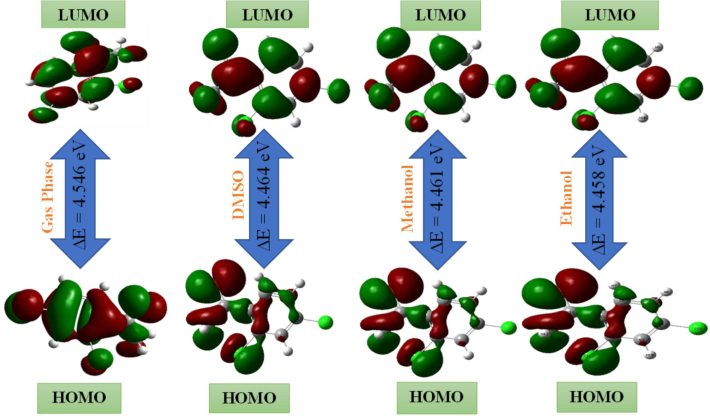
FMO surface map of 24DCA.
4.4 UV spectral analysis
U-V visible spectra were examined in different solvents to study solvent effects on electronic transitions. The most precise theoretical approach to evaluating the dynamic and static properties of excited-state molecules is the Time-dependent density-functional theory (TD-DFT) method. For the compounds under study, the TD-DFT method was used to determine the peak absorption wavelength (λmax), excitation energies (E), oscillator strength (f), energy gap (eV), and molecular orbital contribution. The spectral data of the selected solvents are being studied by UV–visible spectra, to assess the impact of solvents in transitions (N Elangovan et al., 2024c). The correlated spectrum and data are explored in Fig 4 and Table 2. The fact that the projected maximum values for different solvents are practically equal suggests that the solvent influences the compound's optical activity. The maximum absorption peak of the experimental UV–visible absorption in ethanol was measured at 282 nm. Theoretical spectra have been performed in the gas phase and several polar solvents, such as DMSO (aprotic), C2H6O, and CH3OH (protic). The highest possible absorption values are 288.17 nm and 4.3019 eV with an oscillator strength of 0.052 in the gas phase, 302.50 nm and 4.0981 eV in ethanol, 308.28 nm and 4.0213 eV in methanol & DMSO, all with the same oscillator strength of 0.076. Moreover, the highest transition efficiency observed for HOMO-3 > LUMO was 78 % across all solvents (Rajimon et al., 2023). These outcomes and predictions lend evidence for selecting the molecule as a highly energetic and stable chemical for biological purposes.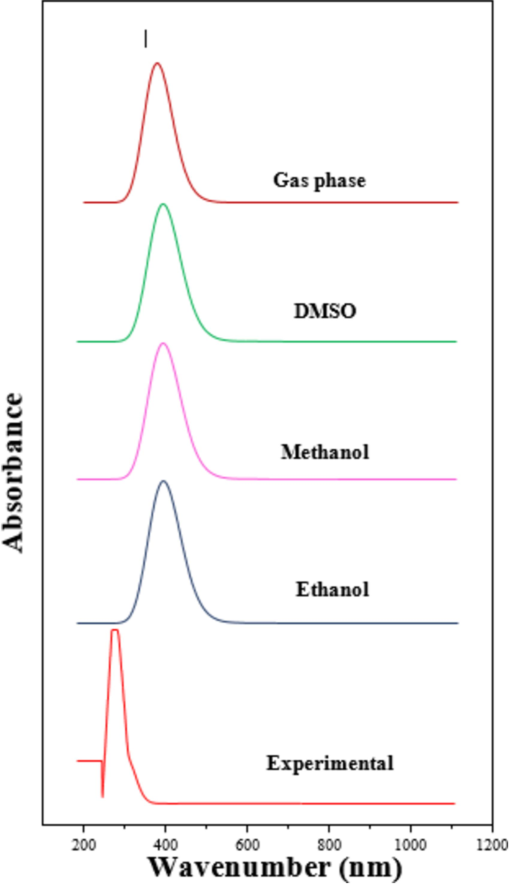
Experimental and Theoretical UV– Vis spectral analysis of 24DCA.
4.5 Molecular electrostatic potential
MEP investigation is an efficacious descriptor to forecast the nucleophilic and electrophilic attack for 2′, 4′-dichloroacetophenone by the aforementioned approaches to scrutinize the chemical reactivity of the molecules, to explore the correlations among a chemical configuration along with its physiochemical characteristics, MEP projection is extremely helpful (Elangovan et al., 2022). The role of molecular electrostatic potential surfaces in computer-aided drug design is noteworthy, by aiding in the optimization of the ligand–protein electrostatic interactions. Fig. 5 illustrates, a graphical depiction of the compound under investigation. With the use of color coding, this surface provides reaction point knowledge. Distinct color tones have denoted the surface electrostatic potential values of the MEP map. The strongest attraction is betrayed by blue color and red bespeaks strongest repulsion. Conventionally, negative potential sites are linked to the lone pair of electronegative atoms. The color scheme of the map in our compound is in the vicinity of 4.541e-2 (deepest red) to 4.541e-2 (deepest blue). The majority of the negative potential sites are centered on the electronegative oxygen atoms of the CO-CH3 group, according to the MEP sketch of the compound in issue (Priya et al., 2023b). Electrophilic attack sites are possible in the darkest red zone exposed around the O atom. In contrast, the H atoms inside the benzene rings are covered by positive potential. The blue color examines the available sites for nucleophilic attack on the benzene ring. The leftover spices are embraced by zero potential, which is highlighted in green color.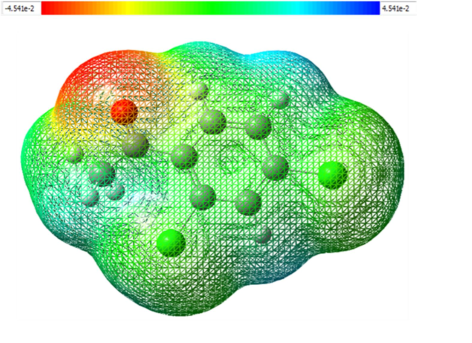
Calculated 3D Molecular electrostatic potential contour map of 24DCA.
4.6 Mulliken atomic charges
The charge distribution of the chemical in question is depicted in Table S3. Mulliken atomic charge distribution of 24DCA, computed by the above-mentioned methodologies is portrayed in Fig. S2. The Mulliken population provides information regarding Mulliken charges and makes it possible to assess partial atomic charges from the calculation accomplished by the computational chemistry method. The title compound under investigation has a total of 17 atoms in its chemical structure. Eight carbon atoms are present together with six hydrogen atoms, two chlorine atoms, and one oxygen atom. Carbon atoms together with negative values are dominant in C2, C3, C5, C12, and C14 owing to hydrogen and oxygen coupling. The residual carbon atoms C1, C4, and C6 are positive as a result of the re-distribution prompted by the attachment of CO-CH3 and chlorine groups (N. Elangovan et al., 2021c). The utmost negative charge values of about −1.682e in the C2 atom and approximately 0.802e is the greatest positive charge of C1 in the molecule at the HF level. According to Mulliken’s atomic charges, all of the hydrogen atoms connected with benzene rings have net positive charges, At the contrary, due to their proximity to the chlorine atom, H10 atoms possess a higher positive charge than the remaining hydrogen atoms. With an atomic charge value of 0.287e (HF). All electronegative (oxygen atoms maintain a negative charge), all electropositive (hydrogen atoms maintain a positive charge), and depending on position, carbon atoms can maintain either a negative (or positive) charge.
4.7 Donor-Acceptor interaction
Understanding inter- and intramolecular bonding interactions is critical to exploring charge transfer or hyperconjugation interactions inside a molecular system. The investigation of the Natural Bond Orbital (NBO) indicates strong charge-transfer interactions in the isolated gas-phase molecule of 24DCA. In this work, the investigation focused on a variety of donor–acceptor bond interactions, outlined in Table 3. Higher E (2) values propose stronger interactions between electron providers and electron recipients, implying a greater degree of electron coupling delocalization across the system. The table lists the stabilization interaction energies of 2′, 4′-dichloroacetophenone above 5 kcal/mol. The natural bond orbital computations were carried out at the B3LYP6-311++G (d, p) level (Geethapriya et al., 2023). Regarding the head molecule, The BD*(2) electron's delocalization from distributed anti-bonding to anti-bonding demonstrates high stabilization Energy of 157.48 kcal/mol for BD*(2) C1-C2
BD*(2) C5-C6 which could be a cause of the title molecule's biologically active behavior (Elangovan and Arumugam, 2024). A higher stabilization energy value is also achieved for the interaction between BD*(2) C3-C4
BD*(2) C5-C6 = 106.72 kcal/mol, BD*(2) C12-O13
BD*(2) C1-C2 = 48.27 kcal/mol, BD (2) C5-C6
BD*(2) C3-C4 = 23.27 kcal/mol and BD (2) C5-C6
BD*(2) C1-C2 = 21.11 kcal/mol. Besides that, the stabilization interaction occurs between lone pair LP (2) of O13
BD*(1) C12-C14 and LP (2) of O13
BD*(1) C1-C12, it is the order of 8.65 and 9.87 kcal/mol respectively. Meanwhile, the stabilization interaction energy value of the corresponding interaction between the lone pair of chlorine, LP (3) Cl9, and the BD*(2) C3-C4 orbital was calculated to be 13.36 kcal/mol, and between LP (3) Cl (11) and the BD*(1) C14-H16 orbital to produce a stabilization interaction amounting to 18.06 kcal/mol and these values are spotted in Table 3. These interactions cause the lone pair orbital occupancy to significantly decrease compared to occupancy, and there is a chance of hyperconjugation between chlorine, oxygen atoms, and the aromatic ring.
Donar(i)
Type
ED/e
Acceptor
Type
ED/e
E(2)
E(j)-E(i)
F(i,j)
BD (1)
C1 − C2
1.97413
BD*(1)
C1 − C6
0.02184
4.39
1.30
0.068
BD (2)
C1 − C2
1.655
BD*(2)
C3 − C4
0.37841
19.74
0.28
0.067
BD (2)
C1 − C2
1.655
BD*(2)
C5 − C6
0.27085
17.63
0.31
0.067
BD (2)
C1 − C2
1.655
BD*(2)
C12 − O13
0.16566
16.87
0.25
0.061
BD (1)
C1 − C6
1.96625
BD*(1)
C1 − C2
0.03617
5.14
1.26
0.072
BD (1)
C1 − C6
1.96625
BD*(1)
C2 −Cl11
0.03366
4.87
0.84
0.057
BD (1)
C2 − C3
1.97304
BD*(1)
C1 − C2
0.03617
4.10
1.29
0.065
BD (1)
C2 − C3
1.97304
BD*(1)
C4 −Cl9
0.02893
4.11
0.88
0.054
BD (1)
C3 − C4
1.97323
BD*(1)
C2 −Cl11
0.03366
4.40
0.86
0.055
BD (2)
C3 − C4
1.66446
BD*(2)
C1 − C2
0.43953
19.04
0.28
0.067
BD (2)
C3 − C4
1.66446
BD*(2)
C5 − C6
0.03366
16.72
0.31
0.065
BD (1)
C5 − C6
1.97121
BD*(1)
C4 −Cl9
0.02893
4.97
0.84
0.058
BD (2)
C5 − C6
1.64579
BD*(2)
C1 − C2
0.43953
21.11
0.26
0.068
BD (2)
C5 − C6
1.64579
BD*(2)
C3 − C4
0.37841
23.27
0.26
0.070
BD (1)
C 5 − H8
1.97867
BD*(1)
C3 − C4
0.02893
4.26
1.06
0.060
BD (1)
C6 − H7
1.97534
BD*(1)
C1 − C2
0.03617
4.48
1.06
0.062
BD(2)
C12 – 13
1.96782
BD*(2)
C1 − C2
0.43953
5.68
0.30
0.042
BD (1)
C14 − H17
1.95977
BD*(2)
C12 − O13
0.16566
6.41
0.47
0.051
LP (3)
Cl 9
1.99992
BD*(2)
C3 − C4
0.37841
13.36
0.32
0.063
LP (2)
Cl 11
1.99968
BD*(1)
C14 − H16
0.03073
6.07
0.81
0.063
LP (3)
Cl 11
1.99996
BD*(2)
C1 − C2
0.43953
8.71
0.35
0.054
LP (3)
Cl11
1.99996
BD*(1)
C14 − H16
0.03073
18.06
0.80
0.109
LP (2)
O13
1.93429
BD*(1)
C1 − C12
0.0554
9.87
0.62
0.070
LP (2)
O13
1.93429
BD*(1)
C12- C14
0.03073
8.65
0.60
0.065
BD*(2)
C1 − C2
0.43953
BD*(2)
C5 − C6
0.27085
157.48
0.02
0.085
BD*(2)
C3 −C4
0.37841
BD*(2)
C5 − C6
0.27085
106.72
0.02
0.079
BD*(2)
C12 − O13
0.16566
BD*(2)
C1 − C2
0.43953
48.27
0.04
0.068
4.8 Non-covalent interaction (NCI)
Investigated reduced density gradient (RDG), a method that provides an approachable graphical representation of different forms of non-covalent interactions in three dimensions. Weak interactions known as non-covalent interactions are key, arising from the quantum electron density and its first derivatives in real space (Mallika et al., 2024). A basic dimensionless variable, the electron density value in a decreased density gradient may be used to ascertain the intensity of an interaction; and it is transcribed by
where the electron density has been betokened by the symbol ρ (r), and the norm of the electron density vector is bespeak by
. The highest value of the lessian matrix of electron density, sign (λ 2), aids in determining the type of interaction by color coding. The λ sign was deployed to differentiate between bonded (λ < 0) and non-bonded (λ > o) interactions. Fig. 6 displays the predicted RDG plot for the aforementioned molecule, Through the use of multiwfn and the visual molecular dynamics (VMD) program (Sowrirajan et al., 2022a). Areas of weak attractiveness are rendered in green on this graph, (λ
0) like Van der Waals interactions, while the blue regions correspond to strongly attractive interactions like H bonds and C-Cl bonds. The steric effect is depicted by the color red. The left side of the figure's negative sign λp values (green in color) shows attractive interactions with the other molecule. While the right side of the figure's (red) positive sign λ p-value indicates a strong repulsive interaction. Fig. 6 clearly demonstrate that the isosurface of RDG for the header compound is more affected by strong Van der Wall interactions when it is close to the methyl group, which is indicated by a greenish-brown isosurface, which denotes a low electron density in the area. A pronounced steric effect is manifested in red fusiform areas that existed in the middle zones of the phenyl ring, encircling the C = O bond, and within a ring-like configuration connecting Cl9 and Cl11.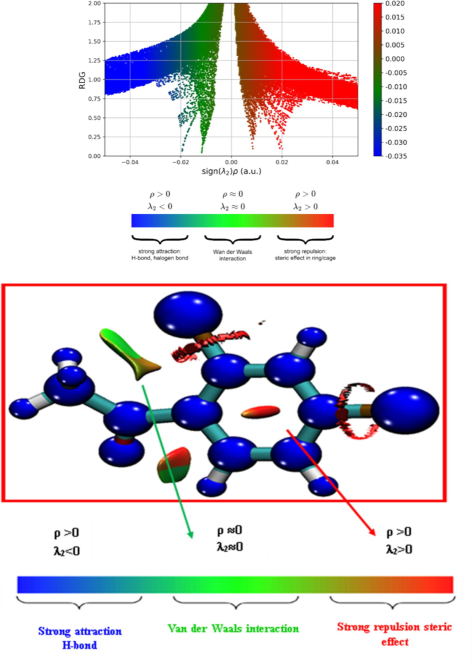
NCI analysis of 24DCA.
4.8.1 ELF and LOL study
In chemical bonding, the electron localization function ELF, symbolized by τ(r), provides a density-based description. and the localized orbital locator symbolized by η(r) are studies that primarily express the surface of a topological analysis, carried out using the multifrequency wave function (multiwfn) program. Their color shade maps are highlighted in Fig.S3 and are used to interpret the surface assessment that is dependent on the interactions between covalent bonds. Due to the kinetic energy density on which they depend, the ELF and LOL have homogeneous chemical compositions. Since there are more electron pairs, ELF is dredged up, and LOL can discern localized orbital gradients that become agitated when they overlap (interpreted by savin and silvi) (Sowrirajan et al., 2022b). The ELF and LOL outcomes are constrained to the range of 0.0 to 1.0. Values between 0.5 and 1.0 indicate a comprehensive representation of both bonding and nonbonding localized electrons. The contours where electrons are intended to be delocalized are described by the diminutive value < 0.5. LOL exceeds > 0.5 in contours where electron localization dominates the electron density. The high localization of electrons is attributed to the durability of the covalent bond within the contours that possess significant values. ELF and LOL color shades show the presence of bonding and non-bonding electrons. In the figure, across the hydrogen atoms H7, H8, H10 and H15, the red color implies high ELF and LOL values, which further spot the presence of highly localized electrons. The central region of a hydrogen atom is white on the LOL color-filled map, noting that the electron density is higher than the upper limit of the color shade (0.8au) of the color scale. Within the header 24DCA the delocalized electron cloud that surrounds the carbon atoms in the phenyl ring can be seen by the blue color. Whereas a small blue circle around the carbon atoms, chlorine atoms Cl9 and Cl11, and oxygen atom O13 depict the region of electronic depletion between the valence layer and inner layer. As a consequence, the interpretation is consistent with the lone pair theory, which is derived from the Lewis structure.
4.9 Prediction of the ligand’s (ADMET) profile and drug scans approach
The most recent technique to pinpoint the compounds that are suggested to confirm the nature of a potentially active drug is called “drug-likeness.” Drug similarity analysis is carried out based on several pharmacophoric characteristics of the sample, including those of bioavailability, reactivity, and metabolic stability. The Swiss ADME web server generated bioavailability radar shown in Fig. 7 was used to confirm the “drug-likeness” requirements which use Lipinski's (Ro5) filter method descriptors, a chemical or drug compound is more likely to be a potential drug for human use if it meets specific requirements including MW < 500 Dalton, HBA < 10, HBD < 5, and lipophilicity laid out as log p < 5 TPSA < 140, and rotatable bonds < 10) (Elangovan et al., 2023). Within that study, the title compound 24DCA shows a molecular weight of 189.09 g/mol within the acceptable range, and the number of hydrogen bond donors and acceptors is 0 and 5 for each. Besides that, the number of rotatable bonds for the current drug is 2, and Lipinski's rule count is less than 10. The molar refractivity of the drug currently being used, 24DCA, is 46.66, which is between the threshold ranges of 40 and 130. The capabilities of drug transportation, including blood–brain barrier crossing, intestinal absorption, and penetration, can be inferred from the topological polar surface area, In the current scenario, 17.072 Å.2 is the predicted value, which is below the permissible range of 140 Å.2. The lipophilicity values of header composition are as follows: log P = 2.09, XLOGP3 = 2.72 and an MLOG P (octanol partition co-efficient) value of 2.94 less than 5 pointing to the compound's balanced hydrophobic/lipophilic nature. Further examination of the Ghose filter elements, such as molar refractivity and atom count (17), reveals that the title compound also complies with the Goose rule. The aforementioned requirements are often not violated by more than one orally bioactive medication. With a bioavailability score of 0.55, the substances included in the current scenario demonstrate strong oral bioavailability since they adhere closely to Lipinski's criteria.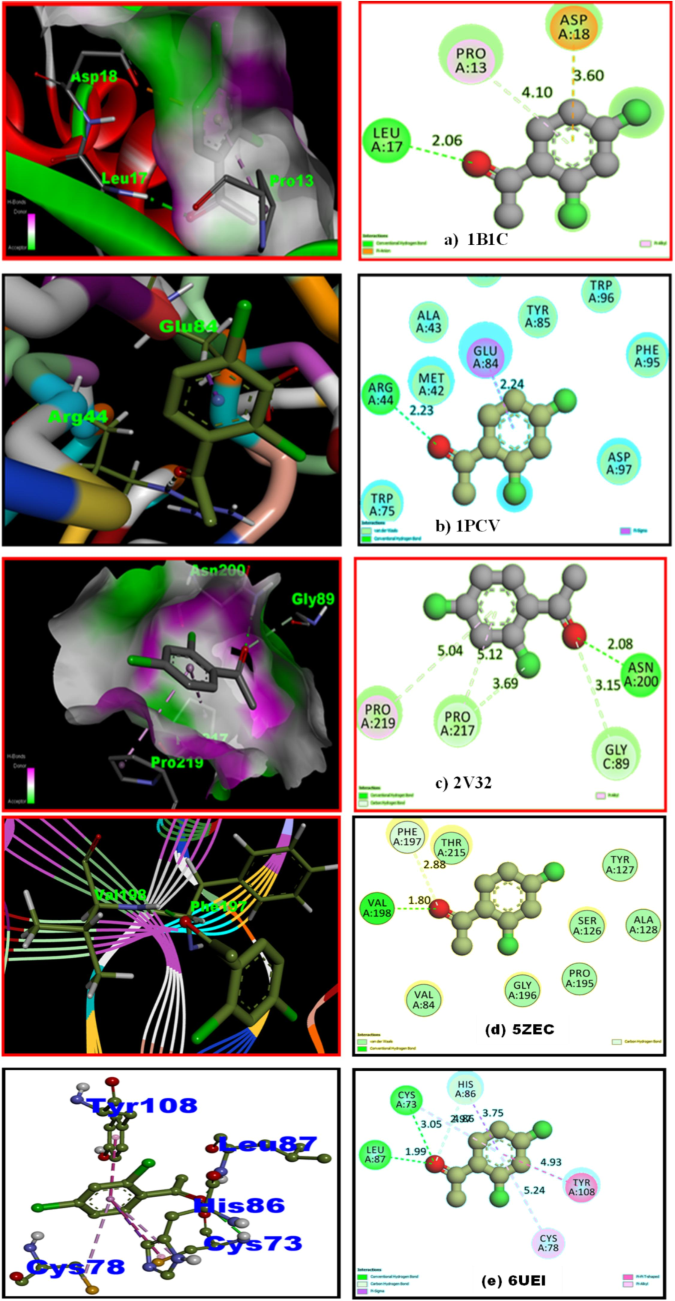
Ligand 24DCA embedded in active sites of Insuliin inhibitor (a) 1B1U, Antifungal (b) 1PCV, Antioxidant (c) 2 V32 Antiseptic (d) 5ZEC, Antiviral (e) 6UEI targeted proteins.
The qualities evaluated using the Swiss ADME server exhibited beneficial attributes, such as fantastic solubility (log s = -3.06) and a high likelihood of gastrointestinal absorption, leading to a promising potential for oral bioavailability. Pharmacokinetic studies examine the effects of drug-to-drug interactions on the activity of P-gp substrates and the suppression of CYP (Cytochrome enzymes) activities (Priya et al., 2023a). The protease-activated protein gp enables the movement of active substances across the membrane of living organisms. Furthermore, it plays a crucial function in the process of repelling objects. This compound is devoid of any p-gp substrates. This medicine exerts an influence on the enzymes CYP1A2, CYP2C19, CYP2C9, CYP2D6, and CYP3A4, which are impacted by the substance. Pan-assay interference chemicals (PAINS) are toxicological compounds that frequently induce spurious positive outcomes in high-throughput screening assays in medicinal chemistry. As an alternative, 24DCA has exhibited a 0-alert characteristic, signifying that it generates the intended analeptic effect exclusively through interaction with a particular receptor protein. PAINS interacting with multiple biological targets is more common than with a single target. Lead likeness aids chemical optimization performance by choosing the ideal starting locations. This chemical has no “lead-like” prospects despite therapeutic research. We further assessed the compound's hepatotoxicity, carcinogenicity, immunotoxicity, mutagenicity, and toxicity (LD50 880 mg/kg) using the Protox II web server. Endpoint and toxicity model results are in Table S4. The chemical has two AMES mutagenicity and carcinogenicity alerts.
Moreover, SwissADME encompasses a “BOILED-egg evaluation” feature delivering information on the human gastrointestinal absorption and blood–brain barrier permeability based on lipophilicity (WLOGP) and polarity (topological polar surface area, TPSA) as exemplified in Fig. S4 (top right). At certain points in the egg, the yolk and white align with the molecules that were expected to pass through the BBB and be absorbed by the gastrointestinal tract. Blue and red spots indicate compounds expected to be effluxed and not effluxed from the central nervous system by p-glycoprotein, respectively. The 24DCA molecule was positioned just inside the yolk region of the boiled egg model, as evidenced by the red dot position in Fig. 7. This indicates that the chemical portrays a rapid absorption rate in the gastrointestinal tract and readily traverses the blood–brain barrier. In addition to reflecting that the molecule cannot traverse the blood–brain barrier, the red dot's presence in the white area signifies a rapid rate of absorption in the gastrointestinal system. The chemical compound exhibits medicinal properties due to its high gastrointestinal absorption and skin permeability values (Log kp = -5.52 cm/s), together with its capacity to pass through the blood–brain barrier, emphasizing the potential for therapeutic use of the tested compound 24DCA.
4.10 Molecular docking
In the design and discovery of new drugs, molecular docking has demonstrated itself to be an effective sequential asset. Molecular docking allows for a comprehensive understanding of the interactions between potential therapeutic compounds and the binding site of the targeted protein, providing new perspectives on underlying biological systems. Furthermore, molecular docking is an economical drug-designing approach that might offer a compact molecule, with more accurate and reliable binding positions when compared to experimental results (N. Elangovan et al., 2021a). It determines the types of interactions and binding conformations seen between the ligand and the active site protein, as well as their bonding distances and residue group proximity target protein to be used for docking with the ligand, is chosen based on the binding energy value; spices with a lower binding energy value are more likely to be able to dock with the target protein. This research looked at the DFT/B3LYP theory, applied to the 6–311++G (d, p) method, yielded the optimal ligand structure. Gaussian 09 W was used to dock into the active sites of receptors 1B1U, 1PCV, 2 V32, 5ZEC and 6UEI of the insulin inhibitor, antifungal, antioxidant, antiseptic and antiviral proteins downloaded from the protein data bank PASS (prediction of atomic spectra) which is a web-based tool that makes predictions about various types of activities. Concerning binding affinity with all of the targeted proteins, the ligand molecule was docked appropriately for its position and orientation (Elangovan et al., 2024b) Fig. 7 highlights optimized ligand-target protein orientations by the least energy of binding. All computations were done exploiting Auto dock to predict the ligand–protein active binding site interaction. Leveraging the Kollaman and Gasteiger phase process, the co-factors and polar hydrogen were appended to the suitable intended protein in pdb style, while the co-crystalline ligand water was eliminated. For the first two ranks (1 and 2), the ranking capacity of the ligand with the targeted protein is pictured by Lamarckian docking binding energies (Kcal/mol), estimated inhibition constants (M), and reference RMSD values. The best pose was ascertained by having a higher binding energy value and the existence of a significant number of conventional hydrogen bonds. Considering the minimum energy of binding of interactions among ligands and proteins, the optimized ligand-target protein orientations are shown in Fig. 7. As illustrated in Fig. 7 the titled molecule contains a carbonyl group (C = O) that has hydrogen bond interaction with residues LEU A: 17(2.6 Å), ARG A: 44 (2.23 Å), ASN A: 200 (2.08 Å), VAL A: 198(1.80 Å) LEU A: 87, and CYS A: 73 (1.99 Å) (3.05 Å). The binding energies of proteins1B1U,1PCV, 2 V32, 5ZEC and 6UEI are −4.55 kcal/mol, −4.72 kcal/mol, −5.69 kcal/mol, −5.95 kcal/mol −6.18 kcal/mol, respectively, with estimated inhibition constant values of 213.10 µM, 214, 50 µM, 67.58 µM,43.15 µM and 29.67 µM reported in Table S5. Amongst these four proteins, the header molecule reacted favorably with antifungal protein (6UEI) which has the good binding energy-6.18 kcal/mol, inhibition constant 29.67 µM, total intermolecular energy of −6.48 kcal/mol and RMSD value 69.88 Å with the higher number of hydrogen bonds to the amino acid residues LEU A: 87, and CYS A: 73. It is noteworthy that this molecule interacts with active sites containing oxygen atoms through hydrogen bonding. The preceding arguments promote the possibility of using 24DCA as potent antiviral medications.
5 Conclusion
Ultimately, we successfully analyzed a 24DCA molecule in the DFT add method. The TD-DFT method was used to analyze the titled molecule solvent interaction. The structural, physicochemical, and biological features were analyzed using molecular spectroscopy methods. The Gaussian 09 software has been utilized for figuring out the optimum geometrical variables (bond lengths and bond angles) of the current material utilizing three distinct functional levels of theory and a single basis set. It is worth mentioning that the bond distance values obtained from the HF and CAM-B3LYP function levels are slightly shorter than those from the B3LYP technique. However, they are slightly longer than the B3LYP approach when compared to experimental data. The comparison of the scaled and experimental FT-IR and Raman wave numbers is supportive of one another. The allocations given for the different functional groups that exist in the molecule are further supported by the measured frequencies and PED output. These outcomes supported the validity of the methodology used to interpret the vibrational spectra. The NBO assessment method was adopted to scrutinize the stability of the molecule resulting from charge delocalization and hyper-conjugative interaction. Moreover, the energy assessments of the prominent molecular orbital theories of the headline compound were conducted relying on the B3LYP method. The molecular electrostatic contour reveals that the electronegative oxygen atoms possess the negative potential, while the positive potential is attributed to hydrogen atoms, which serve as the reactive sites in the molecule. The HOMO-LUMO energy gap of the 24DCA molecule is reduced by 4.253 eV using the B3LYP/6–311++G (d, p) method. This reduction has a significant effect on the molecule's intra-molecular charge transfer and biological impact. The weak and strong attractive interactions, as well as the steric repulsion, that existed in the title compound, are visualized and identified using RDG analysis and VMD software. The outcome of analyzing the drug-likeness criteria by using Lipinski's (RO5) confirmed that the subject molecule has acceptable drug-likeness characteristics. The minimum energy of binding for the 6UEI receptor was −6.18 kcal/mol, suggesting that the header compound seems to have an anti-viral potential to be utilized in biomedical applications.
CRediT authorship contribution statement
S. Mallika: Visualization, Validation, Data curation, Conceptualization, Investigation. B. Revathi: Validation, Supervision, Software, Formal analysis. V. Balachandran: Visualization, Validation, Supervision, Software. Natarajan Elangovan: Visualization, Validation, Supervision, Resources, Project administration, Funding acquisition. Ling Shing Wong: Project administration, Methodology, Investigation. Saminathan Kayarohanam: Visualization, Validation, Supervision. Natarajan Arumugam: Visualization, Validation, Supervision, Resources, Project administration, Funding acquisition. Sinouvassane Djearamane: Project administration, Software, Methodology, Investigation, Writing – review & editing.
Acknowledgment
The project was funded by Researchers Supporting Project number (RSP2025R143), King Saud University, Riyadh, Saudi Arabia.
Declaration of competing interest
The authors declare that they have no known competing financial interests or personal relationships that could have appeared to influence the work reported in this paper.
References
- Characterization and optical behavior of a new indole Schiff base using experimental data and TD-DFT/DMOl3 computations. Opt. Mater. (Amst). 2022;131:112594
- [CrossRef] [Google Scholar]
- Diazinium salts with dihydroxyacetophenone skeleton: syntheses and antimicrobial activity. Eur. J. Med. Chem.. 2009;44:2275-2279.
- [CrossRef] [Google Scholar]
- FTIR, FT-Raman and UV–Vis spectral studies of d-tyrosine molecule. J. Mol. Struct.. 2016;1105:169-177.
- [CrossRef] [Google Scholar]
- The spectroscopic (FT-IR, UV–vis), Fukui function, NLO, NBO, NPA and tautomerism effect analysis of (E)-2-[(2-hydroxy-6-methoxybenzylidene)amino]benzonitrile. Spectrochim. Acta Part A Mol. Biomol. Spectrosc.. 2015;139:539-548.
- [CrossRef] [Google Scholar]
- Synthesis, spectral features, electronic structure studies, and molecular docking analysis of a schiffbase (E)-1-(4-chlorophenyl)-N-(nitrophenyl)methanimine from 4-chloroaniline and 2-nitrobenzaldehyde. Vietnam J. Chem.. 2023;61:577-593.
- [CrossRef] [Google Scholar]
- Solvent role in molecular structure level, structural and topology investigations, molecular docking and antimicrobial activity studies on sulpha drug derivative. J. Mol. Struct.. 2024;1303:137570
- [CrossRef] [Google Scholar]
- Synthesis of a versatile Schiff base 4-((2-hydroxy-3,5-diiodobenzylidene) amino) benzenesulfonamide from 3,5-diiodosalicylaldehyde and sulfanilamide, structure, electronic properties, biological activity prediction and experimental antimicrobial propertie. J. Mol. Struct.. 2021;131700
- [CrossRef] [Google Scholar]
- Heliyon synthesis, single crystal (XRD), hirshfeld surface analysis, computational study (DFT) and molecular docking studies of (E) -4- ((2-hydroxy-3, 5-diio. Heliyon. 2021;7 e07724
- [CrossRef] [Google Scholar]
- Synthesis, structural investigation, computational study, antimicrobial activity and molecular docking studies of novel synthesized (E)-4-((pyridine-4-ylmethylene)amino)-N-(pyrimidin-2-yl)benzenesulfonamide from pyridine-4-carboxaldehyde and sulfadiazine. J. Mol. Struct.. 2021;1241
- [CrossRef] [Google Scholar]
- Synthesis, spectral characterization, electronic structure and biological activity screening of the schiff base 4-((4-Hydroxy-3-Methoxy-5-Nitrobenzylidene)Amino)-N-(Pyrimidin-2-yl)Benzene Sulfonamide from 5-nitrovaniline and sulphadiazene. Polycycl. Aromat. Compd. 2021:1-18.
- [CrossRef] [Google Scholar]
- Computational investigation on structural and reactive sites (HOMO-LUMO, MEP, NBO, NPA, ELF, LOL, RDG) identification, pharmacokinetic (ADME) properties and molecular docking investigation of (E)-4-((4-chlorobenzylidene) amino) benzene sulfonamide compoun. Anal. Chem. Lett.. 2022;12:58-76.
- [CrossRef] [Google Scholar]
- Synthesis, solvent role (water and DMSO), antimicrobial activity, reactivity analysis, inter and intramolecular charge transfer, topology, and molecular docking studies on adenine derivative. J. Mol. Liq.. 2023;391:123250
- [CrossRef] [Google Scholar]
- Synthesis, solvent role, absorption and emission studies of cytosine derivative. Heliyon. 2024;10 e28623
- [CrossRef] [Google Scholar]
- Synthesis, vibrational analysis, absorption and emission spectral studies, topology and molecular docking studies on sulfadiazine derivative. ChemistrySelect. 2024;9
- [CrossRef] [Google Scholar]
- Comparison study (experimental and theoretical), hydrogen bond interaction through water, donor acceptor investigation and molecular docking bis (methaneylylidene)) diphenol. J. Biomol. Struct. Dyn. 2024:1-16.
- [CrossRef] [Google Scholar]
- Theoretical vibrational spectroscopy (FT-IR), PED and DFT calculations of chromones and thiochromones. J. Mol. Struct.. 2022;1270:133972
- [CrossRef] [Google Scholar]
- Frisch, M.J., Trucks, G.W., Schlegel, H.B., Scuseria, G.E., Robb, M.A., Cheeseman, J.R., Scalmani, G., Barone, V., Mennucci, B., Petersson, G.A., Nakatsuji, H., Caricato, M., Li, X., Hratchian, H.P., Izmaylov, A.F., Bloino, J., Zheng, G., Sonnenberg, J.L., Hada, M., Ehara, M., Toyota, K., Fukuda, R., Hasegawa, J., Ishida, M., Nakajima, T., Honda, Y., Kitao, O., Nakai, H., Vreven, T., Montgomery, J.A., Peralta, J.E., Ogliaro, F., Bearpark, M., Heyd, J.J., Brothers, E., Kudin, K.N., Staroverov, V.N., Kobayashi, R., Normand, J., Raghavachari, K., Rendell, A., Burant, J.C., Iyengar, S.S., Tomasi, J., Cossi, M., Rega, N., Millam, J.M., Klene, M., Knox, J.E., Cross, J.B., Bakken, V., Adamo, C., Jaramillo, J., Gomperts, R., Stratmann, R.E., Yazyev, O., Austin, A.J., Cammi, R., Pomelli, C., Ochterski, J.W., Martin, R.L., Morokuma, K., Zakrzewski, V.G., Voth, G.A., Salvador, P., Dannenberg, J.J., Dapprich, S., Daniels, A.D., Farkas, Foresman, J.B., Ortiz, J. V, Cioslowski, J., Fox, D.J., 2009. Gaussian 09, Revision B.01. Gaussian 09, Revis. B.01, Gaussian, Inc., Wallingford CT 1–20.
- Solid state synthesis of a fluorescent Schiff base (E)-1-(perfluorophenyl)-N-(o-toly)methanimine followed by computational, quantum mechanical and molecular docking studies. Results Chem.. 2023;5:100819
- [CrossRef] [Google Scholar]
- Phosphorescence of aromatic ketones in low-temperature glasses. Photochem. Photobiol.. 1968;7:159-173.
- [CrossRef] [Google Scholar]
- Diketopiperazines from marine organisms. Chem. Biodivers.. 2010;7:2809-2829.
- [CrossRef] [Google Scholar]
- Spectroscopic (FTIR, FT-Raman), molecular electrostatic potential, NBO and HOMO–LUMO analysis of P-bromobenzene sulfonyl chloride based on DFT calculations. Spectrochim. Acta Part A Mol. Biomol. Spectrosc.. 2015;136:890-899.
- [CrossRef] [Google Scholar]
- Molecular structure, spectroscopic (FTIR, FT-Raman, 13C and 1H NMR, UV), polarizability and first-order hyperpolarizability, HOMO–LUMO analysis of 2,4-difluoroacetophenone. Spectrochim. Acta Part A Mol. Biomol. Spectrosc.. 2015;136:553-566.
- [CrossRef] [Google Scholar]
- Multiwfn: a multifunctional wavefunction analyzer. J. Comput. Chem.. 2012;33:580-592.
- [CrossRef] [Google Scholar]
- Solvation and its influence on the electronic structure and pharmacological activity of 2-fluoro-6-trifluromethyl acetophenone. J. Mol. Liq.. 2024;414:126154
- [CrossRef] [Google Scholar]
- Analytical method development using FTIR-ATR and FT-Raman spectroscopy to assay fructose, sucrose, glucose and dihydroxyacetone, in Leptospermum scoparium nectar. Vib. Spectrosc.. 2016;84:38-43.
- [CrossRef] [Google Scholar]
- Antimicrobial activity prediction, inter- and intramolecular charge transfer investigation, reactivity analysis and molecular docking studies of adenine derivatives. J. Biomol. Struct. Dyn. 2023:1-14.
- [CrossRef] [Google Scholar]
- Fluorescence property and solvent effect on m -bromosalicylaldehyde derivative ; insights from synthesis, characterization, antimicrobial activity and computational studies. Chem. Phys. Impact. 2023;7:100323
- [CrossRef] [Google Scholar]
- Schiff bases from chlorine substituted anilines and salicylaldehyde : Synthesis, characterization, fluorescence, thermal features, biological studies and electronic structure investigations. J. Mol. Liq.. 2023;370:121055
- [CrossRef] [Google Scholar]
- Inhibition of the enzymes in the leukotriene and prostaglandin pathways in inflammation by 3-aryl isocoumarins. Eur. J. Med. Chem.. 2016;124:428-434.
- [CrossRef] [Google Scholar]
- Synthesis, physico-chemical studies of manganese(II), cobalt(II), nickel(II), copper(II) and zinc(II) complexes with some p-substituted acetophenone benzoylhydrazones and their antimicrobial activity. J. Enzyme Inhib. Med. Chem.. 2009;24:577-588.
- [CrossRef] [Google Scholar]
- Experimental and QSAR of acetophenones as antibacterial agents. Chem. Biol. Drug Des.. 2008;72:303-313.
- [CrossRef] [Google Scholar]
- (E)-4-((4-Bromobenzylidene) Amino)-N-(Pyrimidin-2-yl) benzenesulfonamide from 4-bromobenzaldehyde and sulfadiazine, synthesis, spectral (FTIR, UV–Vis), computational (DFT, HOMO–LUMO, MEP, NBO, NPA, ELF, LOL, RDG) and molecular docking studies. Polycycl. Aromat. Compd.. 2022;42:7616-7631.
- [CrossRef] [Google Scholar]
- Synthesis, spectral, structural features, electronic properties, biological activities, computational, wave function properties, and molecular docking studies of (E)-4-(((pentafluorophenyl) methylene) amino)-N-(pyrimidin2-yl)benzenesulfonamide. J. Mol. Struct.. 2022;1265:133472
- [CrossRef] [Google Scholar]
- FT-IR, NIR-FT-Raman and gas phase infrared spectra of 3-aminoacetophenone by density functional theory and ab initio Hartree-Fock calculations. Spectrochim. Acta. A. Mol. Biomol. Spectrosc.. 2008;71:59-67.
- [CrossRef] [Google Scholar]
- Synthesis of 3-arylisocoumarins by using acyl anion chemistry and synthesis of thunberginol A and cajanolactone A. Europ. J. Org. Chem.. 2015;2015:1797-1803.
- [CrossRef] [Google Scholar]
- Recent Advances in the synthesis of diarylheptanoids. Chem. – an Asian J.. 2024;19 e202400380
- [CrossRef] [Google Scholar]
- FTIR, FT-Raman spectra and ab initio DFT vibrational analysis of 2-amino-5-chloropyridine. Spectrochim. Acta Part A Mol. Biomol. Spectrosc.. 2006;64:586-594.
- [CrossRef] [Google Scholar]
Appendix A
Supplementary material
Supplementary data to this article can be found online at https://doi.org/10.1016/j.jksus.2024.103574.
Appendix A
Supplementary material
The following are the Supplementary data to this article:


