

Translate this page into:
Safety and human health: The landscape of an effective UPLC-MS/MS method for the identification and quantification of N-Nitroso Hydrochlorothiazide impurity in Hydrochlorothiazide
⁎Corresponding authors. shanmukh_fed@kluniversity.in (J.V. Shanmukha Kumar), mrshaik@ksu.edu.sa (Mohammed Rafi Shaik)
-
Received: ,
Accepted: ,
This article was originally published by Elsevier and was migrated to Scientific Scholar after the change of Publisher.
Abstract
N-nitrosamines (NSAs) and Nitrosamine Drug Substance Related Impurities (NDSRIs) are class of compounds that contains the nitroso functional group. These compounds are carcinogens and mutagens for both humans and animals. As a result, all global regulatory agenesis are requiring risk assessments of NSAs in each pharmaceutical product. The present research aims to provide a single pre-packaged mass spectrometry method parameter set, which includes Ultra performance liquid chromatography and a triple quadrupole mass spectrometer (UPLC-MS-MS) configuration technique for qualifying and quantifying NNHCT in HCT. The analysis was performed on a YMC ODS-A liquid chromatography column with an oven temperature of 35 °C. In this method, mobile phase was prepared by mixing 10 mM ammonium formate buffer and acetonitrile was mixed in the ratio of 60:40 (v/v) with an isocratic program and a flow rate of 0.8 mL/min. The mass detector was used along with electrospray ionization (ESI) Negative mode with multiple reaction monitoring (MRM). The method has been validated in accordance with the current regulatory guidelines and shown the ability to detect NNHCT with a LOQ of 0.01 ppm and LOD of 0.005 ppm.
Keywords
N-Nitroso hydrochlorothiazide
Hydrochlorothiazide
Nitrosamines
Genotoxic
Mass spectrometry
NDSRIs

1 Introduction
British researchers, John Barnes and Peter Magee, discovered that the common N-nitrosamine compound dimethylnitrosamine causes liver tumours in rats in 1956 (Li and Hecht, 2022). About 90 % of the 300 nitrosamines studied were found to be carcinogenic in a variety of animals, according to later research..
In the 1970 s, Norwegian farm animals that had been given herring meal that had been preserved with sodium nitrite had a higher incidence of liver cancer (Boye and Arcand, 2012). Dimethylnitrosamine, which was found to be carcinogenic during research conducted in the 1950 s, formed when the sodium nitrite interacted with the dimethylamine present in the fish (Park et al., 2015; Some et al., 2013).
All regulatory agencies have been looking at the existence of NSAs in medicinal products since 2018. During this time, various products, including Sartans, Ranitidine, Metformin, and Nizatidine, were recalled and re-evaluated in order to establish risk assessments and appropriate control mechanisms for NSAs (Sedlo et al., 2021; Shaik et al., 2022; Tuesuwan and Vongsutilers, 2021; Fogarasi Szabo et al., 2015; Keire et al., 2022). In September 2020, the FDA issued industry recommendations for the control of nitrosamine impurities for immediate implementation (Food and D., 2020). Furthermore, the pharmaceutical sector discovered NSAs that are structurally related to drug substances, which are known as “Nitrosamine Drug Substance Related Impurities” (NDSRIs). The nitrosation of an amine moiety that present in the drug's active ingredient can produce these impurities. The increase in NDSRIs can be possible during the stability of pharmaceutical items, which could reduce the product's shelf life (Schlingemann et al., 2023; Cioc et al., 2023; Ashworth et al., 2023; Holzgrabe, 2023). As a result, global regulatory agenesis developed some NDSRI limits with other NSAs (NDSRI).
The identification and quantification of NSAs and NDSRIs in pharmaceutical products has created a significant challenge to both manufacturers and regulatory agencies. NDSRIs are primarily connected with drug-product reactions, which adds to the complexity. APIs with secondary amine or dimethyl tertiary amine centres are at risk of producing NDSRIs due to amine centre nitrosation. This can happen under circumstances relating to the drug product's formulation and manufacturing process, such as a reaction with residual nitrites in excipients used for manufacturing the drug product (Wichitnithad et al., 2022). NDSRI impurities have been linked to nitrite impurities found in common excipients at parts-per-million (ppm) levels and also generated into a drug substance or drug product by reagents, catalysts, solvents, or raw materials utilized in the manufacturing process. These impurities can be avoided by taking caution when manufacturing drug substances and drug products (Nudelman et al., 2023; Bharate, 2021; Food et al., 2022; Do).
Hydrochlorothiazide (Fig. 1) is chemically known as 6-chloro-1,1-dioxo-3,4-dihydro-2H-1,2,4-benzothiadiazine-7-sulfonamide that has chemical formula C7H8ClN3O4S2 and molecular weight 297.741 g/mol. HCT sold under the brand name of Hydrodiuril. These medicine is commonly used to treat hypertension (high blood pressure) and is relatively safe. It is also used to alleviate swelling induced by heart failure, liver damage (cirrhosis), and the use of corticosteroids or estrogens. It may also aid in the treatment of edema caused by kidney issues. The oral administration contains 25 mg to 100 mg HCT once or twice daily (Wright et al., 2018; Knowles et al., 2005; Marín Cuevas, 1996; Goetschalckx et al., 2007).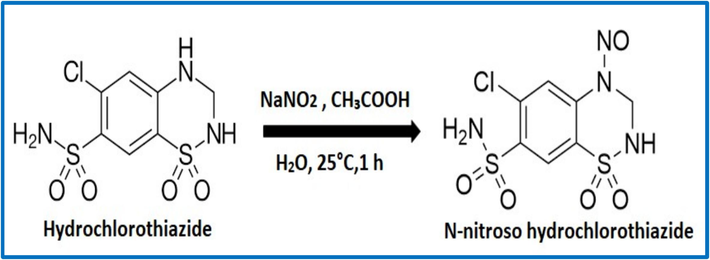
Structure and reaction conversion of HCT to NNHCT.
N-Nitroso Hydrochlorothiazide (NNHCT) (Fig. 1) is chemically known as 6-Chloro-4-nitroso-3,4-dihydro-2H-benzo[e] (Li and Hecht, 2022; Boye and Arcand, 2012; Some et al., 2013)thiadiazine-7-sulfonamide 1,1- dioxide. HCT contains the secondary aryl–alkyl-amino moiety, it is vulnerable to the formation of NNHCT, it is a NDSRI (Grahek et al., 2023). According to the literature, diphenhydramine and hydrochlorothiazide produced mutagenic compounds with or without activation, but exclusively in strain TA98 (Andrews et al., 1984). According to the European Medicines Agency's article (EMA/315970/2023 rev.1), the NNHCT is classified as a non-mutagenic impurity. However, this needs to be controlled in accordance with ICH Q3B regulations (Acceptable intakes established for N-nitrosamines , European Medicines Agency, 28 September, 2023).
The advanced analytical methods developed for the identification of genotoxic impurities contained in different healthcare products and to attain the trace level quantification limits with sufficient precision and accuracy (Chittireddy et al., 2022; Chittireddy et al., 2022; Chittireddy et al., 2023).
Similarly, sensitive analytical methods are necessary to identify and quantify trace levels of NNHCT. Based on the literature, analytical methods developed to regulate only HCT by HPLC (Tiris et al., 2022), RP-HPLC (KurbanoĞlu and Yarman, 2020), HPLC-UV, LC-DAD and LC-MS (Gumieniczek et al., 2018), UV (Anandakumar et al., 2011), HPTLC (Khodke et al., 2010), preparative LC-MS (Franolic et al., 2001), Ion Pair-HPLC (Gandhimathi and Ravi, 2009). There is no approach established using MRM UPLC-MS/MS for detecting NNHCT. Furthermore, no method has been reported for identification and quantification of NNHCT in HCT (Scheme 1).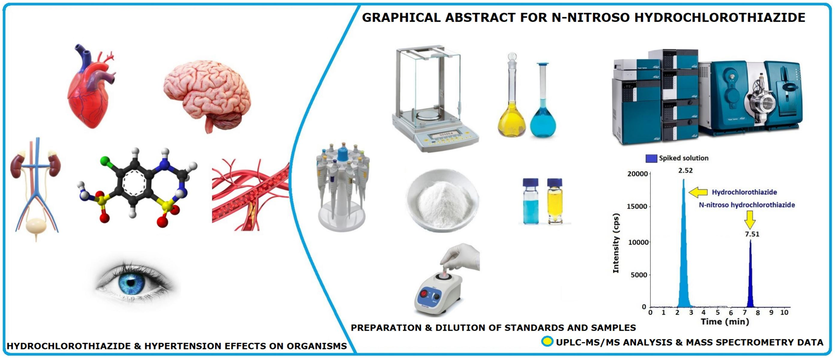
Graphical representation of the UPLC-MS/MS method.
2 Materials and methods
2.1 Materials
In this research, N-Nitroso Hydrochlorothiazide and Hydrochlorothiazide gifted by HTS Bio pharma, Hyderabad − 500 090 (India), ammonium formate procured from Sigma Aldrich (India), LC-MS grade acetonitrile procured from J.T.Baker®. LC-MS grade water procured from Merck.
2.2 Equipment
ABsciex QTRAP 4500 UPLC system connected with QTRAP MS-MS with ESI probe used. Analyst 1.6.3 software was used to collect and analyse the data. The analytical balance, Sartorius AG, Germany was used for weighing.
2.3 UPLC method conditions
HPLC column and YMC ODS-A (250 mm 4.6 mm, 5 µm) were used for reversed phase separations. The column oven temperature 35 °C mobile phase 10 mM ammonium formate in water as a buffer and acetonitrile was used for the preparation of mobile phase in a ratio of 60:40 (v/v) with an isocratic program, a flow rate of 0.8 mL/min, and a run time of 11 min with injection volume of 50 µL. The sample chiller temperature kept as 5 °C (Table 1).
Instrument Parameters
Conditions
UPLC conditions
Buffer
10 mM ammonium formate in water
Mobile phase
Buffer: Acetonitrile in the ratio of 60:40 (v/v)
Sampler temperature
5 °C
Column temperature
35 °C
Flow rate
0.8 mL/min
Injection volume
50 μL
Mode
Isocratic
Diluent
7:3 ratio of water and acetonitrile (v/v).
Analysis time
11 min
MS-MS conditions
MS source and mode of ionization
ESI − negative
Mode of detection
M R M
Quantification MRM (m/z)
325 > 293.8
Qualification/Identification MRM (m/z)
325 > 217 and 325 > 281
CE
−31, −27 and −15
DP
−80
EP
−10
CXP
−15
CAD
9
MS temperature
500 °C
2.4 Mass detector conditions
The mass response achieved by scan type of multiple reaction monitoring (MRM) with ESI negative ion source at m/z value Q1 Mass (Da):325 and Q3:293.8 for quantification of NNHCT impurity. The m/z value Q1 Mass (Da):325 and Q3:217 and 281 for identification. As MS/MS detector conditions are declustering potential (DP) of −80, entry potential (EP) of −10, collision energy (CE) of −31, −27 and −15, collision cell exit potential (CXP): −15, dwell time in milli seconds: 100, curtain gas: 30, collision gas (CAD): 9 and an of 500 °C MS temperature were applied. The mass diversion with time and position were applied up to 6 min to avoid Mass contamination from the HCT main peak (Table 1).
2.5 Procedure for diluent preparation
Accurately transferred 700 mL water and acetonitrile 300 mL in 1000 ml mobile phase bottle and mixed well.
2.6 Procedure for NNHCT and HCT solutions preparation
NNHCT standard solution (0.03 ppm) with respect to sample concentration and HCT 100 mg/mL samples were prepared by using diluent and sonicated for 3 min. After that, it was vortexed for another 3 min and mixed. The sample solution was filtered through a 0.45 µ PVDF filter.
3 Results
3.1 Method development and optimization
The analyte solubility is determined by using mass compatible solvents. The solubility of HCT and NNHCT in organic and aqueous solutions verified. Due to the low response of NNHCT in organic solvents, selected suitable composition of both Organic and aqueous as a diluent. water: acetonitrile (70:30, v/v) was selected as diluent and found high response, and sharp peak shapes. In addition, consistent recoveries were obtained without any sample matrix interference.
3.2 Method development and mass spectrometric conditions optimization
Mass tuning was used to determine Q1 and Q3 fragments by utilizing diluted solutions, during the early stages of development, the possibility of ESI source with positive and negative mode and APCI with positive and negative mode was examined. The response in ESI negative mode was much higher. For NNHCT impurity identification and quantification Q1 325 and Q3 293.8 and 217 and 281 were finalised. The additional mass parameters are DP −80, EP −10, CE −31, −27 and −15, CAD 9 and MS temperature 500 °C (Figs. 2 & 3).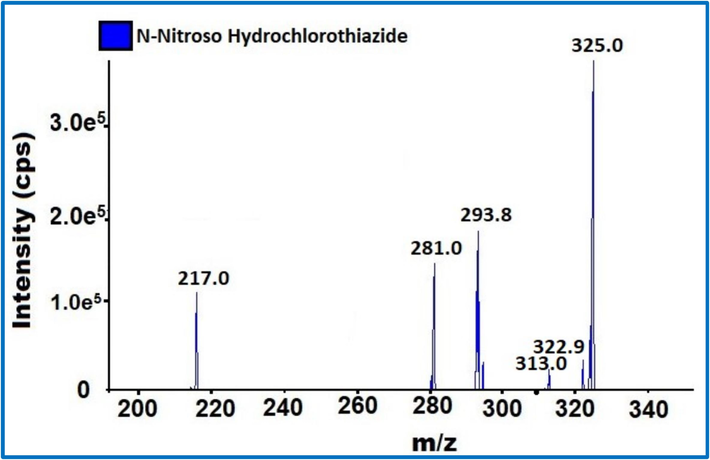
NNHCT impurity Mass fragmentation.
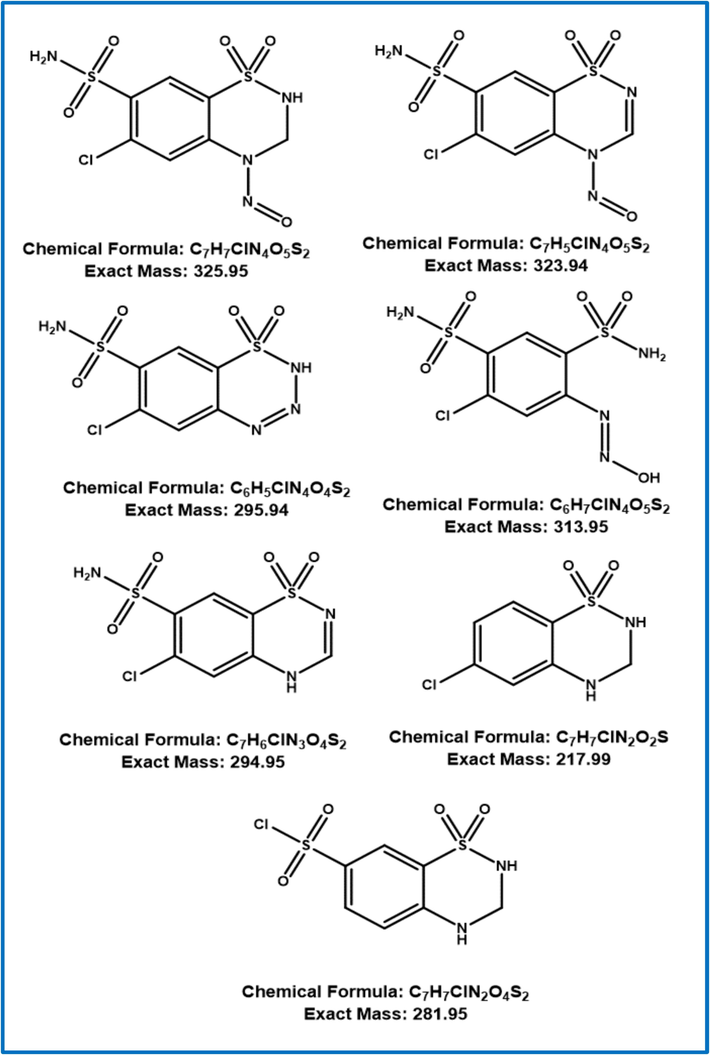
NNHCT impurity probable fragmentation.
3.3 Method development and optimization of chromatographic conditions
HPLC columns with different stationary phases C8, phenyl-hexyl, C18, phenyl and diverse column lengths (250 and 150 mm) and silicon particle size (5µ and 3.5 µ) were assessed in order to achieve accurate base to base separation of the NNHCT impurity from HCT. HPLC column YMC ODS-A (250 mm 4.6 mm, 5 m) was gave superior retention performance and enhanced peak shape with excellent response. Different mass compatible compositions of solvents and buffers and mobile phase compositions were examined. Gradient and isocratic elution modes were assessed by using different buffer and solvent compositions. 10 mM ammonium formate 60 % and acetonitrile 40 % as the mobile phase with isocratic elution mode accomplished the best separation of the NNHCT impurity from HCT. The flow rate of the mobile phase was optimised as 0.8 mL/min, and the column temperature was maintained at 35 °C. The NNHCT response, ionizations and reproducibility was quite good when the above chromatographic and mass conditions were used, and retention time was around 7.5 min.
3.4 Method validation
The final method was validated in compliance with the requirements of the ICH, USP, and FDA guidelines (International conference; Analytical Procedures; USP, 1225).
3.5 System suitability (SST) and Specificity
The SST followed by specificity was performed by using final method, Blank, standard, sample, spiked sample, and NNHCT impurity prepared by using diluent at a specification level (0.03 ppm) to confirm the separation of peaks as well as to check for Blank interference in sample and spike solutions and the reproducibility of standard and spike solutions.
The SST and Specificity data obtained are within the acceptance criteria (Table 2) (Fig. 4).
Parameters of method validation and Limits
Results
SST and
SpecificityNNHCT peak area % RSD (n = 6) should be ≤ 15.0.
2.8 %
RT of NNHCT
7.5 min
Blank interference
Clear blank
LOD
Final concentration in ppm and S/N should be ≥ 3
0.005 ppm
35
Precision % RSD should be ≤ 33.0 %
11.6 %
LOQ
Final concentration in ppm and S/N should be ≥ 10
0.01 ppm
85
Precision % RSD should be ≤ 15.0 %
5.4 %
Linearity
Range in ppm
(r) ≥ 0.99
(r2) ≥ 0.990.01 to 0.06
0.999
0.998
MP
Spiked sample % RSD should be ≤ 15.0
5.2 %
IP
Spiked sample % RSD should be ≤ 15.0
4.8 %
MP and IP results
Spiked sample % RSD for MP and IP should be ≤ 20.0
Less than 20.0 %
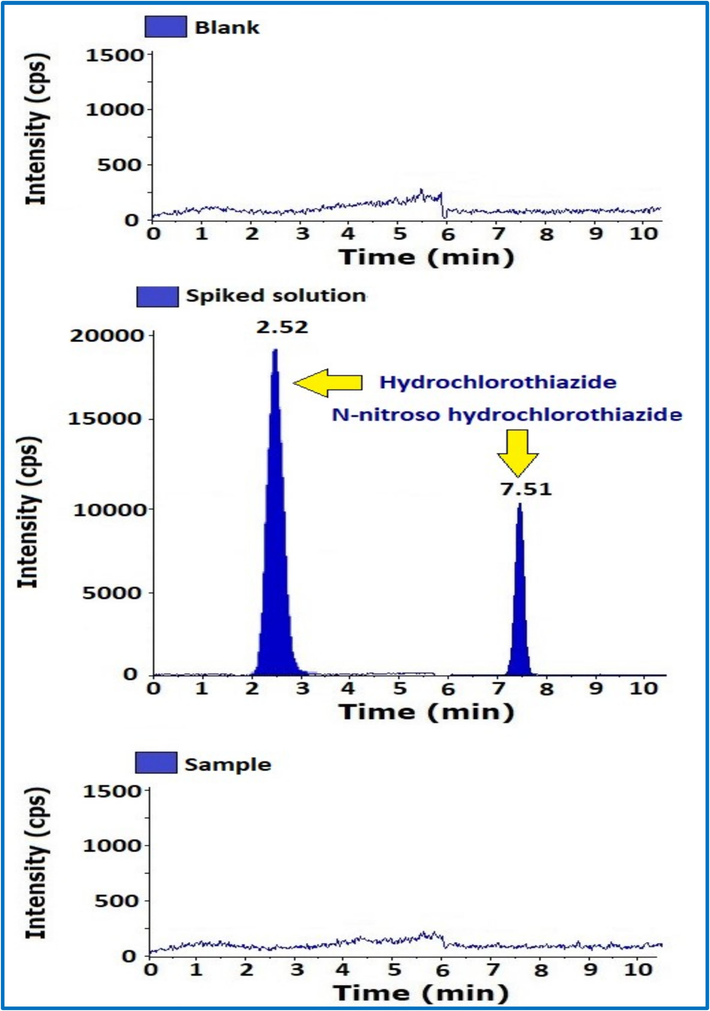
MS/MS chromatograms of blank, Spike and sample solutions.
3.6 LOD, LOQ and LOD, LOQ precision
The S/N technique was used to determine the LOD and LOQ. The LOQ was calculated and determined using LC-MS system computer-aided software. For LOQ, the S/N ratio is 10, whereas for LOD, the S/N ratio is 3. Final LOQ and LOD concentrations are 0.01 ppm and 0.005 ppm correspondingly sample concentration, injected solutions of NNHCT impurity 0.01 ppm and 0.005 ppm in triplicate. The LOD, LOQ precision was determined by injecting same solutions each six times.
Results found with in the acceptance limits (Table 2) (Fig. 5).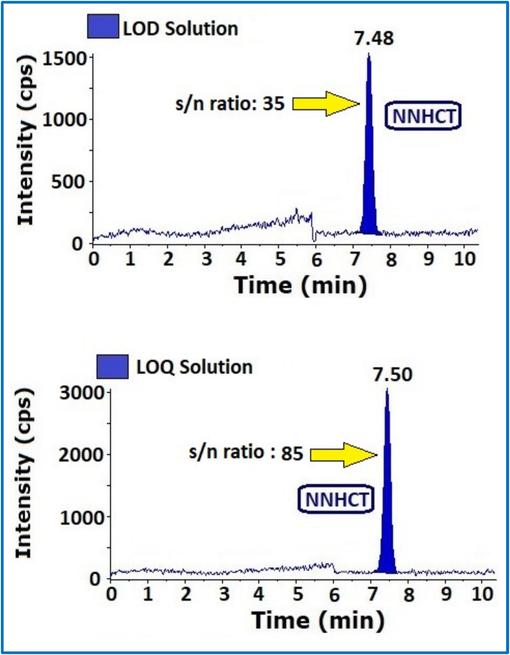
MS-MS chromatograms of LOD and LOQ with S/N values.
3.7 Linearity and range
The linearity solutions were prepared by serially diluting a single NNHCT stock solution. The impurity peak response was plotted against the corresponding theoretical concentration. The linearity was proven from LOQ to 200 % of impurity with regard to HCT concentration. Each level injected in duplicate, the levels are LOQ, 50 %, 75 %, 100 %, 150 %, and 200 % of six various established concentrations (0.01 ppm, 0.015 ppm, 0.0225 ppm, 0.03 ppm, 0.045 ppm, and 0.06 ppm).
The achieved linearity results were within the limit; therefore, the final method was linear and within the range (Table 2).
3.8 Method precision
Method precision (MP) was determined by using a sample of HCT unspiked and spiked solutions. 6 as such and 6 spiked HCT samples were prepared by adding NNHCT at the specification level and injected.
The MP results were within the defined acceptance limits. Therefore, this procedure was precise and reproducible (Table 1) (Fig. 6).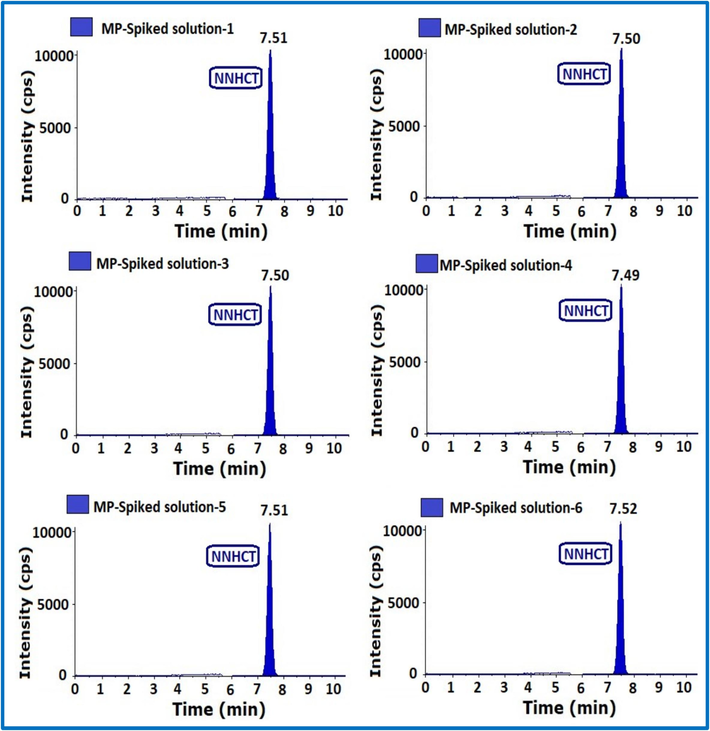
MS-MS chromatograms of method precision.
3.9 Intermediate precision
The intermediate precision (IP) was carried out by different analyst on different equipment, different columns, and different days. Prepared six as such samples and six spiked samples in line with MP.
IP results and MP results was compared and found within the acceptance limit. Hence the method was rugged (Table 2).
3.10 Accuracy
The accuracy was assessed by spiking impurity to HCT sample at concentrations ranging from LOQ to 150 %. The NNHCT impurity was added into the sample at levels of LOQ (0.01 ppm), 50 % (0.015 ppm), 100 % (0.03 ppm), and 150 % (0.045 ppm), with triplicate spiked sample solutions prepared for each level.
The obtained accuracy results were within the allowed rangehence the method was accurate (Table 3).
Parameters of method validation and Limits
Results
Accuracy
LOQ recovery should be between 70 and 130.
93.5 %
50 % recovery should be between 80 and 120.
91.6 %
100 % recovery should be between 80 and 120.
95.2 %
150 % recovery should be between 80 and 120.
97.2 %
Robustness
0.9 mL/min: spiked % difference in concentration and RT (Min)
4.2 %
7.1 min
0.7 mL/min: spiked % difference in concentration and RT
3.6 %
7.9 min
Column 37 °C: spiked % difference in concentration and RT
2.1 %
7.3 min
Column 33 °C: spiked % difference in concentration and RT
3.1 %
7.7 min
Solution Stability
Stability of solutions at (25 ± 5 °C) and refrigerated conditions (2–8 °C) up to 24 h
Stable up to 24 h
3.11 Robustness
The robustness parameter was used to test the methods effectiveness when the final procedure undergoes small changes. The column flow rates were changed to (+) plus flow 0.9 mL/min, (−) minus flow 0.7 mL/min, and column oven temperatures were changed to (+) plus column temperature at 37 °C and (−) minus column temperature at 33 °C (Table 2).
The obtained robustness results were within the allowed range.
3.12 Solution stability
The solution stability studies were performed with stock solution of NNHCT impurity secondary intermediate. Prepared standard and spiked samples at specification levels and kept for 24 h at room or ambient (25 ± 5 °C) and refrigerated (2–8 °C). The recoveries % of primary standard and spiked solutions were calculated against the freshly prepared primary solutions (Table 2).
The obtained solution stability results were within the allowed range and solutions are stable up to 24 h.
4 Discussion
UPLC-MS/MS technique is an advanced analytical technology for identification and quantification of trace level impurities. NNHCT impurity in HCT was determined by using this advanced analytical technique. Matrix interference of each analyte and mass fragmentation is more specific for each compound. There was no matrix and blank observed in this method. A benefit of this new technique was detection of NNHCT in ppm concentrations, whereas the earlier reported methods like HPLC, RP-HPLC, HPLC-UV, LC-DAD and LC-MS, UV Spectrophotometric, HPTL, preparative LC-MS method, Ion Pair-HPLC Method [66–73] methods were silent about NNHCT impurity and not discussed the identification and quantification of it in HCT. The developed UPLC-MS/MS method for NNHCT impurity in HCT was simple and accurate. The highest sensitivity was achieved using electrospray ionization (ESI), and matrix effects were minimized using selective MRM transitions there was no derivatization process involved in the sample preparation. The final LOQ was 0.01 and the LOD was 0.005 ppm. Therefore, the results of the research is more accurate and effective Standard qualification data and Validation chromatograms are submitted as part of supplementary file (Figures S1-S20).
5 Conclusions
The sensitive, selective, and rapid UPLC LC-MS/MS method developed for the identification and quantification of NNHCT impurity in HCT. Thus, this new method, which uses advanced technology, is capable of identifying and detecting NNHCT impurity at ppm and ppb levels. Considering the industrial requirements, the method was validated in line with regulatory guidelines. The method is specific, linear, precise, accurate and robust. The results obtained by using this method demonstrated that reliable data can be obtained in further experiments, for example, in relation to HCT drug substances and drug products.
Funding
The authors acknowledge the financial support through the Researchers Supporting Project number (RSPD2024R665), King Saud University, Riyadh, Saudi Arabia.
CRediT authorship contribution statement
Anuradha Bhimireddy: Writing – review & editing, Writing – original draft, Validation, Methodology, Investigation, Data curation, Conceptualization. J.V. Shanmukha Kumar: Supervision, Resources, Project administration, Methodology, Conceptualization. H.N. Prasada Reddy Chittireddy: Writing – original draft, Validation, Investigation. Mohammed Rafi Shaik: Writing – review & editing, Resources, Funding acquisition, Formal analysis, Data curation. Mohamed E. Assal: Formal analysis, Data curation. Mujeeb Khan: Formal analysis, Data curation.
Acknowledgment
The authors acknowledge the funding from Researchers Supporting Project number (RSPD2024R665), King Saud University, Riyadh, Saudi Arabia.
Declaration of competing interest
The authors declare that they have no known competing financial interests or personal relationships that could have appeared to influence the work reported in this paper.
References
- Acceptable intakes established for N-nitrosamines , European Medicines Agency, 28 September 2023 EMA/315970/2023 rev.1, https://www.ema.europa.eu/en/documents/other/appendix-1-acceptable-intakes-established-n-nitrosamines_.pdf.
- Analytical Procedures and Methods Validation for Drugs and Biologics Guidance for Industry, https://www.fda.gov/files/drugs/published/Analytical-Procedures-and-Methods-Validation-for-Drugs-and-Biologics.pdf,.
- Development and validation of a UV spectrophotometric method for the simultaneous estimation of eprosartan mesylate and hydrochlorothiazide in bulk and formulations. Indian J. Pharm. Sci.. 2011;73:569.
- [Google Scholar]
- Mutagenicity of amine drugs and their products of nitrosation. Mutation Research/genetic Toxicology. 1984;135:105-108.
- [Google Scholar]
- Approaches and Considerations for the Investigation and Synthesis of N-Nitrosamine Drug Substance-Related Impurities. Organic Process Research & Development: NDSRIs); 2023.
- Critical analysis of drug product recalls due to nitrosamine impurities. J. Med. Chem.. 2021;64:2923-2936.
- [Google Scholar]
- Green technologies in food production and processing. Springer Science & Business Media:; 2012.
- Development and Validation for Quantification of 7-Nitroso Impurity in Sitagliptin by Ultraperformance Liquid Chromatography with Triple Quadrupole Mass Spectrometry. Molecules. 2022;27:8581.
- [Google Scholar]
- Development and Validation for Quantification of Cephapirin and Ceftiofur by Ultraperformance Liquid Chromatography with Triple Quadrupole Mass Spectrometry. Molecules. 2022;27:7920.
- [Google Scholar]
- Development and Validation for Quantitative Determination of Genotoxic Impurity in Gemfibrozil by Gas Chromatography with Mass Spectrometry. Separations. 2023;10:145.
- [Google Scholar]
- Formation of N-nitrosamine drug substance related impurities in medicines: a regulatory perspective on risk factors and mitigation strategies. Org. Process Res. Dev.. 2023;27:1736-1750.
- [Google Scholar]
- W.Y.C. Do, Update: Oral Prescription Drugs Recalled Due to Nitrosamine Contamination,.
- F. Food, Drug Administration. Sandoz, Inc. Issues nationwide recall of 13 lots of orphenadrine citrate 100 mg extended release tablets due to presence of a nitrosamine impurity. 2022.
- Administration, Control of nitrosamine impurities in human drugs. Guidance for Industry 2020
- [Google Scholar]
- Isolation of a 2: 1 hydrochlorothiazide–formaldehyde adduct impurity in hydrochlorothiazide drug substance by preparative chromatography and characterization by electrospray ionization LC–MS. J. Pharm. Biomed. Anal.. 2001;26:651-663.
- [Google Scholar]
- Ion pair-HPLC method for the simultaneous estimation of quinapril and hydrochlorothiazide in tablets. Indian J. Pharm. Sci.. 2009;71:311.
- [Google Scholar]
- Hydrochlorothiazide-associated noncardiogenic pulmonary oedema and shock: a case report and review of the literature. Acta Cardiol.. 2007;62:215-220.
- [Google Scholar]
- Stability and Degradation Pathways of N-Nitroso-Hydrochlorothiazide and the Corresponding Aryl Diazonium Ion. Org. Process Res. Dev. 2023
- [Google Scholar]
- Kinetics and characterization of degradation products of dihydralazine and hydrochlorothiazide in binary mixture by HPLC-UV, LC-DAD and LC–MS methods. Chromatographia. 2018;81:1147-1162.
- [Google Scholar]
- International conference on harmonisation of technical requirements for registration of pharmaceuticals for human use ich harmonised tripartite guideline validation of analytical procedures: text and methodology Q2(R1). https://database.ich.org/sites/default/files/Q2%28R1%29%20Guideline.pdf,.
- International regulatory collaboration on the analysis of nitrosamines in metformin-containing medicines. AAPS J.. 2022;24:56.
- [Google Scholar]
- A validated stability indicating HPTLC method for simultaneous estimation of irbesartan and hydrochlorothiazide. Pharm. Methods. 2010;1:39-43.
- [Google Scholar]
- Hydrochlorothiazide-induced noncardiogenic pulmonary edema: an underrecognized yet serious adverse drug reaction, Pharmacotherapy: The Journal of Human Pharmacology and Drug. Therapy. 2005;25:1258-1265.
- [Google Scholar]
- Simultaneous determination of hydrochlorothiazide and irbesartan from pharmaceutical dosage forms with RP-HPLC. Turkish Journal of Pharmaceutical Sciences. 2020;17:523.
- [Google Scholar]
- Metabolic activation and DNA interactions of carcinogenic N-nitrosamines to which humans are commonly exposed. Int. J. Mol. Sci.. 2022;23:4559.
- [Google Scholar]
- Intake Recommended Acceptable Limits for Nitrosamine Drug SubstanceRelated Impurities (NDSRIs) Guidance for Industry, https://www.fda.gov/media/170794/download,.
- The nitrosamine “saga”: lessons learned from five years of scrutiny. Org. Process Res. Dev.. 2023;27:1719-1735.
- [Google Scholar]
- Distribution of seven N-nitrosamines in food. Toxicological Research. 2015;31:279-288.
- [Google Scholar]
- The landscape of potential small and drug substance related nitrosamines in pharmaceuticals. J. Pharm. Sci.. 2023;112:1287-1304.
- [Google Scholar]
- Presence of nitrosamine impurities in medicinal products. Arch. Ind. Hyg. Toxicol.. 2021;72:1-5.
- [Google Scholar]
- Regulatory updates and analytical methodologies for nitrosamine impurities detection in sartans, ranitidine, nizatidine, and metformin along with sample preparation techniques. Crit. Rev. Anal. Chem.. 2022;52:53-71.
- [Google Scholar]
- High-quality reduced graphene oxide by a dual-function chemical reduction and healing process. Sci. Rep.. 2013;3:1929.
- [Google Scholar]
- Simultaneous determination of hydrochlorothiazide, amlodipine, and telmisartan with spectrophotometric and HPLC green chemistry applications. Chemosphere. 2022;303:135074
- [Google Scholar]
- Nitrosamine contamination in pharmaceuticals: threat, impact, and control. J. Pharm. Sci.. 2021;110:3118-3128.
- [Google Scholar]
- USP <1225> Valıdatıon of compendıal methods, http://www.uspbpep.com/usp29/v29240/usp29nf24s0_c1225.html,.
- An update on the current status and prospects of nitrosation pathways and possible root causes of nitrosamine formation in various pharmaceuticals. Saudi Pharmaceutical Journal 2022
- [Google Scholar]
- J.M. Wright, V.M. Musini, R. Gill, First‐line drugs for hypertension, Cochrane Database of systematic reviews (2018).
Appendix A
Supplementary data
Supplementary data to this article can be found online at https://doi.org/10.1016/j.jksus.2024.103349.
Appendix A
Supplementary data
The following are the Supplementary data to this article:


