

Translate this page into:
Physicochemical properties and combustion kinetics of food waste derived hydrochars
⁎Corresponding author. mokhan@ksu.edu.sa (Moonis Ali Khan)
-
Received: ,
Accepted: ,
This article was originally published by Elsevier and was migrated to Scientific Scholar after the change of Publisher.
Peer review under responsibility of King Saud University.
Abstract
Abstract
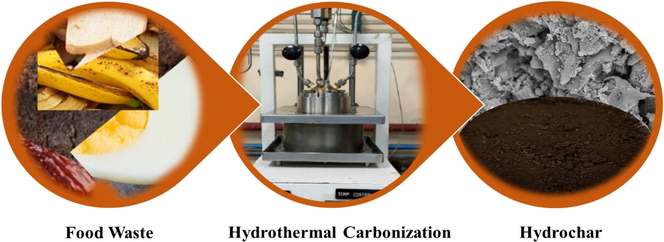
In this work, simulated food waste (15% white bread, 15% palm dates (without seeds), 5% boiled egg (without shells), 20% spent tea leaves, 20% spent coffee ground, and 25% banana peel in parts weight) was subjected to hydrothermal carbonization (HTC) at 180, 200 and 220 °C for 120 min. The mass yield and energy yield of the resultant hydrochars viz. HTC180, HTC200, and HTC220 were 69.46, 68.50, 65.35% and 88.91, 87.68, 84.30%, respectively. Among the hydrochars produced, HTC220 had the highest heating value (HHV: 23.61 MJ/kg), while the food waste had a HHV of 18.17 MJ/kg. Activation energy for the combustion of food waste and HTC220 was determined by modelling the thermogravimetric data using the Arrhenius equation and was found to be in the range of 29.98 to 33.51 kJ/mol and 16.52 to 25.47 kJ/mol, respectively. The densification ratio for the three hydrochar samples varied slightly (1.28–1.29). The results indicate that the hydrochar produced from food waste could be a potential to substitute coal combustion.
Keywords
Food waste
Hydrothermal carbonization
Hydrochar
Thermogravimetric analysis
Kinetics

1 Introduction
Food waste is documented as one of the challenges confronting the world today with severe impacts on the environment. The Food Waste Index Report, 2021 recently released from the United Nations Environment Programme (UNEP) indicated that roughly 0.93 billion tonnes of food was discarded as waste in 2019 (UNEP, 2021). The 2015 United Nations sustainable development agenda identified food waste as a core challenge to be addressed in order to achieve sustainable consumption. The agenda outlined in section 12.3 and 12.5 of Sustainable Development Goal for cutting in half per capita global food waste and significantly minimizing waste generation respectively necessitates a sustainable approach for complete waste valorisation besides mitigation strategies (Ishangulyyev et al., 2019).
Religious pilgrimages are one of the major global food waste generators. For instance, annually, around 10 million pilgrims from all over the world travel to the Kingdom of Saudi Arabia (KSA) for Hajj and Umrah pilgrimages. Trend shows a steady increase in Hajj pilgrims from 5.6 million in 2015 to 7.4 million in 2019 (Atique and Itumalla, 2020). The rise in the number of pilgrims and donation of packed and unpacked food during Hajj and Umrah continue to increase, consequently generating large amount of food waste. A nationwide field study estimated that the amount of food waste generated annually in KSA is about 427 kg per person (Baig et al., 2019).
Although, increasing amount of food discarded as waste during Hajj pilgrimage puts significant burden on the environment, it is an unexploited opportunity. Food waste is chemically composed of varied organic compounds which are classified into carbohydrates, proteins and lipids (Alibardi and Cossu, 2016). This makes food waste suitable to be processed into a stable and nutrient-rich organic fertilizer, hydrochar, and value-added chemicals. The physicochemical characteristics of food waste hydrochar obtained by hydrothermal carbonization (HTC) have an elemental carbon composition and heat content up to 73% and 31 MJ/kg, respectively (Saqib et al., 2018).
Therefore, re-utilising food waste through chemical conversion processes is essential for sustainable environmental development. The conventional food waste conversion technologies includes torrefaction (Singh and Yadav, 2019), co-hydrothermal carbonization (Alshareef et al., 2022), pyrolysis (Cao et al., 2019), and fermentation (Carmona-Cabello et al., 2020). Another conventional but recently revived technology is HTC process. This process is flexible and easily adaptable for wide range of applications.
Generally, the food waste stream of municipal solid waste in KSA contains approximately 38.4% moisture with low heating values (Nizami et al., 2017), which makes its incineration to be energetically inefficient. Compared to pyrolysis, HTC is conducted at moderate temperature and can efficiently convert wet and heterogeneous food waste into highly dense hydrochar, resembling coal in terms of its physical and chemical properties (Li et al., 2013). Yan et al., (2022) carried out the HTC of kitchen food waste mixture at various temperatures ranging between 200 and 300 °C to produce hydrochars. The HHV of the hydrochar significantly improved from 16.4 MJ/kg to 18.33–20.6 MJ/kg, which was comparable with 20 MJ/kg, specified for coal in the literature (Al-Aboosi et al., 2021). Additionally, HTC of the food waste mixture produced a hydrochar with an improved physical and chemical properties compared to hydrochar derived from the HTC of the individual component of the feedstock mixture.
Thus, HTC is a sustainable and eco-friendly tool for converting KSA food waste into value-added products like catalyst (Abdullah et al., 2020) and adsorbents (Alshareef et al., 2021). In this study, hydrochars were produced from simulated food waste (similar to Hajj and Umrah food waste) through HTC process route. The physicochemical properties and combustion kinetics of the simulated food waste and produced hydrochars were determined.
2 Materials and methods
2.1 Materials
Locally consumed food waste such as white bread, palm date, egg, banana, spent coffee, and tea were collected, oven dried for a week at 60 °C, crushed and sieved to the desired particle size (0.50–1.00 mm). Thereafter, the food samples were mixed as follows: 15% white bread, 15% palm dates (without seeds), 5% boiled eggs (without shells), 20% spent tea leaves, 20% spent coffee ground, and 25% banana peel in parts weight.
2.2 Preparation of hydrochar
10 g of the food waste feedstock sample was placed inside an automated hydrothermal vessel (170 mL). 90 mL of deionized (D.I) water was added to it and mixed to obtain a feedstock to water ratio of 10% w/w. The submerged sample was agitated at room temperature for 30 min. Thereafter, the contents inside the reactor vessel were heated at 180 °C for 120 min under 5 °C/min heating rate. Finally, the vessel was instantly cooled to ambient temperature with the help of cooling jacket around the vessel. The content was vacuum filtered with a filter paper (0.45 μm) and unwanted soluble species were rinsed out by D.I water. The recovered hydrochar were subsequently oven-dried at 60 °C till when there was no longer change in mass, indicating complete dryness. Similar procedure was repeated to produce hydrochar samples at 200 and 220 °C. The dried hydrochar samples produced at 180, 200, and 220 °C were code named as HTC180, HTC200, and HTC220, respectively.
2.3 Characterization of feedstock and hydrochar
Mass yield, energy densification ratio, and energy yield of the produced hydrochars were determined according to Eqs. 1–3:
Scanning electron microscope (SEM: Hitachi, TM3030Plus, Tabletop Microscope, Japan) at a magnification of 500✕ was used to examine the microstructure as well as the surface morphology of the food waste and derived hydrochars. Prior to SEM examination, dried samples were first gold-coated in order to obtain high-resolution images. The sample surface functional groups were ascertained using a Fourier transmission infrared spectrophotometer (FT-IR: Perkin-Elmer, Spectrum RXI, USA) in the range between 4000 and 500 cm−1.
The proximate analysis was carried out using thermogravimetric analysis (TGA: Perkin Elmer). The elemental analysis (CHNSO) for the feedstock and the produced hydrochars were obtained using the elemental analyser (Elementar, Analysensysteme GmbH, Model: VARIO EL III).
2.4 Combustion kinetic analysis of food waste and hydrochar
Combustion kinetics of food waste and hydrochar was investigated using Simultaneous Thermal Analyzer –STA 449 F5 Jupiter, Germany. The sample (10 ± 0.5 mg) was heated from 50 to 900 °C under oxygen environment at heating rate of 10 °C/min. The derivation for the combustion kinetic model using the Arrhenius approach that was used for the determination of the kinetic parameters in this work can be found elsewhere (Sait et al., 2012) and the final equation can be expressed as.
From Eq. (4), the graph of and was plotted. The slope and intercept of the linearized graph should be and respectively. Eq.4 is applicable provided the value of n is not equal to unity (1). The determined end value of n, must tally with the value of E with line of best fit representing the TGA data for the values of E and A to be acceptable.
3 Results and discussion
3.1 Food waste and hydrochar characterization
Presented in Table 1 is the moisture content of the hydrochars produced at 180, 200, and 220 °C. The moisture content of the hydrochar samples were in the range of 3–3.3% which makes it suitable for storage, transport, and combustion. The moisture content of the food waste feedstock was found to be above this range (4.63%). Li et al. (2019) found that the moisture content of lettuce feedstock did not affect the mass yield of the HTC derived hydrochar. * Oxygen was calculated by difference. M: Moisture; FC: Fixed carbon; VM: Volatile matter; A: Ash; HHV: Higher heating value.
Characteristics
Food waste
HTC180
HTC200
HTC220
Ultimate analysis (%)
C
46.18
57.99
59.86
60.29
H
5.595
4.012
2.949
2.986
N
3.751
4.783
4.900
5.012
S
0.652
1.555
1.099
0.974
O
35.82
31.66
31.19
30.74
Proximate analysis (%)
M
4.63
3.37
3.13
3.01
VM
71.33
51.78
50.89
55.48
FC
17.57
37.35
36.88
30.81
A
6.47
7.50
9.10
10.70
HHV (kcal/kg)
4,342
5,560
5,551
5,642
HHV (MJ/kg)
18.17
23.26
23.23
23.61
Fuel ratio
0.24
0.72
0.72
0.56
Mass yield
–
69.46
68.5
65.35
Energy densification ratio
–
1.28
1.28
1.29
Energy yield
–
88.91
87.68
84.30
The mass yield of the hydrochar samples produced at 180, 200 and 220 °C are illustrated in Fig. 1. The HTC of the food waste produced a mass yield of 69.46% at 180 °C, and thereafter decreased slightly to 68.5% at 200 °C. Further, the increase in temperature to 220 °C showed a significant decrease in mass yield to 65.35%. The reduction in mass yield was due to the release of volatile matter in addition to the consecutive hydrolysis and decarbonxylation reaction taking place during hydrochar development (Sharma and Dubey, 2020). 15% mass yield of formulated (Saqib et al., 2018) and real complex (Sharma et al., 2021) food waste derived hydrochars was produced under similar conditions at 220–260 °C HTC range of temperature. However, the mass yield of the hydrochars developed by HTC of apple waste from 180 to 230 °C were ranged between 53 and 73% (Suárez et al., 2020). Generally, high temperature leads to the decomposition of hydrochar into liquid and gaseous products (Sharma and Dubey, 2020).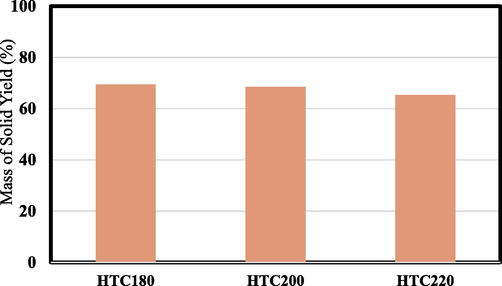
Yield of the produced hydrochars.
Comparing the elemental composition of the food waste mixture and hydrochars in Table 1, it would be observed that food waste carbonization progressed and led to an increase in the elemental carbon composition from 46.2 to 57.9% at 180 °C reaction temperature. It would be further observed a slight increase carbon content of 3.2 and 0.72% was obtained with a rise in temperature from 180 to 200 °C and then 200 to 220 °C, respectively. Previous study under similar experimental conditions showed the respective elemental carbon content of 46.70 and 61.97% for real food waste and the derived hydrochar (Akarsu et al., 2019). The slight difference noticed might be due to the difference in composition, formulation, and the origin of food waste feedstock.
The oxygen content of the food waste and hydrochars were 35.82 and 30.7–31.7%, respectively. The decrease in the oxygen content of the food waste after HTC process suggests the elimination of elemental oxygen through dehydration and decarboxylation. The magnitude of elemental oxygen from food waste obtained during current study was lower than the magnitude (45.9%) observed by Suarez et al (2020) for discarded apple residue. Also, the elemental oxygen was also less than 37–54% obtained in the works of Akarsu et al (2019) and Sharma et al (2021) on municipal food waste.
The nitrogen and hydrogen elemental content presented in Table 1, shows significant variation between the food waste and the derived carbonized hydrochar. As the HTC progressed, the nitrogen content in the food waste significantly increased from 3.8 to 4.8% at 180 °C, while the HTC experiments respectively conducted at 200 and 220 °C increased the elemental nitrogen content to 4.9 and 5.0%. This suggests the fact that de-amination of the polysaccharide-rich date palm components present in food waste to yield ammonia did not occur during the hydrochar formation process (Motavaf and Savage, 2021). In addition, the observed increase in nitrogen content might be to the fact that it remains intact during oxygen content loss. Saqib et al. (2018) however observed that the nitrogen content of prepared food waste (5.7%) was higher compared to the hydrochar (4.35%) produced at temperatures up to 200 °C.
The sulphur content for both food waste and derived hydrochar was about 0.3% lesser than the contents obtained during the current study for both hydrochars and food waste (Table 1). The relatively higher sulphur content may be a contribution from the egg component in the food waste. After combustion, nitrogen and sulphur from solid fuel creates acid that causes corrosive wear on the metal surfaces of an engine.
Table 1 also presents the proximate analysis of the food waste and hydrochars which reveals the extent of the HTC. After the HTC of the food waste at 180 °C, an expected increase in fixed carbon (FC) and ash content (A) from 17.57 to 37.35% and 6.47 to 7.50% was observed, respectively. This led to a corresponding decrease in volatile matter (VM) from 71.33 to 51.78%. Subsequent variation in the HTC temperature of the food waste at 200 and 220 °C produced hydrochars with FC, A, and VM in the range of 30.81–36.88%, 9.1–10.70%, and 50.89–55.48%, respectively. The ratio of the FC and VM which expresses the fuel ratio of all samples was found to be less than 0.8. This value is within the range of 0.44 to 1.10 specified by Sharma et al. (2021) and Sharma and Dubey (2020) for hydrochars that could be exploited as fuels and co-fuels in combustion systems or power plants. However, the ash content (7.50–10.70%) of the hydrochars was high compared to the food waste precursor (6.47%) and may lead to slagging and fouling in the boiler when used as fuel.
Another important characteristic of fuel is the HHV which is also presented for the prepared food waste and HTC derived hydrochar samples in Table 1. The HHV for the prepared food waste was 18.17 MJ/kg, which is closer to 18.7 and 18.3 MJ/kg obtained for apple (Suárez et al., 2020) and municipal (Akarsu et al., 2019) food waste, respectively. As the HTC temperature was increased from 180 to 200 °C and then to 220 °C, there was a total increment of 1.59% from 23.23 to 23.61%. This increment is low when compared to the study on apple waste mentioned earlier where a HHV increment of 25.3% from 23.7 to 29.7% was recorded. This may be due to the relatively higher temperature (230 °C) and longer dwelling time (240 min) used during the study.
Energy yields of the produced hydrochars were determined according to Eq. (2) and were used to determine the preserved densification ratio defined as Eq. 3 and listed in Table 1. The trend already observed for fixed carbon was similarly followed for the energy yield which decreased from 88.91 to 84.30% as the HTC temperature increased. Similar trend was observed by Saqib et al. (2018), where the energy yield decreased from 12.81 to 10.92%. Yet, it would be clearly observed that both the decreased extent of energy yield and the energy yield of the hydrochar obtained in this study was higher. While the decreased extent of the energy yield could be as a result of the longer residence time (2 h) used, the relatively very high energy yield obtained, may be due to the palm date component of the food waste feedstock. Depending on the variety, date palm has an approximate gross energy ranging between 3523.3–4251.5 kcal/kg (Chandrasekaran and Bahkali, 2013) which is 81.1–97.9% of the net calorific value of the food waste mixture used in this study. It is therefore quite likely that palm dates may contain larger number of high energy C–C bonds and smaller amounts of lower energy H-C and O-C bonds, thus resulting to overall high energy yield.
The variation in densification ratio and energy yield of hydrochar with HTC temperature are presented in Table 1. The observed energy densification ratio for hydrochar was ∼1.28 and close to the value of 1.38 obtained for municipal food wastes (Akarsu et al., 2019). Energy densification through HTC increases the amount of energy stored in food waste in order to improve its energetic properties. The energy yield of food waste and the energy densification ratio of hydrochar largely depend on the bulk density and chemical composition of the food waste. These parameters must be determined if a hydrochar derived from a food waste feedstock is to be used as fuel. Energy densification of food waste using HTC processes increases hydrochar energy density for more efficient transport. In summary, it is clear from Table 1 that as both the mass and energy yield of the hydrochar decreased both the energy densification ratio and HHV increased. Thus, the HTC220 had the highest heating value (23.61 MJ/kg), while food waste had the least (18.17 MJ/kg).
Fig. 2 is the Van Krevelen diagram where the oxygen-carbon (O/C) and hydrogen-carbon (H/C) ratios of the food waste and hydrochars were plotted. It can be seen clearly that both H/C (0.39) and O/C (0.6) ratios of the hydrochars were low compared to the ratios obtained for raw food waste. These ratios were lowest for HTC220 and this accounted for the close proximity of HTC220 to the region representing lignite on the diagram. This implies that HTC of the food waste leads to a gradual upgradation into the lignite rank. Thus, both reductions in the H/C and O/C with increase in HTC temperature may be the occurrence of dehydration and decarboxylation (Śliz and Wilk, 2020). This result is similar to the finding of Saqib et al. (2018) where there was a steady reduction of the H/C and O/C ratios from 0.115 to 0.096 and 0.39 to 0.23 as the HTC temperature was elevated from 200 to 300 °C, respectively.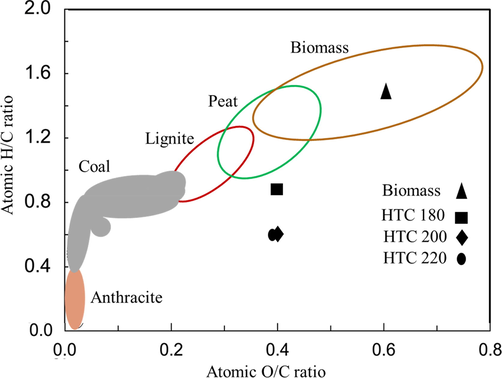
The Van Krevelen diagram comparing the feedstock (biomass) and hydrochars (HTC180, HTC200 and HTC220).
Reduction in H/C and O/C ratios may be due to the decarboxylation reaction that took place during the carbonization process (Sevilla et al., 2011). According to HTC process at elevated temperatures which advances with dehydration reactions thereby eliminating oxygen from the initial raw biomass structure, giving rise to a decrease in the O/C ratio (Maniscalco et al., 2020). On the other hand, decarboxylation during HTC removes carboxyl and carbonyl groups, thus, leading to a drop in O/C and H/C ratio of the food waste mixture (Smith et al., 2016).
This work further studied the variation of physical property of food waste and hydrochar samples in terms of their appearance and texture. Fig. 3, inset shows the colour variation of raw food waste at different HTC temperatures. It was observed that at higher temperature, the food waste (Fig. 3a, inset) changes from dark brown colour to brownish-black hydrochars (Fig. 3 b–d, inset). The dried hydrochar retained its dense consistency and lustreless appearance which indicates a mild coalification of the food waste to lignite.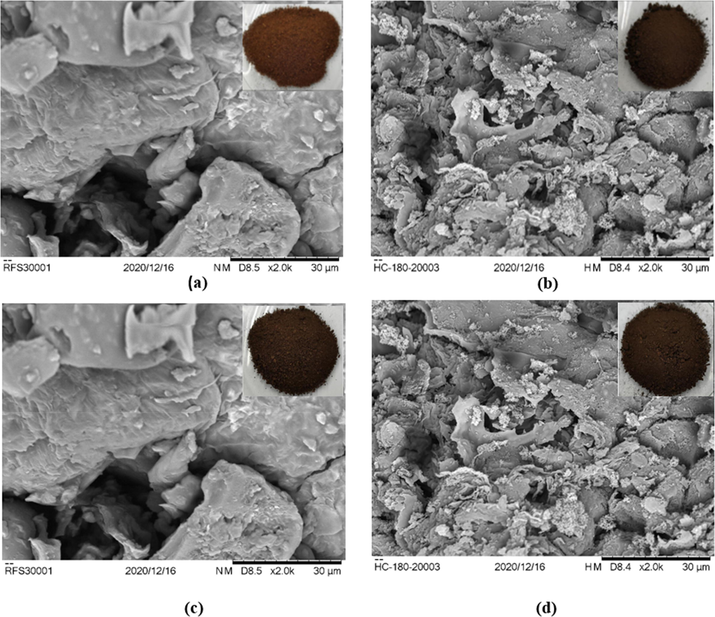
SEM (Inset: photographic images) (a) Feedstock (b) HTC180 (c) HTC200 (d) HTC220.
A detailed SEM analysis of the food waste and hydrochars reveal insightful information on change of the structural morphology of the food waste during HTC (Fig. 3). The magnified SEM images show slight changes in the surface structure of food waste and the hydrochars due to lignin loss arising from degradation and depolymerisation reactions taking place during the hydrochar formation process. Microscopic examination of food waste presented a surface structure that was densely packed, impervious, and fixed. After HTC, the surface structures of HTC180 and HTC200 were altered which may be consequence of the collapse of chemical structures of the cellulose and lignin content in the food waste. The sheet, debris and crack-like surface structure detected on the SEM image of HTC220, may be due to further volatile releases and elimination of the hydroxyl, ketone, and aldehyde functional groups present in the carbohydrate constituent of the food waste. Sheet, debris and crack-like surface structures were similarly observed on the SEM images of lignite in the investigation carried out by Tang et al. (2016).
Different food wastes have been found to have distinct surface structure under varied operating conditions (Saqib et al., 2018) and some of these differences in surface structure for different food wastes are reported in the literature. A three-component food waste with high carbohydrate content was hydrothermally carbonized at 200 °C for 6 h. The microstructural analysis of the surface of the derived hydrochar revealed a carbon microsphere (Tradler et al., 2018). Another food waste with high carbohydrate content was hydrothermally carbonized at 220 °C for 1 h. The flakey-like microstructure of the food waste was metamorphosed to a hydrochar with carbon spheres and microsphere-like microstructure after HTC. The surface structure metamorphosis was imaginably due to condensation of the soluble product and consecutive polymerization reaction (Sharma and Dubey, 2020). Steamed bread was also hydrothermally carbonized at 260 °C and reaction time of 3 h into a hydrochar. Trace quantities of sphere-like particles were noticed on its microstructure which was imaginably due to carbonization of its constituent starch (Feng et al., 2019).
FT-IR analysis was carried on the food waste and hydrochar samples in order to ascertain the functional groups that may be present on their respective surface (Fig. 4). The FT-IR spectra showed a disappearance and shift of some absorption bands. A broad band located on the FT-IR spectrum range of 3200–3400 cm−1 may be assigned to the hydroxyl group functional group. For both the raw food waste and hydrochar samples, absorption band at frequencies between 2852 and 2921 cm−1 were due to the presence of C–H stretch of aliphatic methylene group. These absorption bands may be evidence of contributions from spent coffee and palm dates contained in the food waste mixture. The bands around 1700 to 1740 cm−1 in the raw food waste sample can be attributed to the C=O stretch of aldehydes usually contained in palm dates (Bharath et al., 2020). The disappearance of C=O bands after HTC reveals that the carboxylic groups present in palm dates component of the food waste mixture might have been converted to carbon dioxide and polysaccharide pieces (Robbiani, 2013). The disappearance of the C–H band implies that the aliphatic structure of the food waste was not preserved during HTC.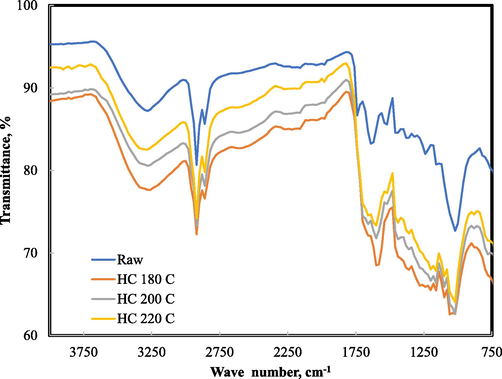
FTIR specta for food waste, HTC180, HTC200, and HTC220.
The peak located at 1630 cm−1 in raw food sample was widely accepted to be due to water. This peak shifted to a lower frequency at 1602 and 1607 cm−1 after HTC process. The aromatic ring related vibrations between 1500 and 1600 cm−1 may be due to the presence of C=C stretch. The aromatic ring -related vibrations of C=C stretch suggests that Maillard reaction between the carbohydrate and egg components in the food waste led to an increased aromatisation of transient species. This reaction could have been responsible for the increase in the atomic nitrogen in the hydrochar samples obtained from the elemental test analysis.
The presence of band at ∼1455 cm−1 was good evidence for =CH2 stretch of methylene, while the band around 1376 cm−1 was associated with –CH3 bend (methyl). The presence of absorption bands between 1240 and 1070 cm−1 suggests the presence of C-O-C stretching of esters. The vibration from 1200 to 900 cm−1 in both the raw food waste and hydrochar samples shows the presence of C-O-C linkage present in bread and other baked biomass.
3.2 Combustion behaviour and kinetics
The thermogravimetric analysis was applied to study the food waste combustion behaviour and Fig. 5a presents the plot of TG and DTG versus temperature for feedstock waste. Evidently, the combustion of the food waste started from 59-159 °C where a 4.6 wt% weight loss was recorded within the temperature range. The recorded weight loss may be due water evaporation. The combustion of the feedstock advanced in distinct stages as seen in the DTG curves. The DTG curve for food waste reveals three peaks within a temperature ranging from 50 to 383 °C. The maximum weight loss rate recorded within this temperature range was 4.6%/min which corresponds to 47.2% weight loss. At 750 °C, where there was complete conversion of food waste to elemental carbon, 6.68% solid residue in the form of ash was left.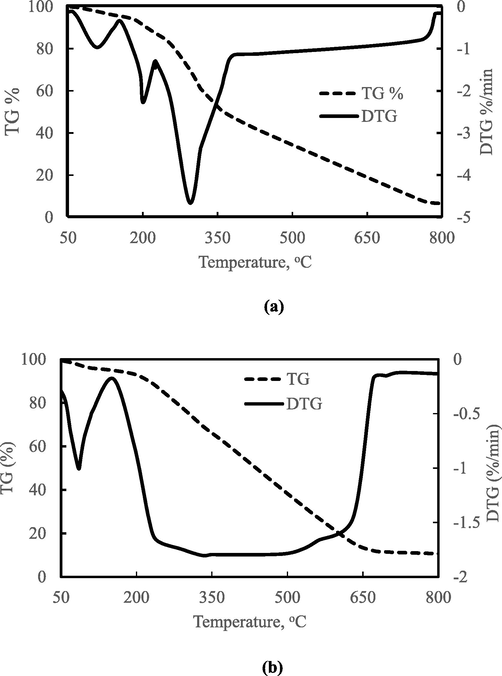
TG and DTG curve for (a) food waste, and (b) HTC220.
The combustion of mixture of the food waste observed by the DTG result showed a three-peak combustion process. The food waste mixture may be characterized as fruity (tea leaves and banana peels), woody (palm dates and spent coffee) and edible (bread and egg) biomass. Thus, these ingredients present in the food waste contain different amounts of hemicellulose, cellulose, and lignin.
The first peak of food waste combustion at 106 °C is believed to be the effect of water evaporation of the food waste mixture or combustion of the high volatile content white bread and egg component of the food waste. The second combustion peak at 201 °C is imagined to be the effect of combustion of the bread and egg volatiles and banana peel/spent tea leaves biomass char. The third combustion peak of the food waste at 293 °C is linked with the combustion of palm dates and spent coffee char. The observed maximum rates of mass loss occurring at higher temperatures in peak 3 was attributed to combustion of palm dates and spent coffee because of its woody nature or relatively high lignin content.
For HTC220 sample, the TG and DTG versus temperature plot, displayed in Fig. 5b showed significant variation in weight loss. As seen in the DTG plot, the peak temperatures for the HTC220 were 84.4 and 330 °C for peaks 1 and 2, respectively. In a similar work carried out on lignite samples (Mo et al., 2020) observed peak at 95 °C and other peak was located between 105 and 350 °C on TG curves. The first and second peaks were attributed to the occurrence of water evaporation and simultaneous oxidation/devolatilization reaction respectively. It was noted that the number of DTG peaks for raw food waste reduced from 3 to 2 after HTC. The observed reduction of DTG peaks after HTC-220 may be due to diminished volatile matter content, degraded lignin structures and enhanced fixed carbon content of the hydrochar. The second DTG peak of HTC220 was very broad (indicating a gradual combustion reaction of the char) compared to the sharp nature of the first peak which reveals the occurrence of a rapid or flash combustion process.
The TG plot of the hydrochar (Fig. 5b) showed the highest drop in weight of 53.9 wt% within the temperature range of 330–670 °C. The initial degradation temperature for the HTC was around 96.4 °C, but it was delayed for feedstock from 154 to about 250 °C. This could be due to the higher proportion of moisture contained in the food waste was relative to the hydrochar. The combustion of HTC220 can be described as a two-stage process based on the peak identified on the DTG plot. The first stage of combustion of HTC220 was observed in the 50–170 °C temperature range, while the second stage of the combustion stage was noticed between 170 and 700 °C temperature.
The activation energies for food waste feedstock and hydrochars corresponding to each peak earlier detected are listed in Table 2. The activation energy of the feedstock was found to be in range of 29.98 to 33.51 kJ/mol. Judging from the kinetic plots (Fig. 6), the Arrhenius equation model reasonably describes the combustion reaction of both food waste feedstock and hydrochars. The respective activation energies of the feedstock were 33.51, 24.02, and 29.98 kJ/mol for peaks 1, 2, and 3. The fluctuating trend of the activation energy across the three peaks indicate that the combustion of food waste and hydrochars occurring at different stages involve different mechanism.
Sample
Peak
Activation energy, E (kJ/mol)
Reaction order, n
Frequency factor, A (1/sec)
Food waste
1
33.51
2.9
0.5651
2
24.02
1.2
0.0003
3
29.98
1.9
0.0228
HTC220
1
25.47
3.0
0.113604
2
16.52
0.9
0.073684
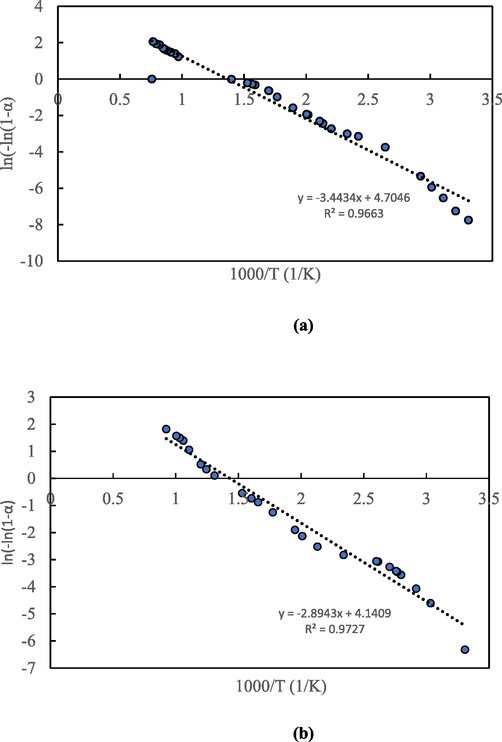
Kinetic plots for (a) food waste, and (b) HTC220.
Two peaks were noticed for the hydrochar and the respective activation energies calculated for the first and second peaks were 25.47 and 16.52 kJ/mol. The reduction in activation was observed by Saqib et al. (2018) where the activation energy of the hydrochars prepared under similar conditions were reduced from 56.78 to 47.38 kJ/mol from first peak to second peak. This reduction in activation energy in both feedstock and hydrochar sample may be attributed to the catalytic effect of inorganic species present in the hydrochar (Smith et al., 2016). However, in another related study on combustion of lignite samples, the activation energy of hydrochar increased 59.95 to 69.49 kJ/mol with increase in HTC temperature from 270 to 330 °C (Mo et al., 2020).
It can be inferred in Table 2 that HC220 showed an early liberation of energy in contrast to raw food waste during combustion with activation energy of 25.47 kJ/mol and 16.52 kJ/mol in contrast to 33.51 kJ/mol and 24.02 kJ/mol for feedstock in peaks 1 and 2, respectively. This indicates that the hydrochar may be mixed with low rank in order to reduce its ignition temperature. Similar view was asserted by Gupta et al. (2020) based on an outcome of an investigation which revealed that the activation energy of the real food waste was 82 kJ higher than the derived hydrochar at 200 °C.
4 Conclusions
Hydrochars produced from simulated food waste (similar to Hajj and Umrah food waste) through HTC process route has been carried out. The results showed that with increase in temperature, the mass and energy yields of the hydrochars decreased, while the energy densification ratio and HHV of hydrochars increased. Furthermore, the hydrochar produced at 220 °C had the HVV of 23.61 MJ/kg, which was a significant improvement compared to the HHV of 18.17 MJ/kg, obtained for food waste precursor. The combustion kinetic showed that the energy required to start the combustion reaction for hydrochar (25.47 kJ/mol) was lower compared to the energy (33.51 kJ/mol) required for a reaction with raw food waste.
Hence, the results conclude that the reported strategy could be an effective alternate to convert Hajj and Umrah food waste to a value-added solid fuel.
Acknowledgements
This project was funded by the National Plan for Science, Technology and Innovation (MAARIFAH), King Abdulaziz City for Science and Technology, Kingdom of Saudi Arabia (Award Number 14-ENV665-02).
Declaration of Competing Interest
The authors declare that they have no known competing financial interests or personal relationships that could have appeared to influence the work reported in this paper.
References
- Bifunctional nano-catalyst produced from palm kernel shell via hydrothermal-assisted carbonization for biodiesel production from waste cooking oil. Renew. Sustain. Energy Rev.. 2020;137:110638
- [CrossRef] [Google Scholar]
- Sustainable valorization of food wastes into solid fuel by hydrothermal carbonization. Biores. Technol.. 2019;292:121959
- [CrossRef] [Google Scholar]
- Effects of carbohydrate, protein and lipid content of organic waste on hydrogen production and fermentation products. Waste Manag.. 2016;47:69-77.
- [CrossRef] [Google Scholar]
- Renewable ammonia as an alternative fuel for the shipping industry. Curr. Opin. Chem. Eng.. 2021;31:100670
- [CrossRef] [Google Scholar]
- Simultaneous co-hydrothermal carbonization and chemical activation of food wastes to develop hydrochar for aquatic environmental remediation. Biores. Technol.. 2022;347:126363
- [CrossRef] [Google Scholar]
- Upcycling olive oil cake through wet torrefaction to produce hydrochar for water decontamination. Chem. Eng. Res. Design. 2021;170:13-22.
- [Google Scholar]
- Understanding and addressing waste of food in the Kingdom of Saudi Arabia. Saudi J. Biol. Sci.. 2019;26(7):1633-1648.
- [CrossRef] [Google Scholar]
- Systematic production and characterization of pyrolysis-oil from date tree wastes for bio-fuel applications. Biomass Bioenergy. 2020;135:105523
- [CrossRef] [Google Scholar]
- Facile preparation of activated carbon foam via pyrolysis of waste bread under CO2 atmosphere. Biomass Conv. Bioref.. 2019;9:521-529.
- [CrossRef] [Google Scholar]
- Biodiesel production using microbial lipids derived from food waste discarded by catering services. Biores. Technol.. 2020;323:124597
- [CrossRef] [Google Scholar]
- Valorization of date palm (Phoenix dactylifera) fruit processing by-products and wastes using bioprocess technology – Review. Saudi J. Biol. Sci.. 2013;20(2):105-120.
- [CrossRef] [Google Scholar]
- Fabrication of hydrochar based on food waste (FWHTC) and its application in aqueous solution rare earth ions adsorptive removal: Process, mechanisms and disposal methodology. J. Clean. Prod.. 2019;212:1423-1433.
- [CrossRef] [Google Scholar]
- Investigation on hydrochar and macromolecules recovery opportunities from food waste after hydrothermal carbonization. Sci. Total Environ.. 2020;749:142294
- [CrossRef] [Google Scholar]
- Understanding food loss and waste-why are we losing and wasting food? Foods. 2019;8(8):297.
- [CrossRef] [Google Scholar]
- Hydrothermal carbonization of food waste and associated packaging materials for energy source generation. Waste Manag 2013
- [CrossRef] [Google Scholar]
- Correlations between the physicochemical properties of hydrochar and specific components of waste lettuce: Influence of moisture, carbohydrates, proteins and lipids. Biores. Technol.. 2019;272:482-488.
- [CrossRef] [Google Scholar]
- Hydrothermal carbonization as a valuable tool for energy and environmental applications: a review. Energies. 2020;13(16):4098.
- [CrossRef] [Google Scholar]
- Effect of process variables on food waste valorization via hydrothermal liquefaction. ACS EST Engg.. 2021;1(3):363-374.
- [CrossRef] [Google Scholar]
- Study on combustion performance of hydrothermally dewatered lignite by thermal analysis technique. Fuel. 2020;285:119217
- [CrossRef] [Google Scholar]
- Developing waste biorefinery in Makkah: a way forward to convert urban waste into renewable energy. Appl. Energy. 2017;186:189-196.
- [CrossRef] [Google Scholar]
- Robbiani, Z., 2013. Hydrothermal carbonization of biowaste / fecal sludge: conception and construction of a HTC prototype research unit for developing countries. Master Thesis, April, p. 88.
- Pyrolysis and combustion kinetics of date palm biomass using thermogravimetric analysis. Biores. Technol.. 2012;118:382-389.
- [CrossRef] [Google Scholar]
- Physicochemical, structural and combustion characterization of food waste hydrochar obtained by hydrothermal carbonization. Biores. Technol.. 2018;266:357-363.
- [CrossRef] [Google Scholar]
- Hydrothermal carbonization of biomass as a route for the sequestration of CO2: chemical and structural properties of the carbonized products. Biomass Bioenergy. 2011;35(7):3152-3159.
- [CrossRef] [Google Scholar]
- Co-hydrothermal carbonization of food waste with yard waste for solid biofuel production: hydrochar characterization and its pelletization. Waste Manag.. 2020;118:521-533.
- [CrossRef] [Google Scholar]
- Food waste hydrothermal carbonization: Study on the effects of reaction severities, pelletization and framework development using approaches of the circular economy. Biores. Technol.. 2021;333:125187
- [CrossRef] [Google Scholar]
- Evaluation of the physico-chemical development of kitchen food wastes through torrefaction - a biodiversity case study. Biomass Conv. Bioref.. 2019;11:1353-1362.
- [CrossRef] [Google Scholar]
- Comprehensive investigation of hydrothermal carbonization: energy potential of hydrochar derived from Virginia mallow. Renew. Energy. 2020;156:942-950.
- [CrossRef] [Google Scholar]
- Fate of inorganic material during hydrothermal carbonisation of biomass: Influence of feedstock on combustion behaviour of hydrochar. Fuel. 2016;169:135-145.
- [CrossRef] [Google Scholar]
- Hydrothermal carbonization as a sustainable strategy for integral valorisation of apple waste. Biores. Technol.. 2020;309:123395
- [CrossRef] [Google Scholar]
- Fractal and pore structure analysis of Shengli lignite during drying process. Powder Technol.. 2016;303:251-259.
- [CrossRef] [Google Scholar]
- Hydrothermal carbonization as an all-inclusive process for food-waste conversion. Biores. Technol. Reports. 2018;2:77-83.
- [CrossRef] [Google Scholar]
- “UNEP Food Waste Index Report 2021 | UNEP - UN Environment Programme.” https://www.unep.org/resources/report/unep-food-waste-index-report-2021 (accessed Mar. 06, 2021).
- Comprehensive experimental study on energy conversion of household kitchen waste via integrated hydrothermal carbonization and supercritical water gasification. Energy. 2022;242:123054
- [CrossRef] [Google Scholar]
Appendix A
Supplementary data
Supplementary data to this article can be found online at https://doi.org/10.1016/j.jksus.2022.101941.
Appendix A
Supplementary data
The following are the Supplementary data to this article:


