

Translate this page into:
Oxovanadium(IV) complex of 8-hydroxy quinoline and 3-acetyl-6-methyl-2H-pyran-2,4(3H)-dione: Experimental, theoretical and antibacterial evaluation
⁎Corresponding author. mirjanmohammad@gmail.com (J.M. Mir)
-
Received: ,
Accepted: ,
This article was originally published by Elsevier and was migrated to Scientific Scholar after the change of Publisher.
Peer review under responsibility of King Saud University
Abstract
Abstract
Streptococcus pyogenes and E. coli are causative agents of millions of illness. In conspicuous interests to design antibiotic compounds against these bugs, a novel oxovanadium(IV) complex containing dehydroacetic acid (3-acetyl-6-methyl-2H-pyran-2,4(3H)-dione) and 8-hydroxy quinoline was synthesized and characterized. Elemental analyses, thermal degradation, molar conductance, magnetic susceptibility, EPR, mass spectrometry and FT-IR spectral techniques were used to formulate the compound. Theoretical aspects like geometrical optimization, molecular charge density plots and DFT based spectroscopy were also invoked using Gaussian 09 software package by the help of Becke-3-Lee-Yang-Parr (B3LYP) hybrid exchange-correlation functional and the standard basis set LANL2DZ. At each step of characterization, theoretical and experimental results were compared to arrive at the best fit results. From the different spectral analyses a suitable octahedral structure can be proposed for the complex. In addition to formulation, the complex and dhaH were biologically tested against some bacterial strains. The target complex was found less bactericidal against E. coli, but the results have shown satisfactory bacterial activity against S .pyogenes.
Keywords
Oxovanadium
DFT
Spectroscopy
Bactericidal

1 Introduction
Vanadium complexes generally exist in IV and V oxidation states (Singh et al., 2013). The complexes are well known for possessing excellent biological activity (Mir et al., 2017a,b). During the design of these complexes, compounds falling in the range of small molecular weights are preferably given attention (Sasmal et al., 2008). Novel anti-diabetic medicines/drugs are designed from vanadium (Liu et al., 2014). Under such curiosity, treatment for both the general types of diabetes in various animal models is under trials (Thompson and Orvig, 2006). Two well known complexes, despite some toxicity, bis(maltolato)Oxovanadium(IV) (BMOV) and bis(ethylmaltolato)Oxovanadium(IV) (BEOV) have been proven for hyperglycemic action (Maurya et al., 2014). Hence, great efforts are in practice to develop potent biological relevant molecules of this suit. So, many oxovanadium(IV) complexes having varied coordination modes have been thus prepared and put forth for the respective examination (Malik and Mir, 2018; Früh et al., 2014).
In order to synthesize an applicable novel metallic complex, it has always been a meticulous job to select the multifold significant organic-framework. In the present case, dehydroacetic acid and 8-hydroxy quinoline represent compounds of diverse importance. The pyrone derivative, dhaH is used for preparation of a large number of heterocyclic compounds bearing well pronounced anti-microbial properties (Jilalat et al., 2017). The use of this compound as a food preservative justifies its human-friendly nature (Vishwakarma et al., 2016). On the other side, quinoline derivatives are also potent therapeutic compounds Kumar et al., 2009). Their anti-protozoal, antiseptic and antiperspirant properties are enough to attract researchers. Therefore, much interest has been directed towards synthesis and characterization of complexes of such type of ligands (Mandewal et al., 2016). In the search for more efficacious insulin-mimic complexes, the targeted ligand-complexation can also be proposed to be an addition to the same class of compounds (Maurya et al., 2015).
In the present era, molecular characterization is validated by theoretical evaluation of a problem. Density functional theory (DFT) is considered as a strong theoretical front to complement with experimental formulation. Almost every spectral technique can be justified by taking a tally with DFT results. Hence it results in a wide use of computational methods. The technique is considered as a substitute to X-ray crystallography for the complexes where crystal-growth fails. Many studies are evident that it is a powerful method for predicting and solving geometrical problems of a known or unknown compound (Micera and Garribba, 2011a,b; Garribba et al., 2011; Rodrigues, 2011).
In prominent evidences in support of the importance of vanadium complexes and the utility of computational DFT studies, a systematic approach to prepare and characterize mixed ligand complex of oxovanadium(IV) containing 3-acetyl-6-methyl-2H-pyran-2,4(3H)-dione (dhaH) and 8-hydroxy quinoline (8-hqH) as ligands was aimed. The respective biological, thermal and DFT investigations are the main parts of the study.
2 Experimental
2.1 Materials and methods
Vanadium sulphate pentahydrate (Aldrich chemical Co. USA), 3-acetyl-6-methyl-2H-pyran-2,4(3H)-dione (dhaH) (Merck Specialties Pvt., Ltd. Bombay), 8-Hydroxy quinoline, (Merck) 2-picolinic acid and DMF (Thomas Baker (Chemical) Ltd. Mumbai), ethanol (Bengal Chemical and Pharmaceuticals Ltd.) were used as received. All the chemicals were of analytical reagent grade.
2.2 Analysis
Elemental composition (CHN) was determined micro-analytically at S.A.I.F., I.I.T. Powai, Mumbai. The vanadium content was determined by following a slightly modified procedure reported elsewhere (Maurya et al., 2015). 50 mg weight of the sample placed in a silica crucible was decomposed by mixing in 2–3 mL of concentrated HNO3 and heating. An orange colored solid (V2O5) which was obtained was allowed to get completely dissolved in a minimum amount of dilute H2SO4, and the resulting solution was diluted to 100 mL by adding distilled water. Volumetrica estimation of vanadium was finally done using 0.02 M KMnO4 solution as an oxidizing agent in the presence of sulfurous acid (H2SO3).
THERMO Finnigan LCQ Advantage max ion trap mass spectrometer, Bruker alpha-T model FT-IR spectrophotometer and Varian Cary 5000 double beam UV–Vis spectrophotometer were used to record mass, IR and electronic spectra, respectively. Cyclic voltammetry was carried out using tetra butyl ammonium perchlorate (TBAP) as a supporting electrolyte on epsilon BASI. Magnetic, conductance and decomposition records were made on SHERWOOD Scientific UK, Toshniwal Conductivity Bridge and melting point apparatus (Kumar Industries, Mumbai), respectively. Thermogravimetric analysis and EPR spectrum were recorded at SAIF, IIT Mumbai.
Theoretical aspects of the complex was studied using density functional theory (DFT) level under B3LYP/6-311+G specified for nonmetallic atoms and B3LYP/LANL2DZ for vanadium atom. The Gauss View 5.0, a graphical interface associated with Gaussian program was carefully visualized to identify the related vibrational modes for the respective IR calculations (GaussView 5.0). After obtaining zero imaginary frequency in the respective FT-IR simulation it is ascertained that the optimized geometry is a local minima. In addition to frequency calculations, various charge density plots confined to different theories were also evaluated to deepen the theoretical speculation of chemical descriptors. The energies of the various molecular orbitals, especially highest occupied molecular orbital (HOMO) and lowest unoccupied molecular orbital (LUMO) levels along with the determination of intramolecular charge transfer (ICT) represents the theoretical route adopted in the investigation (Frisch et al., 2010).
2.3 Preparation of mixed-ligand complex
0.001 M dehydroacetic acid (0.168 g) dissolved in 10 mL of ethanol was mixed with 10 mL ethanolic solution of 0.001 M 8-hydroxy quinoline, (0.145 g). The resulting binary solution was slowly added to the solution of 0.001 M VOSO4.5H2O (0.253 g) in 10 mL of ethanol-water (1:1) under constant stirring at 50 °C. A coloured solid began to start precipitating slowly after the ternary mixture was allowed to reflux for 2–3 h, which was finally suction filtered, repeatedly washed with 1:1 ethanol-water and dried in vaccuo.
3 Results and discussions
The mixed-ligand oxovanadium(IV) complex in the present was synthesized by the process shown below: Where, dhaH = dehydroacetic acid, LH = 8-hydroxyquinolene. The complex was found to be air stable solid substance and the respective solubility tests in various solvents showed that the compound was unable to get dissolved in most of the common organic solvents but showed solubility in DMF, DMSO, and acetonitrile.
Analytical data: Empirical formula: C15H17NO7V, Molecular weight: 396, Color: Venetian Green, Yield(%): 65, Melting Point(°C): 300, µeff(B.M.): 1.72, Molar conductance (Ω−1 cm2-mol−1): 19.7, Elemental analysis Calculated(Observed)%: C 51.53 (56.30), H 3.82 (3.75), N 3.53 (3.58), V 12.86 (12.80)
The proposed structure of the complex is shown in Scheme 1.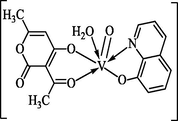
2D-Structure of Complex.
3.1 Infrared spectral studies
The FTIR analysis of the complex shows that the complex exhibits a strong band in the range 640–655 cm−1, which can be assigned to V—O. The ν(V⚌O) is found at 974–975 cm−1 suggesting the absence of V⚌O⋯V⚌O unit (Maurya et al., 2001). The broad band located at 3418 cm−1 in the IR spectrum of dhaH ligand which is due to hydrogen bonded ν(OH), and a medium band centered at 1236 cm−1 representing ν(C—O) (enolic) suggests the enolic form in solid state. The band due to the ν(OH) of the ligands disappears in the respective complex after deprotonation. The appearance of strong band in the range 1644–1662 cm−1 may be assigned to ν(C⚌N) (Mir et al., 2016). Moreover, the appearance of a strong band at ∼1106 cm−1 in the complex suggests the coordination of the hydroxyl oxygen of the ligand. These results support the bidentate coordination of 8-hydroxyquinolene. The complex also shows a broad band vibrational peak at 3441 cm−1 assignable to ν(OH) mode due to the coordinated H2O (Maurya et al., 2015). The respective IR spectrum is given in Fig. 1. Fig. 2 is the theoretical FTIR spectrum of the complex. On comparing the results discussed in the experimental section of this sort, it can be established that the DFT-based infra-red spectral data is in excellent agreement with the results being reported.![Experimental FT-IR spectrum of [VO(dha)(8-hq)(H2O)]](/content/185/2019/31/4/img/10.1016_j.jksus.2018.03.023-fig3.png)
Experimental FT-IR spectrum of [VO(dha)(8-hq)(H2O)]
![Theoretical FT-IR spectrum of [VO(dha)(8-hq)(H2O)]](/content/185/2019/31/4/img/10.1016_j.jksus.2018.03.023-fig4.png)
Theoretical FT-IR spectrum of [VO(dha)(8-hq)(H2O)]
3.2 Magnetic measurements and conductance measurements
The observed value of the magnetic moment of the complex is 1.72B.M., as expected for magnetically dilute oxovanadium(IV) complexes. Similarly, experimentally determined molar conductance measured in 10−3 M dimethylformamide (DMF) solution of the complex gestures the non-electrolytic behaviour (Popova et al., 2015).
3.3 Mass spectrometry
The electron spray ionization (ESI) (Fig. S1) mass spectral analysis was carried out to confirm the molecular formula of the complex. The representative compound [VO(dha)(8-hq)(H2O)] gives spectral peaks at 396, 168, 144 m/z indicating [molecular ion]+, (396), [dha + H]+ = 169 and [8hq + H]+ = 144. The m/z 195 can be because of oxovanadium binded cation with quinoline moiety (devoid of hydroxyl oxygen). The results are in good agreement with the proposed molecular composition of the complex.
3.4 Electronic spectral studies
Fig. 3 shows the electronic spectral record of the representative complex [VO(8-hq)(dha)H2O] carried out in 10−3 M DMSO solution. The high intensity peak(s) in the region 263 nm are attributed to intra ligand n → π∗/π → π∗ type transitions. The lower intensity peak(s) around 402 nm may be assigned to ligand to metal charge transfer (LMCT) transitions (Maurya et al., 2002). The theoretically generated electronic spectrum (Fig. 4) using the TD-DFT method and DMSO as the solvent at B3LYP/LANL2DZ level of theory shows mainly six bands at 473, 482, 489, 613 and 652 nm. The overall analysis shows close agreement only confined to 400 nm region. The reason of poor agreement can be the less reliability of the theory used for the computation.![Experimental electronic spectrum of complex [VO(8-hq)(dha)H2O]](/content/185/2019/31/4/img/10.1016_j.jksus.2018.03.023-fig5.png)
Experimental electronic spectrum of complex [VO(8-hq)(dha)H2O]
![TD-DFT Theoretical electronic spectrum of complex [VO(8-hq)(dha)H2O]](/content/185/2019/31/4/img/10.1016_j.jksus.2018.03.023-fig6.png)
TD-DFT Theoretical electronic spectrum of complex [VO(8-hq)(dha)H2O]
3.5 Thermogravimetric analysis
Thermogravimetric curve of the compound, [VO(dha)(8-hq)(H2O)] is given in Fig. S2. The analysis was carried out in the temperature range of 20–1000 °C at the heating rate of 10 °C/min. Despite the fact that the complex did not show a usual decomposition pattern as expected for the complexes under question. But it can be stated that simultaneous mass losses can also happen under thermal analysis. This unexpected behaviour can be correlated with the similar type of results reported elsewhere (Diaz et al., 2015; Valenzuela et al., 2013). The weight loss of 48.77% at 25–370 °C, can be corresponded to the removal of one molecule of coordinated water (Dodd et al., 1987) and one molecule of dehydroacetic acid anion per molecule of the complex (calculated weight loss = 46.71%). The further raise of temperature under the same heating rate shows two more weight losses, whose correlation could not be made separately. However, the mass degradation in the temperature range 370–820 °C (observed 22.51%) (calcd. 27.7%, can be considered the loss for 1 mol of 8-hq ligand roughly estimated to the removal of one coordinated group. The final residue confined to an invariable weight (observed 28.88%) over 820 °C roughly corresponds to V2O5 (calcd. 25.59%).
3.6 Electron paramagnetic resonance studies
From the EPR Spectrum of the complex shown in Fig. 5, the confirmation of unpaired electron in the vicinity of I = 7/2 of its own mother nucleus gives (2 × 7/2 + 1) 8 line spectrum. The observed spectral parameters for this compound are: g⊥ 2.030, g|| 2.0806, gav = 2.046. The observed gav value deviates from the free ion value 2.0036, indicates that the complex is appreciably covalent. The respective data has been tabulated in Table 5. The g|| and g⊥ values in the complex ensues the respective covalent nature (Dutta and Syamal, 1993). The features of spectrum indicates monomeric oxovanadium(IV) complex (Maurya et al., 2002).![ESR spectrum of complex [VO(dha)(8-hq))(H2O)] (1).](/content/185/2019/31/4/img/10.1016_j.jksus.2018.03.023-fig7.png)
ESR spectrum of complex [VO(dha)(8-hq))(H2O)] (1).
3.7 Electrochemical properties
To understand the spectral and structural changes that occur on redox activity of the complex, cyclic voltammetry was invoked. The analysis was carried out in the DMSO vs Ag/AgCl reference electrode at scan rate of 100 mVs−1 under the potential range of -1500 to + 1500 mV in the co-existence of 0.1 M of tetrabutylammonium perchlorate (TBAP) as a supporting electrolyte. The results have shown that the vanadyl complex exhibits one electron quasi-reversible transfer process with a reduction peak at Epc = −447 to −471 and corresponding oxidation peak at Epa = −295 to −322 (Fig. S3). Overall the complex shows a predominant reduction. The respective redox couples with peak gap values (ΔEp) ranging from 125 to 175 mV, clarifies the presence of a single step one electron transfer process. The negative Er potentials (−383 to −384 mV) may be assigned to the corresponding V(IV) to V(III) conversion (Dai et al., 1996; Maurya and Rajput, 2004). ΔEp value can be seen showing a increasing trend with the increasing in scan rates, supporting the evidence for the quasi-reversible V(IV)/V(III) couple.
4 Computational studies
4.1 Geometrical parameters
Geometry optimization is the first and foremost computational process that is generally established to get insights regarding atomic projections to attain energy minimal state of the complex. The z-matrix presentation of different geometry elements of the optimized structure of the complex, [VO(dha)(8-hq)(H2O)] are given in the Table 1. The optimized structure of the compound (1) is shown in Fig. 6. The computed bond lengths, such as, V⚌O (oxo) (14), V—O (enolic) (11), V—O (ketonic) (1), V—O (water) (26), V-O(25) and V-N(15), in the present complex are 1.6074, 2.1703, 1.9939, 2.1528, 1.9261 and 2.1108 Å, respectively. These results are comparable to the data reported elsewhere (Greenwood and Earnshaw, 1984). O(1)-V(13)-O(11), (75.0591°), O(1)-V(13)-O(14), (100.9314°), O(1)-V(13)-O(25), (88.3392°), O(1)-V(13)-O(26), (93.4652°), O(11)-V(13)-N(15), (84.5678°), O(11)-V(13)-O(25), (90.2716°), O(11)-V(13)-O(26), (72.0918°), O(14)-V(13)-N(15), (98.2726°), O(14)-V(13)-O(25), (110.0045), O(14)-V(13)-O(26), (87.7144°), O(25)-V(13)-N(15), (80.6722°), N(15)-V(13)-O(26), (91.9625°), O(14)-V(13)-O(11), (159.724), O(25)-V(13)-O(26), (161.535), O(1)-V(13)-N(15), (160.225). From the above geometrical data a suitable cis-octahedral geometry of the complex is suggested.
Bond Connectivity
Bond Length (Å)
Bond Connectivity
Dihedral Angle (°)
O(1)-V(13)
1.9939
C(2)-O(1)-V(13)-O(11)
34.3999
O(11)-V(13)
2.1703
C(2)-O(1)-V(13)-O(14)
−166.2555
V(13)-O(14)
1.6047
C(2)-O(1)-V(13)-O(25)
−56.198
V(13)-N(15)
2.1108
C(2)-O(1)-V(13)-O(26)
105.4062
V(13)-O(25)
1.9261
C(6)-O(11)-V(13)-O(1)
−34.811
V(13)-O(26)
2.1528
C(6)-O(11)-V(13)-N(15)
134.0484
Bond Connectivity
Bond Angle (°)
C(6)-O(11)-V(13)-O(25)
53.4449
O(1)-V(13)-O(11)
79.0591
C(6)-O(11)-V(13)-O(26)
−132.1167
O(1)-V(13)-O(14)
100.9314
O(11)-V(13)-N(15)-C(16)
88.6469
O(1)-V(13)-O(25)
88.3392
O(11)-V(13)-N(15)-C(24)
−92.5601
O(1)-V(13)-O(26)
93.4652
O(14)-V(13)-N(15)-C(16)
−71.1286
O(11)-V(13)-N(15)
84.5678
O(14)-V(13)-N(15)-C(24)
107.6643
O(11)-V(13)-O(25)
90.2716
O(25)-V(13)-N(15)-C(16)
179.8184
O(11)-V(13)-O(26)
72.0918
O(25)-V(13)-N(15)-C(24)
−1.3886
O(14)-V(13)-N(15)
98.2726
O(26)-V(13)-N(15)-C(16)
16.846
O(14)-V(13)-O(25)
110.0045
O(26)-V(13)-N(15)-C(24)
−164.361
O(14)-V(13)-O(26)
87.7144
O(1)-V(13)-O(25)-C(23)
165.0364
N(15)-V(13)-O(25)
80.6722
O(11)-V(13)-O(25)-C(23)
85.9902
N(15)-V(13)-O(26)
91.9625
O(14)-V(13)-O(25)-C(23)
−93.9326
V(13)-N(15)-C(16)
129.4489
N(15)-V(13)-O(25)-C(23)
1.5403
V(13)-N(15)-C(24)
110.7909
O(1)-V(13)-O(26)-H(40)
−63.8588
V(13)-O(25)-C(23)
117.3305
O(1)-V(13)-O(26)-H(41)
70.7578
V(13)-O(26)-H(40)
109.9603
O(11)-V(13)-O(26)-H(40)
13.4678
V(13)-O(26)-H(41)
117.8722
O(11)-V(13)-O(26)-H(41)
148.0844
C(6)-O(11)-V(13)
127.3622
O(14)-V(13)-O(26)-H(40)
−164.6783
C(2)-O(1)-V(13)
135.5302
O(14)-V(13)-O(26)-H(41)
−30.0617
N(15)-V(13)-O(26)-H(40)
97.1167
N(15)-V(13)-O(26)-H(41)
−128.2667
V(13)-N(15)-C(16)-C(17)
178.5691
V(13)-N(15)-C(16)-H(34)
−1.3695
V(13)-N(15)-C(24)-C(19)
−178.8845
V(13)-N(15)-C(24)-C(23)
1.0511
V(13)-O(1)-C(2)-C(3)
−21.4677
V(13)-O(1)-C(2)-C(12)
159.8808
C(3)-C(6)-O(11)-V(13)
25.5657
C(7)-C(6)-O(11)-V(13)
−155.7957
C(22)-C(23)-O(25)-V(13)
178.7541
C(24)-C(23)-O(25)-V(13)
−1.4277
![Optimized molecular structure of the complex cis-[VO(dha)(8-hq)(H2O)] (1).](/content/185/2019/31/4/img/10.1016_j.jksus.2018.03.023-fig8.png)
Optimized molecular structure of the complex cis-[VO(dha)(8-hq)(H2O)] (1).
4.2 DFT-based molecular orbital analysis
Frontier molecular orbitals are significant to speculate and characterize the molecular chemical stability (Sun et al., 2003). Six important molecular orbitals (MOs) namely, HOMO, LUMO, two orbitals down to HOMO and two orbitals above the LUMO were evaluated out for dehydroacetic acid (dhaH) and the complex. The analysis can be seen in Fig. S4(a) and (b). The electronic configuration can be used to verify diamagnetic nature of dhaH and paramagnetic behaviour of complex. From the overall composition the weakest bond is with H2O reflected from bond length data as well as from orbital composition. The results are in good agreement as per the other existing scientific reports (Micera and Garribba, 2010). The HOMO-LUMO gap can be further co-related with ionization energy (IE) and electron affinity (IA) by applying Koopmans’s theorem (Mir et al., 2018). Above all, the global reactive descriptors can also be invoked as suggested elsewhere. The absolute electronegativity (χabs), absolute hardness (η) of dehydroacetic acid and its complex are represented in Table 2. Other important properties related to the dipole moment and hardness is electrophilicity index (ω), global softness (S) are given in Table 2.
Compounds
χabs (eV)
η (eV)
ω (Debye/eV)
S (eV)
Dehydroacetic acid
−4.907
−2.275
−1.237
−0.439
[VO(dha)(8-hq)(H2O)]
−4.04765
−1.70633
−25.1725
−0.586054
4.3 Hyperpolarizability calculations
Density functional theory by the calculation of the dipole moment (μ), mean polarizability (α) and the total first static hyperpolarizability (β) is useful in predicting material properties of a compound (Manzoor et al., 2016; Islam and Pandith, 2014). The related information is helpful in gaining insights for the possible use in electronic, laser and photoactive devices. The respective data of [VO(dha)(8-hq)(H2O)] in terms of x, y, z components are given in Table 3. It is here to mention that for the calculated electric dipole moment μ in Debye, isotropic polarizability α in a.u., anisotropy of the polarizability Δα in a.u., all hyperpolarizability (β) components in a.u. are the expressed units presented over here. Where, αxx, αyy and αzz are tensor components of polarizability: βiiz, βizi and βzii (i from x to z) are tensor components of hyperpolarizability: μx, μy and μz are the components of the dipole moment. α is the mean polarizability, Δα is the anisotropy of polarizability, β0 is the mean first hyperpolarizability.
Dipole moment (μ)
Hyperpolarizability(β)
μx
−0.0509
βxxx
233.0822
μy
9.1756
βyyy
39.1697
μz
1.3079
βzzz
21.4380
μtotal.
9.2685
βxyy
−45.0350
Polarizability(α)
βxxy
87.5603
αxx
−156.1946
βxxz
−35.3639
αyy
−143.0321
βxzz
−45.3278
αzz
−158.5821
βyzz
8.9730
αxy
−0.3631
βyyz
1.0475
αxz
−2.8886
βxyz
36.9313
αyz
8.1601
β0
197.3575
α
−46.8815
Δα
14.5044
4.4 Molecular atomic charges and molecular electrostatic potential (MESP)
NBO and Mulliken population analysis of charges are the two hypothetical ways to explain the related partial charges of constituent atoms of a molecule. In case of the representative complex, [VO(dha)(8-hq)(H2O)] the results shown by NBO and Mulliken population analysis (Mulliken, 1995) under B3LYP/ LANL2DZ basis set are shown in Table 4. The comparison between the two methods can be easily made by looking at the results. From the data the atoms namely C2, C4, C6, C8, C23, C24, V13 and all hydrogen bear positive charge both in NBO and Mulliken analyses. The remaining atoms are negatively charged in both the analysis. The overall charge distribution is clearer from Fig. S5. It may be mentioned here that the natural population analysis is always made keeping in view the Pauli’s exclusion principle (Mir et al., 2017a,b).
Compound
A⊥
A||
Aav
g⊥
g||
gav
(1)
89
185
121
2.0301
2.0806
2.046
S. No.
Atoms
NPA Atomic Charges
Mulliken Atomic Charges
S. No.
Atoms
NPA Atomic Charges
Mulliken Atomic Charges
1
O
−0.57638
−0.368434
29
H
0.24772
0.236485
2
C
0.59996
0.331365
30
H
0.23148
0.228213
3
C
−0.35975
−0.130355
31
H
0.24128
0.23666
4
C
0.79329
0.139277
32
H
0.25004
0.279743
5
O
−0.59679
−0.248496
33
H
0.26414
0.246581
6
C
0.50689
0.359207
34
H
0.22716
0.190448
7
C
−0.36453
−0.437214
35
H
0.23145
0.227117
8
C
0.44252
0.364391
36
H
0.2271
0.245285
9
C
−0.6718
−0.71309
37
H
0.21914
0.231091
10
O
−0.56866
−0.293461
38
H
0.22401
0.217495
11
O
−0.67835
−0.416197
39
H
0.23472
0.249412
12
C
−0.69091
−0.728677
40
H
0.54231
0.405731
13
V
0.79846
0.822877
41
H
0.53963
0.431262
14
O
−0.34507
−0.320039
15
N
−0.45075
−0.300987
16
C
0.11258
−0.21429
17
C
−0.25248
−0.190082
18
C
−0.13967
−0.320292
19
C
−0.07139
0.462069
20
C
−0.2411
−0.44823
21
C
−0.18244
−0.163512
22
C
−0.25486
−0.38737
23
C
0.36853
0.332394
24
C
0.16358
0.059503
25
O
−0.626
−0.468221
26
O
−0.88857
−0.667041
27
H
0.24415
0.269074
28
H
0.24933
0.250306
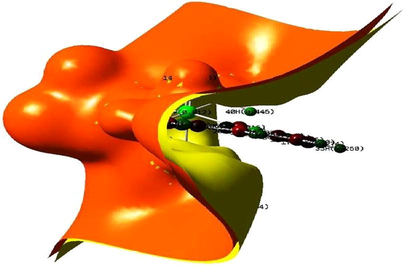
The molecular electrostatic potential surface of dehydroacetic acid and its vanadium complex are given in Fig. 7 (a) and (b), respectively. As expected, the diagram again predicts the predominance of charged regions within a molecular system. The MESP shows dehydroacetic acid having the carbonyl oxygen and hydroxyl oxygen atoms the most negative potential region, while in the case of the complex the coordination environment of four oxygen, one nitrogen and vanadium (central atom) is the region of most negative potential. The green region in the MESP surfaces represents neutral site between two extremes red and dark blue color or negative and positive charged loci. Table 5![Molecular electrostatic potential diagram of (a) dehydroacetic acid and (b) [VO(dha)(8-hq)(H2O)] with color range along with scale.](/content/185/2019/31/4/img/10.1016_j.jksus.2018.03.023-fig9.png)
Molecular electrostatic potential diagram of (a) dehydroacetic acid and (b) [VO(dha)(8-hq)(H2O)] with color range along with scale.
5 Antibacterial screening
The ligand and the metal complex were screened for their antibacterial activity against E.coli (MTCC16799), S. pyogens (MTCC1925) at a concentration of 300-μg cm3 in DMSO by the agar well diffusion method. In the present same methodology was applied as reported elsewhere (Ong et al., 1994). Streptomycin was used as the standard antibacterial agent. All the experiments were carried out in triplicates. The results obtained in the study are the average readings of the data and have been presented in Table 6. From the measurement of inhibition zones indicated in Fig. 8, it is clear that the complex is less active against E. coli, but shows considerable activity against S. pyogenes, when compared with the standard drug. The activity index (AI) which is the ratio between inhibition zone of a sample to the inhibition zone of a standard drug can be used to explain the biological activity comparison between the subject compounds. From the results it is clear that AI value of the target complex against S. pyogenes is near about 1 and against E. coli it is very low than 1.
S. No.
Compound
Compound Zone of inhibition in (mm)
E. coli
S. pyogens
Std.
E. coli
Std.
S. pyogens
(1)
(dhaH)
33 ± 1.70
15 ± 2
12 ± 2
11 ± 2
(2)
[VO(dha)(8-hq)(H2O)]
34 ± 1.50
14 ± 0.97
12 ± 1.50
13 ± 2
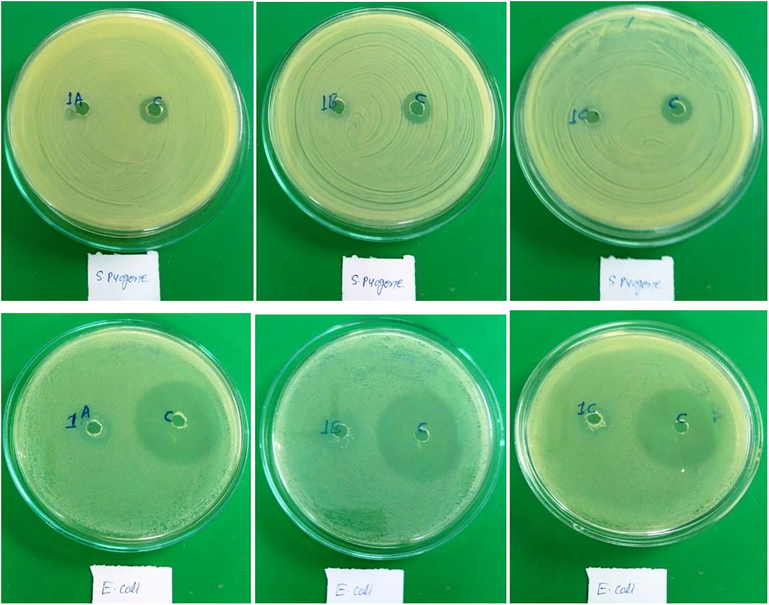
Antibacterial activity of dhaH(1) and the complex against S. pyogenes and E. coli.
Both the activeness and passiveness against microbes can be thought useful in designing metal-relevant bio-remedial. It is essential to understand the microbial diversity in metal-rich environments and their metabolic capabilities to design effective bioremediation strategies. Systems biology approaches would aid in this direction. Systems biology is an integrative approach to study biological systems at the molecular, cellular, community, and ecosystem levels through interactions and networks. Knowledge on metal resistance gained through interdisciplinary approaches would aid in the design of effective metal bioremediation strategies.
6 Conclusions
The analytical data coupled with the studies presented above suggest that the oxovanadium(IV) complex in the present investigation is of the composition [VO(dha)(L)(H2O)] were, dha = dehydroacetic acid, LH = 8-hydroxyquinolene. By the approach of different analytical techniques a cis-octahedral structure has been suggested for the complex. From the TG curve a good level of thermal resistance is evident. The satisfactory biological activity has been remarked against S. Pyogenes than E. coli as compared to the standard drugs. DFT-experimental results remained parallel to each other throughout the study except electronic spectral data wherein the agreement remained only around 400 nm region.
Acknowledgements
The author thankfully acknowledges Prof. Kapil Deo Mishra, Vice Chancellor, R. D. University Jabalpur, India, for his support in developing the lab infrastructure. SAIF, IIT Mumbai, UGC networking Centre Hyderabad Central University and IIT, Chennai are also gratefully acknowledged for rendering necessary lab facilities.
References
- Polyhedron. 1996;15:1806.
- J. Nanomater. 2015
- [CrossRef]
- Thermal Methods: Analytical Chemistry by Open Learning. New York: Wiley; 1987. p. :73.
- Electron Spin Resonance. In: Elements of Magnetochemistry (2nd ed.). New Delhi: Affiliated East-West Press Pvt. Ltd; 1993. p. :225.
- [Google Scholar]
- Frisch M.J. et al., 2010, GAUSSIAN 09 (Revision C.01), Gaussian, Inc., Wallingford CT.
- Angew. Chem. Int. Ed.. 2014;53:10813.
- GaussView 5.0, Gaussian Inc., Garnegie office. Park. Pittsburgh. PA, USA.
- Chemistry of the Elements (1st ed.). New York: Pergamon Press; 1984.
- J. Mol. Model.. 2014;20:2535.
- Jilalat A.E. et al., 2017, J. Mar. Chim. Heterocycl. 16, N° 1
- Mini-Rev. Med. Chem.. 2009;9:1648.
- J. Diabetes Complicat.. 2014;28:265.
- J. Coord. Chem. 2018
- [CrossRef]
- J. Saudi Chem. Soc.. 2016;22:218.
- Int. J. Quantum Chemi. 2016
- [CrossRef]
- J. Mol. Struc.. 2004;35:687.
- J. Coord. Chem.. 2015;68(16):2902-2922.
- J. Coord. Chem.. 2014;67:18.
- J. Mole. Struc.. 2015;1083:343.
- Indian J. Chem.. 2001;40(A):1053.
- Synth. React. Inorg.-Met. Org. Chem.. 2002;32:231-246.
- Eur. J. Inorg. Chem.. 2010;4697
- [CrossRef]
- Eur. J. Inorg. Chem.. 2011;3768
- [CrossRef]
- J. Comp. Chem.. 2011;32:2822.
- J. Chinese Adv. Mater. Soc.. 2018;6:55.
- Nov. Appro. Drug Des. Dev.. 2017;1(5) NAPDD.MS.ID.555574
- Karbala Int. J. Modern Sci.. 2017;3:212.
- J. Theor. Comput. Sci.. 2016;3
- [CrossRef]
- I. L Farmaco. 1994;49:513.
- Inc. Int. J. Quant. Chem.. 2011;111:1395.
- J. Inorg. Biochem.. 2008;102:1463.
- Biointerface Res. Appl. Chem.. 2013;3:484.
- J. Chem. Phys. Lett.. 2003;381:397.
- J. Inorg. Biochem.. 2006;100:1925.
- Sci. Rep.. 2013;3:2642.
- J. Chem. Sci.. 2016;128:511.
Appendix A
Supplementary data
Supplementary data associated with this article can be found, in the online version, at https://doi.org/10.1016/j.jksus.2018.03.023.
Appendix A
Supplementary data


