

Translate this page into:
Identification and quantification of major phenolic constituents in Juglans regia L. leaves: healthy vs. infected leaves with Xanthomonas campestris pv. juglandis using HPLC-MS/MS
⁎Corresponding author. aljaz.medic@bf.uni-lj.si (Aljaz Medic),
-
Received: ,
Accepted: ,
This article was originally published by Elsevier and was migrated to Scientific Scholar after the change of Publisher.
Peer review under responsibility of King Saud University.
Abstract
The present study was designed to characterise and quantify the major phenolic constituents in healthy leaves and leaves infected with Xanthomonas campestris pv. juglandis. A comparison among six different cultivars: 'Fernor', 'Fernette', 'Franquette', 'Rubina', 'Sava' and 'Krka', with the same agricultural, geographical and climatic conditions, was made. Liquid chromatography coupled with a mass spectrometer (HPLC-MS/MS) was used to identify and quantify the compounds. A total of 52 compounds were identified based on mass spectra and literature. Among them, 15 hydroxycinnamic acids, 6 flavanols, 2 flavones, 22 flavonols and 7 naphthoquinones were identified. Two flavones and three naphthoquinones were reported for the first time in J. regia leaves. In addition, two naphthoquinones, which are reported to play an active role in the process of juglone formation, were confirmed in all six cultivars. In the process of MS fragmentation, compounds were fragmented up to MS6 fragments and in some cases both MS2 fragments were further fragmented, providing comprehensive data. Total analysed phenolic content (TAPC) and total phenolic content (TPC) concentrations were higher in infected leaves, suggesting that phenols play a major role in plant defence. In the case of walnut bacterial blight, the contents of flavanols and total hydroxycinnamic acids were higher in infected leaves in all cultivars, suggesting that they could play a key role in a plant’s response to this economically important disease.
Keywords
Hydrojuglone
Juglone
Naphthoquinones
Phenolic compounds
Xanthomonas campestris pv. Juglandis
1,4-Naphthoquinone

1 Introduction
Persian walnut (Juglans regia L.) is a deciduous tree, one of 64 species that belong to the genus Juglans (Juglandaceae). It is considered to be a valuable botanical source of nutrients and bioactive molecules (Forino et al., 2016). It is native to Central Asia, Anatolia, the northern parts of Iran and the Himalayas, and has been introduced all over the world, where it is used by numerous cultures both as food and medicine (Schwindl et al., 2017). Nowadays walnut is extensively cultivated in Europe, North and South America, Asia and, to a limited extent, in New Zealand, Australia and North Africa. Related species include the black walnut (J. nigra, J. hindsii, J. major), the butternut (J. cinerea), pecan and hickory (Carya spp.) and wingnuts (Pterocarya spp.) (Leslie and McGranahan, 1992).
Phenols are secondary metabolites that occur in abundance in all plant material. They are involved in physiological processes of tree growth as well as the pre- and post-harvest life of fruit. They are an important factor in a plant’s defence against various types of stress caused by environmental conditions or pathogens. In J. regia, naphthoquinones and flavonoids are considered to be the major phenolic compounds (Solar et al., 2006).
Naphthoquinones occur in about 20 plant families. They are derived from the shikimic acid and o-succinoylbenzoic acid biosynthetic pathway. Among the naphthoquinones, juglone (5-hydroxy-1,4-naphthoquinone) is of great interest due to its chemical reactivity (Duroux et al., 1998). Juglone is a characteristic compound of the Juglans genus, which is reported to occur in fresh walnut leaves (Cosmulescu et al., 2011; Gîrzu et al., 1998), roots (Cosmulescu et al., 2011), husks (Cosmulescu et al., 2011; Stampar et al., 2006) and the inner root bark (Cosmulescu et al., 2011; Hedin et al., 1979). Juglone is an important phenolic compound of walnuts, known for its microbial effect and antitumor effect studied in rats (Sugie et al., 1998). Studies have shown that juglone can penetrate the plasma membrane and induce depolarisation by blocking the K+ channels. It has therefore been proposed that juglone and other naphthoquinones act as protective compounds against microorganisms, and possibly as plant growth regulators. Metabolic studies have shown that juglone formation is the result of 1,4,5-trihydroxynaphthalene and that it may also occur as a glucoside: hydrojuglone β-D-glucopyranoside (HJG) (Duroux et al., 1998). Juglone in combination with some other phenols may be involved as a defence mechanism against walnut bacterial blight (Xanthomonas campestris pv. juglandis) (Solar et al., 2005; Solar et al., 2012).
Walnut bacterial blight is the most important disease in walnuts (Mikulic-Petkovsek et al., 2011). The symptoms of walnut bacterial blight on leaves begin as small water-soaked spots that can expand to form angular necrotic lesions of 2 to 4 mm diameter, typically extending along the veins as the disease progresses. The disease limits walnut production worldwide and can affect all succulent tissues (Woeste et al., 1992).
The incidence and severity of bacterial blight in different cultivars during their development could be better understood by gaining insights into the physiological response to infection by Xanthomonas campestris pv. juglandis (Mikulic-Petkovsek et al., 2011). Resistance to bacterial blight may be related to a specific phenolic compound or group of compounds, as reported for some economically important pests and plant diseases in general (Mikulic-Petkovsek et al., 2008; Treutter and Feucht, 1990). In several cases, phenolic compounds are toxic to pathogens, since many of them, especially flavanols and hydroxycinnamic acids, act as barriers against herbivores or microbial pathogens. In response to the pathogen attack, both the content and the composition of polyphenols can change and thus play an active role in inducing resistance to pathogens (Treutter, 2005).
To the best of our knowledge, the mechanisms of plant response to infection are poorly understood and should be further investigated, since the use of pesticides is inefficient and undesirable. The aim of our study was to investigate the phenolic content in both healthy and infected leaves of walnut in order to identify the plant response of the different cultivars. A total of 6 different walnut cultivars were investigated, 3 cultivars that are worldwide spread: 'Fernor', 'Fernette', 'Franquette', and 3 Slovenian cultivars with great potential: 'Rubina', 'Sava' and 'Krka', all with the same agricultural, geographical and climatic conditions. Based on previous work, we expected that the infected tissue would have a higher total phenolic content, as well as a higher content of certain phenolic compounds compared to healthy tissue, contributing to the plant response mechanisms. Since total phenolic content does not show a clear picture of a plant’s response and mechanisms in relation to the infection, individual groups and individual phenols were also studied. Individual phenols provided insight for further understanding which individual phenols could be the most important in the plant response to infection by walnut bacterial blight. Our study demonstrated that an in-depth study of individual phenols is needed, as well as including more different cultivars when studying the plant response, so that correct and firm conclusions can be drawn.
2 Materials and methods
2.1 Chemicals
The following standards were used to determine the chemical compounds: apigenin 7-glucoside, kaempferol-3-glucoside, procyanidin B1, quercetin-3-O-glucoside, quercetin-3-rhamnoside, ferulic acid, p-coumaric acid from Fluka Chemie GmbH (Buchs, Switzerland), (+)-catechin from Roth (Karlsruhe, Germany), 4-O-caffeoylquinic acid, chlorogenic acid (trans-5-caffeoylquinic acid), neochlorogenic acid (3-caffeoylquinic acid), quercetin-3-O-galactoside, quercetin-3-O-rhamnoside, juglone (5-hydroxy-1,4-naphthoquinone), 1,4-naphthoquinone, caffeic acid, galic acid, (−)-epicatechin from Sigma–Aldrich Chemie GmbH (Steinheim, Germany), myricetin-3-O-rhamnoside, quercetin-3-arabinofuranoside, quercetin-3-arabinopyranoside, quercetin-3-O-xyloside from Apin Chemicals (Abingdon, UK).
The water used in sample preparation, solutions and analyses was bi-distilled and purified with a Milli-Q water purification system by Millipore (Bedford, MA, USA). The chemicals for the mobile phases were HPLC–MS grade acetonitrile, absolute methanol and formic acid (Sigma-Aldrich, Steinheim, Germany).
2.2 Plant material
Walnut samples of healthy leaves and leaves infected with Xanthomonas campestris pv. juglandis were obtained from six walnut cultivars: 'Fernor', 'Fernette', 'Franquette', 'Rubina', 'Sava' and 'Krka'. This study follows a study conducted on the same six cultivars investigating the phenolic composition of peeled walnut kernels and walnut pellicles by Medic et al., 2021. All samples were collected on 23th September 2019, the phase of a fully developed leaf, in the same orchard in Slovenia, Maribor (46°34′01″ N; 15°37′51″ E; 275 m a.s.l.) on 24-year-old trees with a planting density of 10 × 10 m, with the same agronomical management, soil and climate. Standard phytosanitary treatments were applied for walnut husk fly (Rhagoletis completa). The visual assessment of Xanthomonas campestris pv. juglandis was between 7.0 and 8.0 (low infection) for all varieties, on a 9 scale table (1.0–2.5 very strongly expressed symptoms of the infection; 3.0–4.5 strongly expressed symptoms; 5.0–6.0 medium infection; 7.0–8.0 weak infection; 8.5–9.0 no signs of infection) (Solar, 2019; Donik-Purgaj et al., 2020). The samples were collected from the middle third of the branches on the east side of the tree, put in plastic bags and immediately frozen at –20 °C. The samples were then transported to the laboratory of the Biotechnical Faculty, Department of Agronomy in Ljubljana, Slovenia, where they were liofilised and ground into a powder for further analysis.
2.3 Extraction of phenolic compounds
Phenolic compounds were extracted according to the protocol described by Mikulic-Petkovsek et al. (2013) with minor modifications. Samples were ground with liquid nitrogen. Briefly, 0.25 g of leaves were extracted with absolute methanol. The extracts ratio of leaves was 1:30 (w/v) tissue:methanol ratio. Following 15 s stirring in a vortex mixer, the samples were further extracted for 60 min in an ultrasonic bath (Sonis 4, Iskra Pio, Sentjernej, Slovenia) filled with ice. The samples were then placed in a centrifuge (Eppendorf Centrifuge 5810 R, Hamburg, Germany) for 10 min at 10,000 rpm at 4 °C, filtered through polyamide 0.2 µm Chromafil AO-20/25 produced by Macherey-Nagel (Düren, Germany), transferred to a vial and stored at –20 °C until further analysis.
2.4 HPLC–MS analysis of individual phenolic compounds
The phenolic compounds were analysed on a Thermo Finnigan Surveyor Dionex UltiMate 3000 Series UHPLC (San Jose, USA) with a diode array detector set at 280 nm (for hydroxycinnamic acids, flavanols and naphthoquinones) and 350 nm (for flavones and flavonols). The conditions were as previously described by Medic et al. (2021).
Identification of phenolic compounds was done using a mass spectrometer (Thermo Scientific LCQ Deca XP MAX) with heated electrospray ionisation (HESI) operating in negative ion mode. The HESI parameters were as previously described by Medic et al. (2021). Compounds were fragmented and external standards were used for identification and quantification of known compounds, literature data and MS fragmentation were used for identification for unknown compounds, and quantified on a similar standard. The content of individual phenolic compounds was expressed in mg 100 g−1 dry weight (DW). Total analysed phenolic content (TAPC) represents the sum of all identified compounds and was expressed in mg g−1 dry weight (DW).
Compounds for which standards were not obtained were expressed as follows: p-coumaric acid derivatives and hexosides in mg of p-coumaric acid equivalents 100 g−1 DW, 3-p-coumaroylquinnic acid in mg of 4-O-caffeoylquinic acid equivalents 100 g−1 DW, ferulic acid hexoside in mg of ferulic acid equivalents 100 g−1 DW, caffeic acid hexoside derivative in mg of caffeic acid equivalents 100 g−1 DW, procyanidin dimers in mg of procyanidin B1 equivalents 100 g−1 DW, santin and 5,7-dihydroxy-3,4-dimetoxyflavone in mg of apigenin-7-glucoside equivalents 100 g−1 DW, myricetin glycosides in mg of myricetin-3-O-rhamnoside equivalents 100 g−1 DW, the remaining quercetin glycosides and quercetin in mg of quercetin-3-O-glucoside equivalents 100 g−1 DW, kaempferol glycosides in mg of kaempferol-3-glucoside equivalents 100 g−1 DW and the remaining naphthoquinones in mg of juglone (5-hydroxy-1,4-naphthoquinone) equivalents 100 g−1 DW.
2.5 Analysis of total phenols
The extraction of walnut samples for determination of total phenols was carried out according to the same protocol as for individual phenols. An UV/Vis spectrometer Lambda Bio 20 produced by Perkin Elmer (Waltham, USA) was used to determine the TPC (total phenolic content). The TPC of extracts was assessed by the Folin–Ciocalteau phenol reagent method (Singleton et al., 1999) to the protocol described by Medic et al. (2021). The total phenolic content was expressed as gallic acid equivalents (GAE) in milligrams per 100 g−1 of walnut. Absorptions were measured in four replications.
2.6 Statistical analysis
Data was arranged in Microsoft Excel 2016 and statistically analysed with R commander. Four samples of leaves and leaves affected with Xanthomonas campestris pv. Juglandis were assayed and four repetitions of each methodology were performed. The results were expressed as mean values with standard error (SE). For the determination of statistical differences between data, two-way variance analysis (ANOVA) was used, except when comparing healthy leaves and leaves infected with Xanthomonas campestris pv. juglandis within a particular cultivar, for which one-way variance analysis (ANOVA) with the Tukey-test was performed. The statistical means at 95% confidence level were calculated. Hierarchical clustering (dendrogram) was used to determine the grouping for total phenolic content (TPC), using R commander, using Ward’s method based on Euclidian distance. Data in tables shows average values with standard errors and statistical differences.
3 Results
3.1 Identification of phenolic compounds
A total of 52 phenolic compounds were identified in leaves of J. regia based on the existing literature and standards. Table 1 shows the molecular and fragment ions used to confirm the chemical structure. Of 52 compounds, 14 were identified using standards, with both fragmentation of the standards and the addition of an external standard to confirm the identity of the compound with certainty. The remaining 38 compounds were tentatively identified according to pseudomolecular ions ([M−H]−) and the specific fragmentation pattern (MS2, MS3, MS4, MS5 and MS6). For both healthy and infected leaves, it was possible to identify 52 phenolic compounds: 15 hydroxycinnamic acids, 6 flavanols, 2 flavones, 22 flavonols and 7 naphthoquinones. The chromatograms of the identified compounds can also be found in the supplementary material. The bolded numbers represent the fragments that were further fragmented.
Phenolics
Rt (min)
[M−H]− (m/z)
MS2 (m/z)
MS3 (m/z)
MS4 (m/z)
MS5 (m/z)
MS6 (m/z)
Hydroxycinnamic acids
neochlorogenic acid (3-caffeoylquinic acid)
9,82
353
191, 179, 135
3-p-coumaoylquinic acid
12,45
337
163, 191, 173
p-coumaric acid hexoside 1
12,55
325
163, 145, 187, 119
119
chlorogenic acid (trans-5-caffeoylquinnic acid)
13,4
353
173, 179, 191, 135
p-coumaric acid hexoside derivate 1
13,4
487
307
145, 163, 235, 217, 173
p-coumaric acid hexoside 2
13,4
325
235
163, 191, 161
ferulic acid hexoside
14,4
355
175, 193, 161
derivate p-coumaric acid
14,51
443
163, 145, 119
p-coumaric acid hexoside 3
14,51
325
235
163, 191, 161
caffeic acid hexoside derivate
24,83
517
341, 371, 281, 209, 251
251, 281, 179, 221
179, 135
p-coumaric acid hexoside derivate 2
25,31
471
307
145, 163, 187, 247, 205, 119
p-coumaric acid hexoside derivate 3
26,33
485
325
235
163, 217, 119
p-coumaric acid hexoside derivate 4
28,22
501
325
235
163, 217, 119
p-coumaric acid hexoside derivate 5
28,22
485
325
235
163, 217, 119
p-coumaric acid hexoside 4
29,58
325
235
163, 191, 119
Flavanols
procyanidin dimer 1
10,47
577
425, 407, 289
procyanidin dimer 2
11,52
557
425, 407, 289
(+) catechin
12,45
289
245, 205, 179
(-) epicatechin
14,58
289
245, 205, 179
procyanidin dimer 3
15,01
557
425, 407, 289
procyanidin dimer 4
17,15
557
425, 407, 289
Flavones
Santin
32,27
343
328
285, 312
5,7-dihydroxy-3,4-dimetoxyflavone
32,41
313
298
298
Flavonols
Myrmicetin hexoside 1
18,1
479
316
Myrmicetin pentoside
19,11
449
317
179, 151, 191
Myrmicetin-3-rhamnoside
20,25
463
316
271, 179, 151
Myrmicetin pentoside
20,25
449
317
179, 151, 191
Quercetin-3-galactoside
20,57
463
301
179, 151
300
271, 255
243, 227, 215
Quercetin-3-glucoside
20,75
463
301
179, 151
Quercetin-3-xyloside
21,61
433
301
179, 151
Kaempferol-3-galactoside
21,93
447
284
255, 227, 151
285
257, 267, 241, 229, 151, 163
Quercetin-3-arabinopyranoside
21,93
433
301
179, 151
Quercetin-3-arabinofuranoside
22,34
433
301
179, 151
Kaempferol-3-glucoside
22,34
447
284
255, 227, 151
285
257, 267, 241, 229, 151, 163
Quercetin-3-rhamnoside
22,53
447
301
179, 151
Kaempferol pentoside 1
23,15
417
284
255, 227
Kaempferol pentoside 2
23,45
417
284
255, 227
285
Kaempferol derivate
23,45
477
284
255, 227
285
257, 267, 241, 229, 151, 163
Kaempferol pentoside 3
24,01
417
285, 284
255, 227
Kaempferol rhamnoside
24,28
431
285
257, 267, 229, 163
Quercetin derivate
25,31
475
300, 415, 179, 301
271, 255
243, 227, 215
300, 415, 179, 301
179, 151
Quercetin-3-rhamnosyl hexoside
26,1
609
463
301
179, 151
Quercetin dirhamnoside
28,13
593
301, 300, 271, 445, 179
179, 151
Quercetin
29,44
301
179, 151, 257
Kaempferol-3-rutinoside
30,22
593
285, 447, 284
257, 151, 241, 229, 267, 163
229, 163, 213
185, 201
285, 447, 284
255, 227, 265
Naphthoquinones
dihydroxytetralone hexoside
12,55
339
159, 177, 179, 161, 144
116
hydrojuglone β-D-glucopyranoside
16,52
337
175
131, 157, 103, 147, 115
103
131, 157, 103, 147, 115
129, 101, 147, 131
hydrojuglone derivate pentoside
21,4
435
303
285
241, 175, 161
213, 199, 197
241, 175, 161
157, 147, 129
129, 147
1,4-naphthoquinone
28,13
173
111, 155, 129, 145
hydrojuglone
28,13
175
131, 147, 157, 115, 103
hydrojuglone rutinoside
29,58
483
175
131, 157, 103, 147, 115
juglone (5-Hydroxy-1,4-naphthoquinone)
30,22
189
161
117, 133
Satin
32,27
343
328
285, 312
5,7-dihydroxy-3,4-dimetoxyflavone
32,41
313
298
298
3.2 Phenolic composition of healthy and infected leaves
Both total analysed phenols (TAPC) and total phenolic content (TPC) were higher in leaves infected with bacterial blight, as shown in Table 2. The difference is clearly demonstrated in Fig. 1, in which a dendrogram between TPC of healthy and infected leaves was made between cultivars. In terms of the general profile of healthy and infected leaves, both were mainly composed of naphthoquinones, followed by flavanols and flavonols, as shown in Table 2. A difference in all cultivars between phenolic groups in infected and healthy leaves can only be seen for flavanols and hydroxycinnamic acids. The content of flavanols in infected leaves increased up to 7.5 times, depending on the cultivar, and the content of hydroxycinnamic acids up to 4 times. The biggest difference between healthy and infected leaves can be seen in 'Franquette', since the initial content was the lowest, as can be seen in Fig. 2 (C). Looking at Fig. 2 (A) or Table 3, it is clear that all individual flavanol contents increased after infection, not only the total flavanol content. For hydroxycinnamic acids, the total content in the leaves increased significantly, but not all individual hydroxycinnamic acids increased in infected leaves, as shown in Table 3. While neochlorogenic acid, 3-p-coumaoylquinic acid, ferulic acid, derivative p-coumaric acid, p-coumaric acid hexoside 3 and p-coumaric acid hexoside 4 are higher in infected leaves than in healthy ones in all studied cultivars, the remaining nine compounds did not respond evenly among cultivars. Mean values followed by the same letter within a cultivar do not differ significantly at p < 0.05. Asterisks represents statistically significant differences between cultivars of healthy leaves (CV), infected leaves (INF) and both infected and healty leaves together (CV × INF) at P = <0.05 (*), <0.01 (**), <0.001 (***) or NS (notsignificant).
Phenolics
Fernor
Fernor xan.
Fernette
Fernette xan.
Franquette
Franquette xan.
Total Hydroxycinnamic acids
14.7 ± 0.7
a
26.2 ± 0.6
b
21.1 ± 0.6
a
30.2 ± 0.7
b
8.9 ± 0.4
a
33.7 ± 1.1
b
Total Flavanols
53.1 ± 3.2
a
154.2 ± 3.1
b
66.4 ± 1.2
a
176.1 ± 6.6
b
22.3 ± 1.1
a
165.7 ± 4.2
b
Total Flavonols
27.2 ± 1.4
a
39.8 ± 1.1
b
32.0 ± 1.4
a
40.0 ± 1.3
b
16.7 ± 0.2
a
54.3 ± 2.2
b
Total Flavones
1.6 ± 0.2
a
2.2 ± 0.1
b
0.9 ± 0.1
a
0.8 ± 0.0
a
1.3 ± 0.1
b
0.8 ± 0.1
a
Total Naphthoquinones
173.2 ± 4.7
a
164.5 ± 2.7
a
257.4 ± 7.7
b
235.7 ± 4.0
a
86.1 ± 4.6
a
224.4 ± 5.4
b
Total Analysed Phenols (TAPC)
269.7 ± 9.4
a
386.9 ± 3.2
b
377.8 ± 7.2
a
482.7 ± 10.9
b
135.2 ± 5.5
a
479.90 ± 11.9
b
Total Phenols (TPC)
48.8 ± 2.4
a
91.7 ± 1.6
b
56.4 ± 1.0
a
95.2 ± 2.9
b
30.5 ± 0.6
a
85.8 ± 4.5
b
Sava
Sava xan.
Krka
Krka xan.
Rubina
Rubina xan.
Total Hydroxycinnamic acids
9.6 ± 0.1
a
22.7 ± 0.2
b
11.8 ± 0.1
a
20.8 ± 0.1
b
26.8 ± 1.3
a
33.5 ± 0.9
b
Total Flavanols
27.3 ± 1.3
a
147.4 ± 4.6
b
39.7 ± 1.2
a
131.2 ± 0.8
b
34.4 ± 1.7
a
209.4 ± 9.8
b
Total Flavonols
26.1 ± 0.7
a
43.1 ± 1.3
b
21.7 ± 0.4
a
36.8 ± 0.4
b
39.8 ± 0.6
a
37.6 ± 1.0
a
Total Flavones
0.7 ± 0.1
a
1.1 ± 0.3
a
1.0 ± 0.2
b
0.5 ± 0.0
a
2.6 ± 0.2
a
2.3 ± 0.1
a
Total Naphthoquinones
109.8 ± 3.0
a
187.0 ± 5.0
b
147.9 ± 4.0
a
191.0 ± 4.6
b
136.1 ± 2.5
a
197.1 ± 5.1
b
Total Analysed Phenols (TAPC)
173.4 ± 4.5
a
401.3 ± 8.4
b
222.1 ± 4.5
a
380.2 ± 5.7
b
239.7 ± 4.2
a
479.9 ± 15.2
b
Total Phenols (TPC)
35.8 ± 2.2
a
72.6 ± 1.1
b
42.8 ± 1.0
a
88.8 ± 4.5
b
54.3 ± 2.2
a
108.1 ± 2.9
b
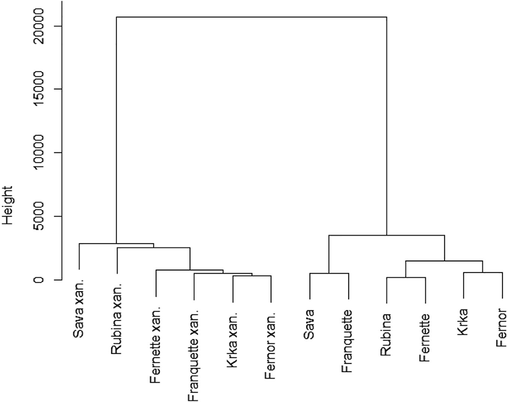
Dendrogram depiciting the grouping of healthy and infected leaves with walnut bacterial blight of six cultivars, using Ward‘s method (squared Euclidean distance) based on total phenolic compounds. The data is standardised (µ = 0, σ = 1).
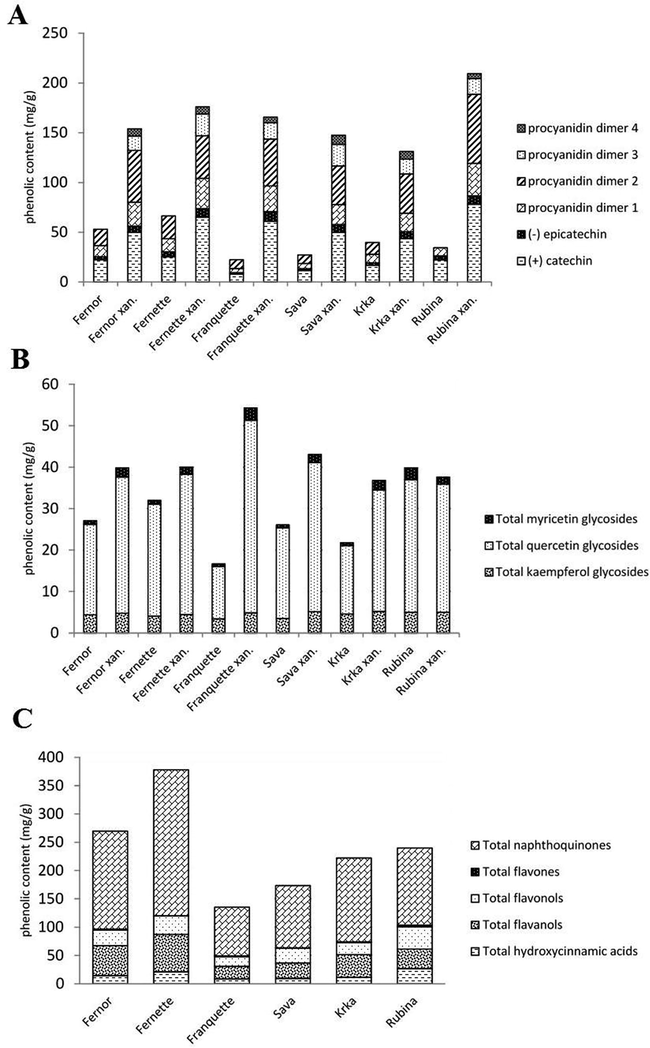
Comparison between the phenolic content of healthy and leaves infected with Xanthomonas campestris pv. Juglandis. A: Comparison of individual and total flavanols of healthy and infected leaves between cultivars (in mg g−1 dry weight). B: Comparison of individual and total flavonols of healthy and infected leaves between cultivars (in mg g−1 dry weight). C: Comparison of phenolic groups of healthy leaves between varieties (in mg g−1 dry weight).
Phenolics
Fernor
Fernor xan.
Fernette
Fernette xan.
Franquette
Franquette xan.
Sava
Sava xan.
Krka
Krka xan.
Rubina
Rubina xan.
CV
INF
CV × INF
Hydroxycinnamic acids
neochlorogenic acid (3-caffeoylquinic acid)
492.1 ± 20.5
700.8 ± 6.5
392.3 ± 11.4
617.1 ± 31.8
317.0 ± 6.9
941.3 ± 31.7
329.9 ± 11.0
671.0 ± 11.4
417.1 ± 15.0
683.7 ± 12.0
606.9 ± 25.0
682.8 ± 24.1
***
***
***
chlorogenic acid (trans-5-caffeoylquinnic acid)
97.6 ± 8.9
133.4 ± 1.1
107.2 ± 8.5
162.8 ± 2.6
72.5 ± 5.4
109.5 ± 7.7
62.4 ± 4.5
132.6 ± 3.7
80.7 ± 6.1
51.8 ± 1.9
6.9 ± 0.4
52.7 ± 1.8
***
***
***
3-p-coumaoylquinic acid
491.4 ± 48.1
1311.5 ± 51.6
1048.2 ± 37.1
1566.2 ± 28.2
282.0 ± 12.1
1522.4 ± 36.5
279.2 ± 8.8
865.9 ± 33.0
364.4 ± 7.3
902.8 ± 21.8
1661.8 ± 89.4
1923.6 ± 62.9
***
***
***
ferulic acid hexoside
47.0 ± 6.6
112.8 ± 4.2
62.4 ± 3.4
141.5 ± 5.0
25.0 ± 3.4
158.8 ± 9.8
30.9 ± 3.2
125.0 ± 6.5
49.5 ± 1.8
120.6 ± 8.0
50.5 ± 5.4
178.2 ± 7.8
***
***
***
caffeic acid hexoside derivative
71.3 ± 5.3
70.4 ± 3.5
83.1 ± 4.2
87.3 ± 6.9
46.3 ± 4.8
68.8 ± 7.0
66.0 ± 6.4
65.9 ± 1.7
80.0 ± 1.8
67.2 ± 9.1
21.9 ± 2.6
56.1 ± 5.4
***
***
***
p-coumaric acid derivative
17.5 ± 1.6
22.4 ± 0.8
15.5 ± 1.0
30.4 ± 1.6
3.2 ± 0.3
23.3 ± 2.2
14.2 ± 1.6
25.7 ± 1.5
12.4 ± 0.9
16.9 ± 1.0
15.4 ± 1.2
23.7 ± 0.9
***
***
***
p-coumaric acid hexoside derivative 1
traces
traces
2.9 ± 0.2
6.1 ± 0.1
1.7 ± 0.1
6.8 ± 0.5
3.1 ± 0.2
4.2 ± 0.1
2.6 ± 0.2
5.3 ± 0.2
18.6 ± 1.2
16.9 ± 0.6
***
***
***
p-coumaric acid hexoside derivative 2
27.5 ± 3.0
50.4 ± 2.3
35.8 ± 4.1
46.2 ± 3.0
6.6 ± 0.4
57.9 ± 4.6
35.2 ± 2.3
58.8 ± 3.0
26.1 ± 1.5
23.5 ± 2.0
9.5 ± 0.9
78.8 ± 2.6
***
***
***
p-coumaric acid hexoside derivative 3
142.7 ± 9.9
106.3 ± 3.1
235.6 ± 20.6
188.4 ± 5.7
83.4 ± 8.3
284.4 ± 26.9
88.0 ± 10.1
173.2 ± 8.7
82.3 ± 8.4
92.3 ± 4.0
155.8 ± 8.0
207.3 ± 12.7
***
***
***
p-coumaric acid hexoside derivative 4
29.7 ± 1.0
24.8 ± 0.6
39.1 ± 2.7
44.9 ± 3.2
17.2 ± 1.6
72.2 ± 3.1
17.3 ± 0.7
50.1 ± 2.5
29.3 ± 3.0
28.0 ± 1.1
49.4 ± 2.4
26.4 ± 1.0
***
***
***
p-coumaric acid hexoside derivative 5
22.0 ± 1.6
13.9 ± 0.4
32.1 ± 2.2
22.9 ± 1.6
13.1 ± 1.2
23.1 ± 1.0
14.5 ± 0.6
25.0 ± 1.2
11.1 ± 1.1
15.4 ± 0.6
15.3 ± 0.7
18.5 ± 0.7
***
***
***
p-coumaric acid hexoside 1
2.0 ± 0.1
2.0 ± 0.1
1.4 ± 0.1
4.9 ± 0.4
1.0 ± 0.1
7.1 ± 0.1
1.2 ± 0.0
2.7 ± 0.2
1.7 ± 0.1
3.4 ± 0.1
36.0 ± 0.7
6.7 ± 0.6
***
***
***
p-coumaric acid hexoside 2
12.0 ± 1.1
35.7 ± 0.3
23.0 ± 1.8
55.9 ± 0.9
3.9 ± 0.3
52.3 ± 3.7
8.8 ± 0.6
35.5 ± 1.0
7.3 ± 0.6
37.5 ± 1.4
9.3 ± 0.6
28.2 ± 1.0
***
***
***
p-coumaric acid hexoside 3
5.3 ± 0.5
22.4 ± 0.8
15.5 ± 1.0
30.4 ± 1.6
6.1 ± 0.5
24.5 ± 2.3
2.4 ± 0.3
25.7 ± 1.5
7.7 ± 0.6
16.9 ± 1.0
15.4 ± 1.2
23.7 ± 0.9
***
***
***
p-coumaric acid hexoside 4
14.1 ± 0.8
17.6 ± 0.7
14.1 ± 1.1
14.6 ± 1.0
10.9 ± 0.7
22.4 ± 0.7
8.4 ± 0.5
11.4 ± 0.3
11.3 ± 0.9
12.3 ± 0.1
9.2 ± 0.5
22.2 ± 1.3
***
***
***
Total p-coumaric acid hexosides and derivatives
272.9 ± 13.0
295.7 ± 4.7
414.8 ± 31.8
444.7 ± 14.2
147.0 ± 11.1
574.1 ± 39.2
193.3 ± 13.3
412.4 ± 10.4
191.9 ± 7.4
251.3 ± 2.0
333.9 ± 15.1
452.3 ± 18.1
***
***
***
Flavanols
(+)catechin
2243.8 ± 120.7
4990.9 ± 201.6
2537.7 ± 207.4
6534.8 ± 120.9
806.3 ± 88.7
6120.9 ± 231.1
1148.8 ± 81.3
4976.6 ± 83.6
1683.9 ± 73.2
4378.1 ± 194.1
2217.5 ± 118.6
7803.7 ± 339.4
***
***
***
(-)epicatechin
298.8 ± 23.8
612.7 ± 19.8
486.7 ± 32.3
840.8 ± 48.3
109.6 ± 6.5
953.5 ± 87.4
180.4 ± 28.1
781.8 ± 53.3
245.8 ± 22.9
668.1 ± 36.8
398.5 ± 36.7
864.4 ± 55.2
***
**
***
procyanidin dimer 1
1123.7 ± 91.9
2430.3 ± 126.8
1308.7 ± 98.9
3057.4 ± 241.9
444.6 ± 40.4
2581.5 ± 103.9
538.6 ± 21.7
2031.6 ± 78.3
852.8 ± 31.9
1857.2 ± 25.0
823.7 ± 47.9
3273.2 ± 134.3
***
***
***
procyanidin dimer 2
1639.8 ± 113.3
5184.0 ± 293.9
2302.4 ± 33.2
4283.6 ± 138.8
873.8 ± 109.2
4710.4 ± 133.3
860.4 ± 28.5
3881.2 ± 87.6
1186.9 ± 36.4
3944.4 ± 87.0
traces
6919.4 ± 445.5
***
***
***
procyanidin dimer 3
traces
1447.3 ± 71.1
traces
2162.7 ± 83.9
traces
1648.9 ± 89.5
traces
2159.3 ± 127.3
traces
1487.0 ± 101.9
traces
1587.0 ± 86.2
NS
***
***
procyanidin dimer 4
traces
752.9 ± 49.9
traces
730.6 ± 118.4
traces
556.2 ± 37.8
traces
908.2 ± 97.3
traces
781.2 ± 74.8
traces
494.0 ± 30.8
NS
*
***
Flavones
Santin
66.0 ± 6.7
111.3 ± 3.7
32.8 ± 4.3
42.5 ± 2.5
46.7 ± 1.9
41.6 ± 6.6
34.6 ± 3.4
49.2 ± 10.1
53.4 ± 11.3
31.9 ± 3.1
139.6 ± 8.5
72.6 ± 1.1
***
***
***
5,7-dihydroxy-3,4-dimetoxyflavone
94.2 ± 10.8
108.9 ± 8.1
56.9 ± 5.7
34.1 ± 2.3
78.9 ± 8.8
36.6 ± 4.9
35.0 ± 5.6
57.0 ± 15.2
45.4 ± 8.2
14.1 ± 0.8
125.0 ± 9.2
153.9 ± 6.4
***
***
***
Flavonols
myricetin hexoside 1
43.3 ± 0.5
112.5 ± 5.3
33.8 ± 2.8
59.5 ± 1.8
28.6 ± 3.4
153.3 ± 2.3
31.9 ± 1.6
92.2 ± 12.4
21.8 ± 0.9
109.0 ± 10.8
144.3 ± 4.1
84.8 ± 5.1
***
***
***
myricetin pentoside 1
19.8 ± 1.4
45.2 ± 3.5
24.6 ± 1.7
50.9 ± 1.5
13.9 ± 0.8
60.8 ± 2.0
18.7 ± 1.5
56.1 ± 3.0
17.8 ± 1.4
51.4 ± 3.1
58.1 ± 3.6
31.3 ± 1.0
***
***
***
myricetin pentoside 2
5.6 ± 0.3
16.6 ± 0.6
5.8 ± 0.4
12.4 ± 0.5
3.8 ± 0.2
22.0 ± 0.8
5.4 ± 0.2
16.0 ± 1.2
6.7 ± 0.4
17.4 ± 0.8
18.9 ± 0.9
13.6 ± 1.0
***
***
***
myricetin-3-rhamnoside
22.6 ± 1.4
42.5 ± 1.6
27.4 ± 1.7
42.7 ± 1.7
12.7 ± 0.6
64.7 ± 2.3
18.2 ± 0.6
38.1 ± 2.9
19.0 ± 1.0
49.6 ± 2.3
62.9 ± 2.9
36.7 ± 2.8
***
***
***
quercetin-3-galactoside
464.5 ± 17.9
810.0 ± 13.8
624.0 ± 20.4
918.0 ± 18.7
186.2 ± 5.1
1381.8 ± 42.5
414.7 ± 3.9
767.8 ± 12.6
482.7 ± 13.1
953.4 ± 19.9
1430.9 ± 26.0
957.0 ± 14.3
***
***
***
quercetin-3-glucoside
66.9 ± 1.6
95.0 ± 4.1
83.4 ± 3.0
106.8 ± 2.8
39.4 ± 1.9
151.9 ± 5.2
68.8 ± 2.4
107.6 ± 3.2
90.3 ± 4.0
137.1 ± 4.1
131.4 ± 3.8
117.2 ± 3.0
***
***
***
quercetin-3-xyloside
167.9 ± 18.1
276.6 ± 18.7
249.8 ± 30.7
308.6 ± 16.3
90.7 ± 10.8
432.6 ± 26.9
187.7 ± 7.9
299.2 ± 14.4
245.7 ± 31.0
419.8 ± 23.3
518.5 ± 30.3
341.4 ± 13.8
***
***
***
quercetin-3-arabinopyranoside
164.2 ± 2.1
218.7 ± 3.5
219.7 ± 5.5
214.0 ± 2.0
101.1 ± 4.4
355.0 ± 6.0
248.8 ± 4.7
293.7 ± 5.5
314.0 ± 4.1
530.4 ± 6.8
501.8 ± 4.6
293.0 ± 7.8
***
***
***
quercetin-3-arabinofuranoside
92.9 ± 6.7
135.5 ± 4.8
140.0 ± 4.3
143.6 ± 3.6
66.5 ± 2.2
202.0 ± 5.7
97.9 ± 1.7
134.3 ± 7.2
173.4 ± 3.9
244.7 ± 4.8
244.1 ± 3.7
110.7 ± 3.5
***
***
***
quercetin-3-rhamnoside
73.7 ± 0.9
92.1 ± 5.2
92.3 ± 2.8
96.6 ± 2.3
69.4 ± 1.7
102.7 ± 2.1
74.8 ± 3.3
100.1 ± 4.0
102.2 ± 3.4
125.8 ± 9.3
114.4 ± 2.4
89.3 ± 4.3
***
**
***
quercetin-3-rhamnosyl hexoside
24.5 ± 1.7
41.6 ± 1.7
23.8 ± 1.1
37.4 ± 1.3
36.2 ± 1.1
11.2 ± 0.4
18.0 ± 1.0
51.1 ± 2.5
traces
traces
traces
33.0 ± 2.0
***
***
***
quercetin dirhamnoside
70.8 ± 4.4
79.2 ± 7.0
161.9 ± 9.7
160.5 ± 7.5
27.3 ± 1.8
277.6 ± 11.8
32.9 ± 1.8
110.1 ± 6.8
87.8 ± 8.4
108.7 ± 9.5
119.1 ± 5.6
160.4 ± 15.7
***
***
***
quercetin derivative
993.4 ± 112.2
1444.4 ± 63.6
1025.0 ± 119.1
1317.3 ± 87.8
623.5 ± 38.5
1645.7 ± 136.9
1007.7 ± 65.5
1673.5 ± 95.1
89.2 ± 5.5
341.2 ± 29.3
79.1 ± 7.6
896.2 ± 33.9
***
***
***
quercetin
65.9 ± 2.9
88.7 ± 2.2
75.6 ± 4.0
79.1 ± 4.7
26.5 ± 3.1
80.9 ± 6.7
36.3 ± 6.7
67.2 ± 2.4
59.8 ± 5.7
70.3 ± 4.2
56.9 ± 4.3
95.8 ± 7.8
***
**
***
kaempferol-3-galactoside
61.1 ± 0.8
86.3 ± 1.4
81.8 ± 2.0
87.7 ± 0.8
45.2 ± 2.0
124.3 ± 2.1
55.6 ± 1.0
94.1 ± 1.8
98.2 ± 1.3
106.6 ± 1.4
149.5 ± 1.4
93.8 ± 2.5
***
***
***
kaempferol-3-glucoside
7.1 ± 0.5
8.3 ± 0.3
11.7 ± 0.4
8.8 ± 0.2
5.1 ± 0.2
7.7 ± 0.2
6.0 ± 0.1
6.1 ± 0.3
9.3 ± 0.2
7.5 ± 0.1
7.5 ± 0.1
3.4 ± 0.1
***
***
***
kaempferol pentoside 1
28.7 ± 1.8
32.8 ± 1.4
30.2 ± 0.7
36.9 ± 2.0
34.5 ± 1.3
39.4 ± 2.1
21.6 ± 1.0
33.1 ± 1.4
18.5 ± 0.9
22.6 ± 0.6
21.3 ± 0.5
27.1 ± 1.1
***
***
***
kaempferol pentoside 2
62.8 ± 1.3
14.9 ± 0.4
29.8 ± 0.8
20.2 ± 0.7
37.2 ± 1.4
22.7 ± 0.8
36.7 ± 1.1
28.9 ± 1.2
132.6 ± 4.2
150.2 ± 6.0
118.8 ± 2.1
22.8 ± 1.0
***
***
***
kaempferol pentoside 3
52.6 ± 2.5
42.1 ± 2.5
53.2 ± 2.6
48.5 ± 2.4
52.8 ± 2.5
52.6 ± 1.5
44.9 ± 0.9
50.0 ± 0.6
60.2 ± 1.2
56.7 ± 1.0
52.5 ± 2.4
26.5 ± 0.5
**
***
***
kaempferol rhamnoside
41.2 ± 1.4
75.4 ± 1.4
47.9 ± 2.0
55.4 ± 1.1
27.3 ± 0.7
86.1 ± 1.4
53.0 ± 2.0
107.5 ± 5.3
54.8 ± 3.0
74.3 ± 1.1
45.0 ± 1.8
76.8 ± 2.0
***
***
***
kaempferol-3-rutinoside
133.3 ± 4.5
135.2 ± 6.6
74.0 ± 3.3
106.8 ± 7.6
76.0 ± 4.1
80.9 ± 5.1
65.5 ± 3.0
95.0 ± 3.5
83.4 ± 3.5
102.4 ± 4.4
102.2 ± 6.3
185.6 ± 4.4
***
***
***
kaempferol derivative
52.4 ± 1.1
82.9 ± 2.0
82.8 ± 2.3
84.0 ± 2.8
62.0 ± 2.3
73.1 ± 2.5
65.5 ± 1.9
90.4 ± 3.7
trace
2.8 ± 0.1
1.4 ± 0.0
61.7 ± 2.6
***
***
***
Naphthoquinones
dihydroxytetralone hexoside
871.5 ± 39.4
730.1 ± 26.1
1462.7 ± 72.0
1756.2 ± 101.6
412.6 ± 44.0
1708.3 ± 40.9
541.9 ± 18.1
1149.1 ± 67.7
741.9 ± 42.9
1203.7 ± 45.8
2380.1 ± 48.7
802.9 ± 68.1
***
***
***
hydrojuglone β-D-glucopyranoside
7881.6 ± 415.7
7211.7 ± 156.6
15482.9 ± 579.3
12960.2 ± 352.5
3442.2 ± 369.0
12488.9 ± 366.3
4376.6 ± 320.7
10187.3 ± 342.3
4208.6 ± 261.1
5600.9 ± 372.0
3896.0 ± 189.1
9190.0 ± 366.9
***
***
***
hydrojuglone
159.4 ± 16.1
85.1 ± 7.6
162.9 ± 13.8
41.4 ± 1.9
63.1 ± 8.0
143.3 ± 6.1
66.0 ± 3.7
72.8 ± 4.5
150.9 ± 16.1
65.4 ± 5.7
113.8 ± 5.3
103.5 ± 10.1
***
***
***
hydrojuglone derivative pentoside
5014.6 ± 234.0
5423.9 ± 119.2
5300.5 ± 238.8
6182.6 ± 134.1
2936.0 ± 76.4
5197.3 ± 223.5
4212.5 ± 218.4
4726.0 ± 160.2
6666.1 ± 202.5
9496.0 ± 261.1
5181.7 ± 272.9
6764.4 ± 381.5
***
***
***
hydrojuglone rutinoside
2528.2 ± 149.4
2906.4 ± 116.1
2751.8 ± 113.5
2407.7 ± 169.0
1060.0 ± 64.1
2689.8 ± 80.4
1065.8 ± 59.5
2445.7 ± 66.4
2014.7 ± 164.7
2635.3 ± 11.8
1790.8 ± 103.7
2644.7 ± 153.9
***
***
***
juglone (5-hydroxy-1,4-naphthoquinone)
800.4 ± 27.0
73.5 ± 3.6
533.1 ± 23.9
205.1 ± 14.7
657.1 ± 35.9
174.8 ± 10.1
673.9 ± 31.0
94.4 ± 3.5
901.0 ± 38.2
73.8 ± 3.2
169.9 ± 10.5
178.3 ± 4.3
***
***
***
1,4-naphthoquinone
63.9 ± 6.5
14.8 ± 1.3
50.1 ± 4.2
13.3 ± 0.6
37.9 ± 4.8
42.1 ± 1.8
42.2 ± 2.4
21.4 ± 1.3
111.0 ± 10.7
24.0 ± 2.1
76.7 ± 3.6
30.4 ± 3.0
***
***
***
Total Kaempferol derivatives
439.2 ± 8.2
478.0 ± 10.1
411.3 ± 2.7
448.1 ± 14.1
340.0 ± 6.1
486.7 ± 7.5
348.7 ± 4.2
505.1 ± 8.2
457.0 ± 1.6
523.0 ± 8.8
498.1 ± 10.2
497.8 ± 4.6
***
***
***
Total Quercetin derivatives
2184.1 ± 124.7
3281.9 ± 97.2
2695.5 ± 141.5
3382.1 ± 124.7
1266.7 ± 22.2
4641.3 ± 213.9
2187.9 ± 76.2
3604.6 ± 122.4
1645.1 ± 37.4
2931.4 ± 40.6
3196.4 ± 56.0
3094.0 ± 93.9
***
***
***
Total Myricetin derivatives
91.3 ± 3.2
216.8 ± 7.4
91.6 ± 5.6
165.6 ± 1.7
59.1 ± 4.3
300.8 ± 5.5
74.2 ± 2.4
202.4 ± 11.3
65.3 ± 1.8
227.4 ± 16.0
284.2 ± 9.9
166.4 ± 6.8
***
***
***
As demonstrated in Fig. 2 (C), the content of total analysed phenolics varied among different cultivars. A comparison of different cultivars was carried out to demonstrate the difference in total analysed phenolic content, as well as showing the representation of different phenolic groups, for each cultivar in healthy leaves. As can be clearly seen, 'Fernette' and 'Fernor' had the highest phenolic content and 'Franquette' and 'Sava' the lowest. The largest increase in TAPC in infected leaves was expected and therefore confirmed, with TAPC increasing by 355% for 'Franquette' and 231% for 'Sava', but only 128% for 'Fernette' and 143% for 'Fernor'.
4 Discussion
In relation to naphthoquinones identified in J. regia, dihydroxytetralone hexoside was identifieded by a fragmentation ion at m/z 159 ([M−H]− – H2O −180), as reported in J. regia leaves (Vieira et al., 2019) and previously reported as an unknown compound (Gawlik-Dziki et al., 2014) Juglone was identified with the help of a standard at m/z 189, which yielded an MS2 fragment of m/z 161 and an MS3 fragment of m/z 117, 133. Hydrojuglone β-D-glucopyranoside was identified, since fragmentation yielded an ion at m/z 175, revealing the loss of a hexosyl moiety (−1 6 2) (Duroux et al., 1998) and, as reported by Ellendorff et al. (2015) as hydrojuglon glucoside, the fragment of MS3 m/z corresponds exactly to the predicted LC – MS spectrum in a negative scan from the The Human Metabolome Database (HMDB), which yielded fragment ions at m/z 131, 157, 103, 115. To the best of our knowledge, hydrojuglon, hydrojuglon rutinoside and the hydrojuglon derivative pentoside have never been detected in J. regia or any other Juglans genus, whether in leaves or in other plant tissue. They yielded distinct fragment ions at m/z 131, 157, 103, 147, 115, as seen in the fragmentation of hydrojuglon β-D-glucopyranoside. 1,4-naphthoquinone was identified with the help of a standard at m/z 173, which yielded an MS2 fragment at m/z 111, 155, 129, 145 that was previously reported as juglone in Juglans mandshurica (Huo et al., 2018)
Flavonols included three groups of compounds: myricetin, quercetin and kaempferol glycosides. Myricetin glycosides were determined with the fragmentation pattern of MS2 ions m/z 316, 317 and MS3 ions m/z 179, 191. Quercetin glycosides showed a clear fragmentation pattern of MS2 m/z 301 and MS3 m/z 179, 151 and kaempferol glycosides showed a fragmentation pattern of MS2 m/z 284, 285 and MS3 m/z 255, 227, as reported by Santos et al. (2013) and Vieira et al. (2019). In addition to the standard and compounds of kaempferol glycosides, the second most abundant fragment ion MS2 (m/z 285) (Ming-Zhi et al., 2015), was further fragmented and produced a fragment ion pattern of MS3 m/z 257, 267, 241, 229, 163, 151 for further confirmation of the compounds, as well as easier determination of kaempferol derivatives, of which the fragment ion m/z 285 was in abundance. The same was done with quercetin glycosides, for which, in the majority of cases, the less abundant fragment ion MS2 (m/z 300) (Ming-Zhi et al., 2015) produced ion fragments MS3 m/z 271, 255 and MS4 m/z 243, 227, 215 for further confirmation of the compounds, as well as easier determination of quercetin derivatives, of which the fragment ion m/z 300 was in abundance. A fragmentation pattern with loss of hexosyl (−1 6 2), pentosyl (−1 3 2) and rhamnosyl (−1 4 6) residues was observed, as reported by Vieira et al. (2019). The majority of compounds have been previously reported (Saldanha et al., 2013; Santos et al. 2013; Vieira et al., 2019).
Flavones included two compounds, santin and 5,7-dihydroxy-3,4-dimetoxyflavone, which were determined with the fragmentation pattern according to Yan et al. (2019). Both compounds have been reported in flowers (Yan et al., 2019) of J. regia, and now for the first time also in leaves of J. regia.
Flavanols included four different procyanidin dimers, with a characteristic fragmentation of MS m/z 577, MS2 m/z 425, 407, 289 (Li et al., 2012; Ortega et al., 2010; Vu et al., 2018; Yan et al., 2019), as well as (+)-catechin and (−)-epicatechin. (+)-Catechin and (−)-epicatechin were determined by fragmentation, in addition to an external standard that produced fragment ions m/z 245, 205, 179 for both (+)-catechin and (−)-epicatechin, suggesting that standards are required in the determination of either of these compounds because they do not discriminate between their fragmentation patterns.
Hydroxycinnamic acids included fifteen compounds. Neochlorogenic acid (3-caffeoylquinic acid) and chlorogenic acid (trans-5-caffeoylquinic acid) were determined with the help of the fragmentation, in addition to an external standard. 3-p-cumaroylquinic acid was determined with the help of fragmentation MS m/z 337, MS2 m/z 163, 191, 173, as reported by Liu et al. (2019), Senica et al. (2016) and Vieira et al. (2019). P-coumaric acid derivatives and hexosides were determined using the p-coumaric acid fragmentation pattern since, after being broken down, the compounds produced the ions m/z 163, 119, as reported by Liu et al. (2019), Vieira et al. (2019) and Vu et al. (2018). [M−H]− at m/z 355 and [M−H]− at m/z 517 were tentatively identified as ferulic acid hexoside and caffeic acid hexoside derivative, based on the MS2 m/z at 193 (ferulic acid - H) and MS3 m/z at 179 (caffeic acid - H), as reported by Vieira et al. (2019).
As predicted, the TAPC and TPC contents were higher in infected leaves as presented in Fig. 1. In Fig. 1 two clusters have formed, the first containing all the infected leaves (Xanthomonas campestris pv. juglandis) and the second all the healthy leaves. This shows us that there is a difference between healthy and infected leaves and that phenolic compounds vary between infected and healthy leaves, suggesting that they play a key role in plant defence and also showing that phenols play a major role in the plant’s response against pathogens (Solar et al., 2005; Treutter, 2005). Fig. 1 clearly shows that the total phenolic content in the infected leaves increased in all cultivars, irrespective of the cultivar. The difference in total phenolic compounds between infected and healthy cultivars was attributed to the high phenolic response of the plant to the pathogen attack. For some economically important pests and diseases of plants in general, it is reported that a specific phenolic group of compounds is responsible for the plant’s response (Mikulic-Petkovsek et al., 2008; Treutter and Feucht, 1990). In our case, the contents of flavanols and total hydroxycinnamic acids were higher in infected than in healthy leaves, as predicted and in agreement with Treutter (2005). Flavanols and hydroxycinnamic acids may therefore play a key role in induced resistance to walnut bacterial blight and in the biochemical process of the walnut's response to this economically important disease. Fig. 2 (A) shows both the overall and individual reactions of flavanols to walnut bacterial blight in all cultivars, thus supporting the previous statement. Further investigation of individual flavanols revealed that all analysed individual flavanols respond to walnut bacterial blight in the same way, therefore further suggesting that flavanols play a key role in the response against walnut bacterial blight. Interestingly, two procyanidin dimers (3,4) were found only in traces in healthy leaves of all cultivars, whereas they were easily detectable in all cultivars in infected leaves. Further investigation into individual hydroxycinnamic acids did not show a clear picture, since not all hydroxycinnamic acids responded the same to the infection. Only a few specific hydroxycinnamic acid compounds showed a uniform response to walnut bacterial blight in all cultivars, but for better understanding, more work will have to be done on this topic in the future.
In relation to other phenolic groups, no clear picture was given because the reaction of each cultivar was different, thus suggesting that different walnut cultivars react differently to infection. The thesis that juglone and other naphthoquinones act as protective compounds against microorganisms or as a defence mechanism against walnut bacterial blight (Duroux et al., 1998; Solar et al., 2005) should be further investigated, since naphthoquinones reacted differently but uniformly between cultivars, questioning their role in the plant’s response to walnut bacterial blight. Juglone content in the leaves was higher, with 170–900 mg 100 g−1 dry weight, depending on the cultivar, whilst a lower content was reported by Cosmulescu et al. (2011) and Nour et al. (2013). However, they addressed the content in fresh weight. The difference in juglone content is probably the result of expressing the results in dry weight rather than fresh weight by the other two authors, but for a better comparison, expressing the results in dry weight seems to be more appropriate to allow better comparison. To the best of our knowledge, 1,4 - naphthoquinone has never been quantified in walnut leaves, so a comparison is not possible. However, the concentration was similar to that measured by Solar et al. (2006) in annual shoots. As reported by Solar et al. (2006), naphthoquinones represent the largest proportion of phenols. Without MS, only two naphthoquinones were determined (Solar et al., 2006). With the help of MS, another five have been determined, with Vieira et al. (2019) reporting the presence of dihydroxytetralone hexoside for the first time and our research confirming his findings, and Duroux et al. (1998) reporting hydrojuglone β-D-glucopyranoside, which was also positively identified in our research. Three, to our knowledge unknown, new naphthouquinones were determined: hydrojuglone derivative pentoside, hydrojuglone and hydrojuglone rutinoside. Together, hydrojuglone derivative pentoside, hydrojuglone and hydrojuglone rutinoside accounted for about 20% of the total naphthoquinones in the leaves, providing an interesting new insight into walnut leaf composition. Neither dihydroxytetralone hexoside nor hydrojuglone β-D-glucopyranoside have so far been quantified. Interestingly, hydrojuglone β-D-glucopyranoside, hydrojuglone and juglon were found in the leaves of J. regia. If suggestions are correct that juglone forms from hydrojuglone, and hydrojuglone from hydrojuglone β-D-glucopyranoside (Duroux et al., 1998), both precursors that form juglon were found in both healthy and infected leaves of all our studied cultivars.
Total naphthoquinone content varied among cultivars, thus suggesting that walnut bacterial blight probably does not affect the naphthoquinone content. Since naphthoquinones accounted for about 60–70% of phenols in healthy leaves and only about 40–50% in leaves infected with bacterial blight, we can assume that their role in the leaves is not defensive but different, e.g. as allelopathic compound (Cosmulescu et al., 2011; Topal et al., 2007). The concentration of flavonols tended to increase in 5 out of 6 cultivars, as shown in Fig. 2 (B), but no difference was found in 'Rubina', suggesting that different cultivars may have different response mechanisms to walnut bacterial blight. Further studies on myricetin, kaempferol and quercetin glycosides should be carried out to determine which, if any, play a role as an active defence mechanism against walnut bacterial blight.
5 Conclusions
No clear picture on how the other individual phenolics play a part in a plant’s response to walnut bacterial blight was given, since different cultivars responded differently to the same infection, showing that more cultivars are needed when studying a plant’s response.
The lack of research on J. regia leaves composition was challenging, so pioneering work in compound determination was done. We quantified several never before quantified compounds, as well as confirming two new flavone compounds in leaves of J. regia and three naphthoquinone compounds that, to the best of our knowledge, have never previously been reported in J. regia. Furthermore, two naphthoquinones that allegedly play an active role in the process of juglone formation were confirmed in all six cultivars. In the process of MS fragmentation, compounds were fragmented up to MS6 fragments and, in some cases, both MS2 fragments were further fragmented, providing comprehensive data for future studies, and confirmation of selected compounds. The present study presents both interesting work on aspects of compound identification, as well as interesting results in comparing the bioactive response to leaf infection with Xanthomonas campestris pv. juglandis.
Disclosure of funding
This work is a part of programme P4-0013–0481 funded by the Slovenian Research Agency (ARRS). The authors declare that they have no conflict of interest.
Disclosure of any conflict of interest
The authors declare that they have no known competing financial interests or personal relationships that could have appeared to influence the work reported in this paper.
References
- Juglone Content in Leaf and Green Husk of Five Walnut (Juglans regia L.) Cultivars. Notulae Botanicae Horti. Agrobotanici Cluj-Napoca. 2011;39(1):237-240.
- [Google Scholar]
- Donik-Purgaj, B., Godec, B., Hudina, M., Koron, D., Solar, A., Usenik, V. and Mrzlic, D., 2020. Introdukcija sort - 2019. Poročilo strokovne naloge. Javna služba v sadjarstvu, Ljubljana 52-57.
- Duroux, L., Delmotte, F.M., Lancelin, J.M., Kéravis, G. and Jay-Allemand, C., 1998. Insight into naphthoquinone metabolism: β-glucosidase-catalysed hydrolysis of hydrojuglone β-d-glucopyranoside. Biochem. J., 333, 275–283. .
- Ellendorff, T., Brun, R., Kaiser, M., Sendker, J. and Schmidt T., 2015. PLS-Prediction and confirmation of hydrojuglone glucoside as the antitrypanosomal constituent of Juglans spp. Molecules 20, 10082–10094. https://dx.doi.org/10.3390%2Fmolecules200610082.
- Bioassay-guided identification of the antihyperglycaemic constituents of walnut (Juglans regia) leaves. J. Funct. Foods. 2016;26:731-738.
- [CrossRef] [Google Scholar]
- Nutraceutical potential of tinctures from fruits, green husks, and leaves of Juglans regia L. Sci. World J.. 2014;2014:1-10.
- [CrossRef] [Google Scholar]
- Sedative effect of walnut leaf extract and juglone, anisolated constituent. Pharm. Biol.. 1998;36(4):280-286.
- [CrossRef] [Google Scholar]
- Identification and characterization of major constituents in Juglans mandshurica using ultra performance liquid chromatography coupled with time-of-flight mass spectrometry (UPLC-ESI-QTOF/MS) Chin. J. Nat. Med.. 2018;16(7):525-545.
- [CrossRef] [Google Scholar]
- Identification of juglone in pecan as a possible factor of resistance to Fusicladium effusum. J. Agric. Food Chem.. 1979;27(1):92-94.
- [CrossRef] [Google Scholar]
- Micropropagation of Persian walnut (Juglans regia L.) high-tech and micropropagation II. Berlin: Springer; 1992. p. :136-150.
- Identification of A-series oligomeric procyanidins from pericarp of Litchi chinensis by FT-ICR-MS and LC-MS. Food Chem.. 2012;135(1):31-38.
- [CrossRef] [Google Scholar]
- Characterisation of phenolics in fruit septum of Juglans regia Linn. by ultra performance liquid chromatography coupled with Orbitrap mass spectrometer. Food Chem.. 2019;286:669-677.
- [CrossRef] [Google Scholar]
- Identification and quantification of the major phenolic constituents in Juglans regia L. peeled kernels and pellicles, using HPLC–MS/MS. Food Chem.. 2021;352:129404.
- [CrossRef] [Google Scholar]
- Increased phenolic content in apple leaves infected with the apple scab pathogen. J. Plant Pathol.. 2008;90:49-55.
- [CrossRef] [Google Scholar]
- Chemical profile of black currant fruit modified by different degree of infection with black currant leaf spot. Sci. Hortic.. 2013;150:399-409.
- [CrossRef] [Google Scholar]
- Phenolic response in green walnut husk after infection with bacteria Xanthomonas arboricola pv. jugalandis. Physiol. Mol. Plant Pathol.. 2011;76:159-165.
- [CrossRef] [Google Scholar]
- Analysis of Flavonoids in Lotus (Nelumbo nucifera) Leaves and Their Antioxidant Activity Using Macroporous Resin Chromatography Coupled with LC-MS/MS and Antioxidant Biochemical Assays. Molecules. 2015;20(6):10553-10565.
- [CrossRef] [Google Scholar]
- HPLC Determination of Phenolic Acids, Flavonoids and Juglone in Walnut Leaves. J. Chromatogr. Sci.. 2013;51(9):883-890.
- [CrossRef] [Google Scholar]
- Comparative study of UPLC-MS/MS and HPLC-MS/MS to determine procyanidins and alkaloids in cocoa samples. J. Food Compos. Anal.. 2010;23(3):298-305.
- [CrossRef] [Google Scholar]
- Characterization of Flavonoids and Phenolic Acids in Myrcia bella Cambess. Using FIA-ESI-IT-MSn and HPLC-PAD-ESI-IT-MS Combined with NMR. Molecules. 2013;18:8402-8416.
- [CrossRef] [Google Scholar]
- Leaves and decoction of Juglans regia L.: different performances regarding bioactive compounds and in vitro antioxidant and antitumor effects. Ind. Crops Prod.. 2013;51:430-436.
- [CrossRef] [Google Scholar]
- Phytochemical study of Juglans regia L. leaves. Phytochem.. 2017;144:58-70.
- [CrossRef] [Google Scholar]
- Processed elderberry (Sambucus nigra L.) products: A beneficial or harmful food alternative? Food Sci. Technol.. 2016;72:182-188.
- [CrossRef] [Google Scholar]
- Analysis of total phenols and other oxidation substrates and antioxidants by means of Folin-Ciocalteu reagent. Meth. Enzymol.. 1999;299:152-178.
- [CrossRef] [Google Scholar]
- Phenolic content of walnut fruit as affected by cultivar and developmental stage. Acta Hort.. 2005;705:231-240.
- [Google Scholar]
- Seasonal variations of selected flavonoids, phenolic acids and quinones in aanual shoots of common walnut (Juglans regia L.) Plant Sci.. 2006;170:453-461.
- [CrossRef] [Google Scholar]
- Correlations between Xanthomonas arboricola pv. juglandis severity and endogenous juglone and phenolic acids in walnut. J. Plant Pathol.. 2012;94(1):229-235.
- [CrossRef] [Google Scholar]
- Solar, A. Selekcija lupinarjev - 2019., 2020. Poročilo strokovne naloge. Javna služba v sadjarstvu, Ljubljana 1-19.
- Traditional walnut liqueur –cocktail of phenolics. Food Chem.. 2006;95(4):627-631.
- [CrossRef] [Google Scholar]
- Inhibitory effects of plumbagin and juglone on azoxymethane-induced intestinal carcinogenesis in rats. Cancer Lett.. 1998;127(1-2):177-183.
- [Google Scholar]
- The pattern of flavan-3-ols in relation to scab resistance of apple cultivars. J. Hortic. Sci.. 1990;65(5):511-517.
- [CrossRef] [Google Scholar]
- Significance of flavonoids in plant resistance and enhancement of their biosynthesis. Plant Biol.. 2005;7:581-591.
- [CrossRef] [Google Scholar]
- Phenolic profile, antioxidant and antibacterial properties of Juglans regia L. (walnut) leaves from the Northeast of Portugal. Ind. Crop. Prod.. 2019;134:347-355.
- [CrossRef] [Google Scholar]
- Identification and characterization of phenolic compounds in black walnut kernels. J. Agric. Food Chem.. 2018;66(17):4503-4511.
- [CrossRef] [Google Scholar]
- Variation among Persian Walnuts in Response to Inoculation with Xanthomonas campestris pv. Juglandis. J. Am. Soc. Hortic. Sci.. 1992;117(3):527-531.
- [Google Scholar]
- Separation and analysis of flavonoid chemical constituents in flowers of Juglans regia L. by ultra-high-performance liquid chromatography-hybrid quadrupole time-of-flight mass spectrometry. J. Pharm. Biomed. Anal.. 2019;164:734-741.
- [CrossRef] [Google Scholar]
Appendix A
Supplementary data
Supplementary data to this article can be found online at https://doi.org/10.1016/j.jksus.2022.101890.
Appendix A
Supplementary data
The following are the Supplementary data to this article:


