

Translate this page into:
HSPiP and quality by design aided optimized bioanalytical method development for amphotericin B quantification from plasma samples
⁎Corresponding author at: School of Pharmaceutical Sciences, Lovely Professional University, Phagwara, Punjab, India. mohhammad.26652@lpu.co.in (Mohhammad Ramzan)
-
Received: ,
Accepted: ,
This article was originally published by Elsevier and was migrated to Scientific Scholar after the change of Publisher.
Abstract
Amphotericin-b (AmB) is a broad-spectrum polyene macrolide antifungal and anti-Leishmaniosis. We addressed HSPiP and QbD (quality by design) oriented HPLC (high-performance liquid chromatography) method development and validation, followed by identifying critical attributes on retention time (RT) and peak area (PA). Various quality control parameters were estimated, such as the LLOQ (lower limit of quantification) and LLOD (lower limit of detection). HSPiP and experimental solubility data were the best fit in the prediction. QbD identified acetic acid (AA) pH, column temperature, and flow rate as the prime factors having an impact on PA and RT. The optimized mobile phase included AA, acetonitrile, and methanol (05:85:10) at pH 5 fluxed into the column maintained at 30 °C. The method was sensitive, as evidenced by the low values of LLOQ (1.6 ng/mL) and LLOD (10 ng/mL) and high recovery from the plasma. The method determined pharmacokinetic parameters from the rat plasma with high accuracy, precision, robustness, sensitivity, and reproducibility.
Keywords
AmB
HSPiP and QbD oriented optimization
Validation parameters
Pharmacokinetic parameters estimated from rat plasma

1 Introduction
Amphotericin B (AmB) is a potent polyene lipophilic antifungal with high toxicity due to aggregation behavior (Tiphine et al., 1999). Moreover, it has a complicated structure, flexible conformational properties, inability to be crystallized, and two pKa values (10 and 5.7) (Faustino and Pinheiro, 2020). The reported analytical methods revealed poor sensitivity and expensive techniques to quantify AmB. Soto et al. developed HPLC methodology using a binary solvent mixture of acetonitrile and 0.005 M aqueous solution of disodium EDTA (ethylene diamine tetra AA) (30:70). However, longer run time (12.5 min) and a high linear concentration range (1 – 200 µg/mL) challenged its sensitivity to assay from the biological sample (Soto et al., 2022). AA improves the efficiency of HPLC based analysis which may be due to pH dependent solubility (pH < 5) and self-aggregation in aqueous solutions. AmB was estimated from the plasma and sputum at low quantification limit (5 ng/mL in plasma and 10 ng/mL in sputum) using a solid phase extraction (SPE) C2 cartridge (Campanero et al., 1997). However, the SPE method was challenged with a low extraction, poor recovery, high volume of organic solvent, and poor reproducibility (Rawa-Adkonis et al., 2006). Espada et al. focused on selective analysis of AmB (from a biological sample) using the reverse phase HPLC technique (C18 column) by optimizing acetonitrile, AA, and water content in the mobile phase (52:4.3:43.7 v/v). However, longer run time (15 min) and RT (12 min) need to be re-evaluated (Espada et al., 2008). In a study, a gradient mode of HPLC (C18) was studied for the rat plasma using acetonitrile and sodium acetate buffer (10 mM) at pH 4.0 with longer run time (15 min) and RT (6.8 min) (Italia et al., 2009). Marena et al. summarized a comprehensive report on HPLC based methods of AmB analysis (Marena et al., 2022).
HSPiP (Dr. techn. Charles M. Hansen Jens Bornøsvej 16, 2970 Hørsholm, Denmark) is a predictive program to select solvents based on theoretical solubility, Hansen parameters (HSP) and RED (relative energy difference) values (Hansen, 2007). Moreover, the QbD oriented optimization process harnessed the right composition of the selected solvents and identified the impact of various prime factors on RT and PA. Lastly, the methodology was effectively applied to determine the PK (pharmacokinetics) parameters of the developed formulation after the parenteral product (Ramzan et al., 2022).
2 Materials
Amphotericin B (AmB > 99 % pure) was a kind gift from Kwality Pharmaceuticals, Amritsar (Punjab) India. Soya Phospholipon 90G (P 90G) and Lipid (Compritol 888 ATO) were obtained as gift samples from Lipoid (Frigenstrabe 4, 67,065 Ludwigshafen am Rhein, Germany) and Gattefosse (Immeuble Kastle, 2 Ter Rue du Château, 92,200 Neuilly-sur-Seine, France), respectively. Solvents were purchased from S.D. Fine Chemicals Ltd. Mumbai, India. Analytical grade methanol and acetonitrile were procured from Sigma-Aldrich, Mumbai, Maharashtra, India. Surfactants and co-solvent (tween 80 and polyethylene glycol 400) were purchased from Himedia (Mumbai, Maharashtra, India).
3 Methods
3.1 HSPiP assisted predicted solvents and combinations
HSPiP software is fundamentally based on the concept of the total energies (cohesive) existing in a material. Generally, it divided the total Hildebrand value into three components, such as the dispersion force component (expressed as δd), an H-bonding component (δh), and a polar component (δp) (equation (1). Therefore, Hansen divided solvents into two basic classifications as (a) bad and (b) good solvents. RED value was adopted to flag a solvent as good or bad. Therefore, a solvent RED value < 1 was considered “good” and vice versa (Hussain et al., 2023a). Thus, the Hansen sphere of a solute enclosing solvents suggests suitable solvents for the solute of the test (Hansen, 2007). Subsequently, the theoretical model was quite difficult to implement. A retention inconsistency credited to the column temperature and the mobile phase composition was experimentally obtained and numerically investigated (Ribar et al., 2022).
3.2 Solubility study in the predicted solvents
In brief, a precise amount of AmB was placed in the glass vial containing solvent. Each set was placed into a water shaker-bath operating at 40 °C and 50 rpm for 72 h. To establish equilibrium, the addition was continued till saturation. The vial containing the mixture was centrifuged (2200 × g for 10 min) to get the supernatant for analysis using a UV Vis spectrophotometer at 383 nm (U1800, Hitachi, Japan).
3.3 Factor screening study using Taguchi design model
For sensitive, accurate, and precise estimation of AmB from the biological sample or non-biological sample, it is a prerequisite to screen out the prime factors affecting the analysis in the HPLC tool. Taguchi design is a well-known model for this purpose. After screening, the results were obtained as Pareto charts and half-normal charts (Hussain et al., 2023b).
3.4 Optimization Studies
We attempted to identify critical material and critical process variables using Design Expert software (Minneapolis, MN 55413, USA) (Hussain et al., 2023a). This approach was implemented by screening seven factors. Considering the physicochemical properties of AmB, stability, and literature-based data, various factors were considered, such as pH, AA, flow rate, injection volume, acetonitrile (ACN) content, column temperature, and sample vial temperature. These are the prime factors affecting the chromatographic PA (mAU) and RT (min) (Bhagyasri et al., 2023; Hussain et al., 2024). Furthermore, the levels of each factor (independent variable) were decided against the set responses with the provided constraints. PA (Y1) and RT (Y2) were two investigated responses in the study. The low and high levels were expressed as + 1 and – 1, respectively, in QbD. The model was validated by estimating the desirability function parameter (equation (2), which indicates the best fit of the model.
Based on Taguchi preliminary screening of factors, three independent variables, such as AA pH (A), flow rate (B), and column temperature (C) were investigated. These were chosen for further optimization to find the impact of these factors on Y1 and Y2. For three factors, a Box–Behnken design (BBD) was the suitable model for optimization at three levels (33). Other factors were kept constant at their nominal levels for the development of a reproducible and robust analytical method (HPLC, Waters, USA) (Patel et al., 2023).
3.5 HPLC instrumentation conditions
HPLC was a good alternative for AmB quantification (Bhagyasri et al., 2023). HSP program predicted the right combination of “ACN, methanol, and water” or “ACN, water, and AA” (Campanero et al., 1997). We used HPLC coupled with photodiode array (PDA) detector (Alliance e2695, Waters Corporation, 34 Maple Street, Milford, USA) and a C18 column (an X-Bridge as high purity base-deactivated silica). Notably, the stabilized solubility of AmB, its economic, ecofriendly nature, and the suitability of the mobile phase for column safety were taken into consideration for the selection of the mobile phase. Analysis was carried out in an isocratic mode using a range of wavelengths in PDA and the flow rate of 1 mL/min. Furthermore, data were processed and analyzed using HPLC software (Waters, USA). AmB assessment was linear (r2 = 0.999) over the concentration range of 1.0 – 100.0 µg/mL.
3.6 Plasma sample processing method
Rats of both sexes (300–350 g) were used after getting approval from the institutional committee (approved by the IAEC of Panjab University, Chandigarh, India vide letter no. PU/45/99/CPCSEA/IAEC/2019/330, dated 26/9/2019). Animals were quarantined (12 h) in respective cages with access to food and water. The protocol and procedure were adopted as per ARRIVE guidelines. The collected blood was immediately centrifuged at 10,000 rpm for 10 min. After centrifugation, a drop of organic solvents (chloroform and methanol in 2:1) was added to the plasma to precipitate the protein. The precipitated protein was removed and the protein-free plasma was stored at − 20 °C. A working standard solution of AmB was freshly prepared in 0.1 M NaOH (1000 μg/mL). It was further diluted to get a solution of low concentration (10 μg/mL). Moreover, a working concentration range of AmB in the plasma was prepared by spiking 10 μL (10 μg/mL solution) to achieve a concentration range of 10––1000 ng/ mL.
3.7 Validation of analytical method: HPLC
Bioanalytical method validation for quantification of AmB in the rat plasma (withdrawn from the rat eye) was carried out according to US FDA guidelines and bioanalytical method validation (US FDA, 2018). The method was validated in terms of system suitability, specificity, sensitivity, recovery, precision and accuracy, linearity, and matrix effect of AmB during sample analysis.
3.8 Calibration curve
From the stock solution of AmB, a serial spike of plasma was carried out. A total of eight concentrations was used to construct a linear graph (concentration versus PA) over concentration range of 10–1000 ng/mL. The final volume was made using the mobile phase. Each sample was passed through a membrane filter to avoid any blockage. The obtained dilutions were serially injected to record the chromatographic peak-area. A standard calibration curve was established. A linear regression correlation was estimated using Microsoft Excel.
3.9 Preparation of quality control samples
The quality control samples are important to get the most robust and reproducible validated method for AmB estimation with high precision, selectivity, and sensitivity. Therefore, three quality control samples (QCs) were prepared in the same matrix as per the ICH Q2 (R1) guideline (ICH, 2005). The low quality control (LQC), medium quality control (MQC), and high-quality control (HQC) samples at 100, 500 and 1000 ng/mL of AmB, were prepared on the same day as per the following equations (3) and (4) of standard deviation, respectively.
3.10 System suitability
For its reliability, an analytical tool should be robust and sensitive throughout the analysis process. Therefore, it is important to corroborate the system's suitability before analysis of the test sample. A series of samples from MQC were injected to get the desired chromatogram under the experimental condition without involving a tangible sample. For this, the system suitability was established by developing an AUC for the MQC (without spiking into plasma), and an average AUC value for the MQC was used to leverage further injected samples (n = 6). It plays a crucial role in verifying the holistic functionality of the system on a day-to-day basis to achieve an optimized methodology with a minimum signal-to-noise ratio (Coleman et al., 2001).
3.11 System specificity
To confirm the system specificity, it was required to run the blank plasma and studied negate any interfering peaks near or close to RT exhibited by AmB.
3.12 Method sensitivity
To confirm the sensitivity of the developed method, it was imperative to inject the sample to determine LLOQ and LLOD for AmB. Therefore, a series of samples of known concentrations were injected and run to observe the signal-to-noise ratio (S/N). The acceptable limit of the S/N ratio for LLOD was ≤ 3, whereas it was ≥ 10 for LLOQ (Coleman et al., 2001; ICH, 2005).
3.13 Extraction recovery (ER)
This was a comparative analysis of two samples of the same concentration. The ER was calculated for two analytes (from the known concentration of the standard solution and AmB spiked into plasma). Both samples were run into the system to obtain peaks for comparison. The PA of the extracted QC sample must be lower than the PA of the un-extracted QC (representing 100 % recovery) (Coleman et al., 2001). The result must be reproducible and acceptable regardless of ER (ICH, 2005). Finally, mean ER was reported.
3.13.1 Inter-day and intra-day precision and accuracy
To determine the precision and accuracy of the method, it was necessary to quantify three QC samples (LQC, MQC, and HQC) on the same day (intra-day) as well as on three different days (inter-day variations). A comparison of the mean experimental concentrations determined for the assayed QC samples with their theoretical/ nominal values gives accuracy of the procedure. The relative standard deviation (% RSD) of the observed values was calculated as an index of precision using equation (5).
3.14 Preparation of amphotericin B loaded solid lipid nanoparticles (AmB-SLN)
SLNs of AmB were prepared as per the method reported earlier by us (Ramzan et al., 2022). Therefore, the analytical methodology was further explored for accurate, sensitive, reliable, and reproducible analytical HPLC method for AmB assay from the plasma sample after parenteral delivery. The study was designed to investigate a comparative analysis of the three different samples of AmB.
3.15 Determination of AmB in rat plasma after parenteral delivery
The utility of the developed bioanalytical method of AmB is to determine the AmB in the rat plasma with high accuracy and selectivity. Three formulations (AmB-SLNs, AmB-SUS, and Amb-MKT) were used to study the plasma drug concentration after parenteral delivery at the dose of 3.2 mg/kg (Abdollahizad et al., 2023). Groups (1), 2, 3, and 4 served the negative control, AmB-SUS treated, AmB-MKT treated, and AmB-SLNs treated respectively. The blood sample (0.22 mL) was withdrawn from the retro orbital plexus at different time intervals (0, 0.5, 1, 2, 4, 8, 12, and 24 h). The extracted plasma samples were treated with a protein precipitating agent. After suitable dilutions of the supernatant, the AmB containing sample was injected into the HPLC instrument for AmB assay. A graph was plotted between AmB concentrations in the plasma vs time profile. Various bioavailability parameters were obtained after processing the data of each AmB formulation for the comparative PK parameters. The values of area under curves (AUC0–t and AUMC0–t), the highest plasma concentration (Cmax), the time required (Tmax) to reach Cmax, MRT (mean residence time), the volume of distribution (Vd), T1/2, and Ke were obtained using a PK solver (version 1.1).
4 Results and discussion
4.1 Predicted solubility and Hansen parameters
HSPiP program predicted various Hansen parameters as shown in Table 1 (theoretical aspect based qualitative and quantitative solubility) (Hansen, 2007). The high value of δd (18.8 MPa1/2) is a clear indication of high hydrophobicity as compared to other HSP values. Theoretical and practical aspects are quite close to the predicted values of AmB. AmB is highly insoluble in water due to unique structural properties (polyene) as shown in Fig. 1A-D. As the name suggests, it is chemically amphoteric due to hydrophobic nature of polyene (main contributor of δd) and hydrophilic nature of polyol (main contributor of δp and δh) (Soto et al., 2022). Similarly, HSP distance provided information on how distant is AmB from the solvent. HSPiP estimated 45.3 and 11.5 as the maximum and minimum HSP distance for water and ethyl acetate, respectively (Table 1). It is prudent to correlate its polarity values with water and ethyl acetate for the high and low HSP distance, respectively. The minimum difference of HSP, the maximum is solubility. An attempt has been made to predict the combination of solvents to get maximally lowest value of RED as shown in Table 1. Six sets were predicted with estimated values of HSP distance and RED. It was observed that AA and EA were two major solvents responsible for reducing RED value in the mixture of acetonitrile and methanol. Set II and VI were found to have minimum RED values for selection. However, set II contains a high content of ethyl acetate (as a green solvent in combination with ethanol) which may not be suitable for the miscibility of aqueous content (Haq et al., 2017). Moreover, system suitability, the safety of the column, and solvents miscibility were the main basis for the mobile phase component selection. Therefore, set IX can be a promising combination of solvents for the mobile phase of AmB estimation in HPLC containing the least content of AA (∼ 5 %v/v) and high content of acetonitrile (85 %) to develop stable solubility in the aqueous phase. The HSPiP assisted in rendering a proper ratio of the components (ACN, water, and AA) as shown in set IX (Table 1). Despite the higher value of RED, set IX was selected based on the feasibility and safety concerns in the analysis. The acidic nature of the mobile phase was considered for high peak resolution without tailing and broadening. Footnote: AmB: Amphotericin B, DMA: Dimethylacetamide, AA: Acetic acid, ACN: Acetonitrile, EA: Ethyl acetate, EDTA: Ethylene diamine tetra acetic acid.
Name
HSP values estimated
Excipients
Predicted solubility@40 °C (%w/w)
δd
δp
δh
δt
RED
HSP distance
AmB
−
18.8
0.1
0.1
18.8
−
−
Water
0.0051
15.5
16.0
42.3
47.6
2.9
45.3
Methanol
4.93
14.7
12.3
22.3
29.9
1.6
25.3
Ethanol
3.47
15.8
8.8
19.4
25.0
1.4
20.4
Acetonitrile
3.88
15.3
18.0
6.1
24.3
1.6
19.5
Ethyl acetate
1.85
15.8
5.3
7.2
18.5
0.66
11.5
DMA
1.87
16.8
11.5
9.4
24.0
0.95
15.7
EDTA
0.56
16.4
9.2
21.7
28.7
−
23.9
Acetic acid
8.32
15.2
6.6
13.6
21.4
1.0
16.6
Predicted HSP and RED parameters for the suggested combination of solvents
Binary solvents
Solvents predicted
%
RED
δd
δp
δh
HSP
Set I
AA
90
1.38
13.2
ACN
10
Set II
EA
90
1.22
11.3
ACN
10
Set III
ACN
27
2.53
23.4
Methanol
70
AA
3
Set IV
EA
33
1.86
17.3
ACN
47
Methanol
20
Set V
AA
33
1.92
17.9
ACN
47
Methanol
20
Set VI
AA
23
1.32
12.0
ACN
17
EA
60
Set VII
ACN
85
2.25
20.9
AA
5
Water
10
Set IX
ACN
85
2.13
10.2
AA
5
Methanol
10
SMILE
AMB
“CC1C = CC = CC = CC = CC = CC = CC = CC(CC2C(C(CC(O2)(CC(CC(C(CCC(CC(CC(=O)OC(C(C1O)C)C)O)O)O)O)O)O)O)C(=O)O)OC3C(C(C(C(O3)C)O)N)O”
Water
“OH”
Methanol
“CO”
Acetonitrile
“CC#N”
Ethyl acetate
“CCOC(=O)C”
N, N-dimethyl acetamide
“CC(=O)N©C”
EDTA
“C(CN(CC(=O)[O-])CC(=O)[O-])N(CC(=O)O)CC(=O)O”
AA
“CC(=O)O”
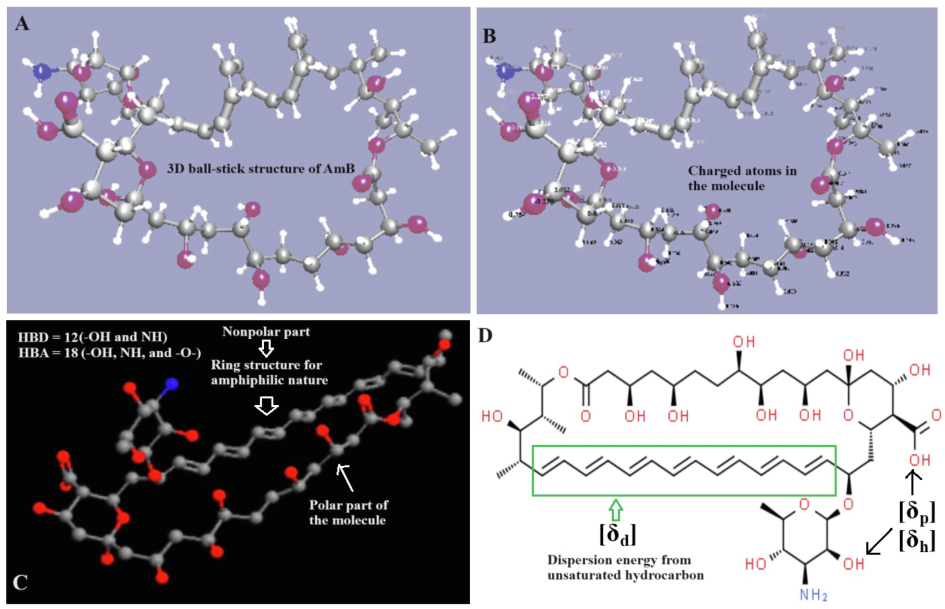
Structural analysis of AmB using HSPiP. (A) 3D ball stick illustration of AmB (blue ball represents NH2 group and pink balls are oxygen atom), (B) AmB with charge using HSPiP based software, (C) 3D structure of AmB exhibiting ring structure (partially hydrophobic hydrocarbon and partially polar part in the molecule), and (D) Bond structure of AmB illustrating Hansen solubility parameters origin due to functional groups and hydrocarbon basic structure (green rectangular for polyene and saturated hydrocarbon with multiple –OH groups for polyol).
4.2 Experimental solubility and correlation with the predicted solubility
An experimental solubility study was conducted in the predicted solvents and the results are presented in Fig. 2A-C. Fig. 2A illustrated HSP position of acetonitrile (∼ 19 outside sphere), ethyl acetate (∼11 inside the sphere), and AA (16.6) in the Hansen sphere. The combination of set VI resulted in RED value of 1.32 close to the sphere surface whereas set IX was associated with RED value of 2.13. The ratio was predicted by HSPiP. In practice, despite higher RED, set IX was selected due to solvent compatibility, miscibility, and column safety. Fig. 2B elicited a pattern of theoretical and experimental solubility of AmB in the explored solvent at 40 °C. The predicted values were closely related to the experimental values. Therefore, a correlation was established between the theoretical and the experimental data as shown in Fig. 2C. The steeper slope of the straight line exhibited a positive correlation with a high value of 0.82. Thus, the adopted model was the best fit for prediction.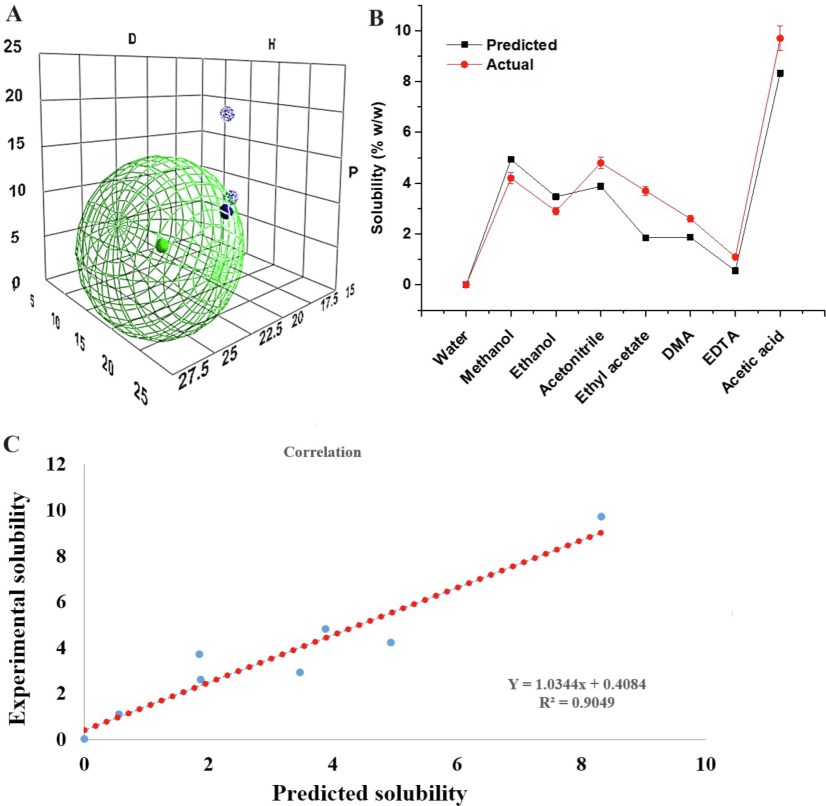
HSPiP generated Hansen sphere (green ball for the drug) for AmB and three best selected solvents (ethyl acetate, acetic acid, and acetonitrile in proper ratio, set VI), (B) HSPiP based predicted and experimental (actual) solubility pattern at 40 °C, and (C) correlation (positive correlation of 0.82) between the predicted and actual solubility values. Deep blue and light blue balls are solvents.
5 Factor screening study using Taguchi design model
The model identified three major factors (A, B, and C) that have direct impact on Y1 and Y2 (supplementary Table S1). Therefore, these three factors must be considered while analytical method development for a product of AmB. Pareto and half-normal charts are portrayed in supplementary figure S1. Taguchi method consists of three basic steps such as experimental design, S/N ratio, and optimization to investigate the effect of A, B, and C on the performance of HPLC. Therefore, these factors were further considered for the next step of the optimization process using the Box-Behnken design for a robust and reproducible analytical method (Patel et al., 2023).
5.1 Optimization using the Design of Experiment (DoE)
The optimized conditions render the most economic and time-saving analytical conditions required for routine analysis. Table 2 provides a summary of BBD runs (17), factors (3), levels (3), and constraints (minimum for Y1 and maximum for Y2). Fig. 3A-F exhibited 3-D and 2-D contour plots of three factors against RT. The impact of flow rate and AA pH was quadratic which needs to be optimized for optimal performance. The optimal pH and flow rate could be 5.0 and 1.0 mL/min, respectively (Fig. 3A-B) due to pH-dependent solubility of AmB. AmB is supposed to be soluble at an extreme pH range (12 ˃ soluble < 3) in water (Waugh, 2007). Essentially, AmB seeks acetonitrile and slight acidic nature of the mobile phase for well resolved peak. Methanol results in poor separation and unsymmetrical peak as compared to acetonitrile at pH 4.0 (Italia et al., 2009). To avoid acetonitrile-caused peak broadening and tailing, ethyl acetate (EA) can be used in the mobile phase for precise estimation of AmB (Haq et al., 2014) [34]. It was found that Y1 was remarkably increased with a slight increment in pH beyond 5 as shown in Fig. 3B. Therefore, the optimal RT was suggested at weakly acidic pH for AmB (pH 5.0). Fig. 3C-D elicited the combined impact of the column temperature and pH. The column temperature showed a rapid decrease in RT with an increase in temperature followed by a constant effect (beyond 30 °C). A similar effect was observed by others wherein the column temperature of 25 °C resulted in the same peak properties as obtained at 40 °C (Su et al., 2018). Thus, the column temperature beyond 30 °C could not be promising for an efficient analytical method of AmB estimation and the chosen temperature was 30 °C as predicted in HSPiP. The optimized column temperature was implemented.
Significant Factors and levels
Responses
Goal
Design
runsAA pH
(A)Flow rate
(B)Column temperature
(C)
1
5.5
1.0
35.0
Peak retention time (min) as Y1
Minimum
2
5.0
1.0
30.0
3
5.0
1.0
30.0
Peak area (mAU) as Y2
Maximum
4
5.0
1.5
35.0
5
5.5
1.0
25.0
6
5.0
1.5
25.0
7
5.0
1.0
30.0
8
4.5
0.5
30.0
9
5.5
1.5
30.0
10
4.5
1.5
30.0
11
5.0
1.0
30.0
12
5.5
0.5
30.0
13
5.0
1.0
30.0
14
5.0
0.5
25.0
15
4.5
1.0
25.0
16
5.0
0.5
35.0
17
4.5
1.0
35.0
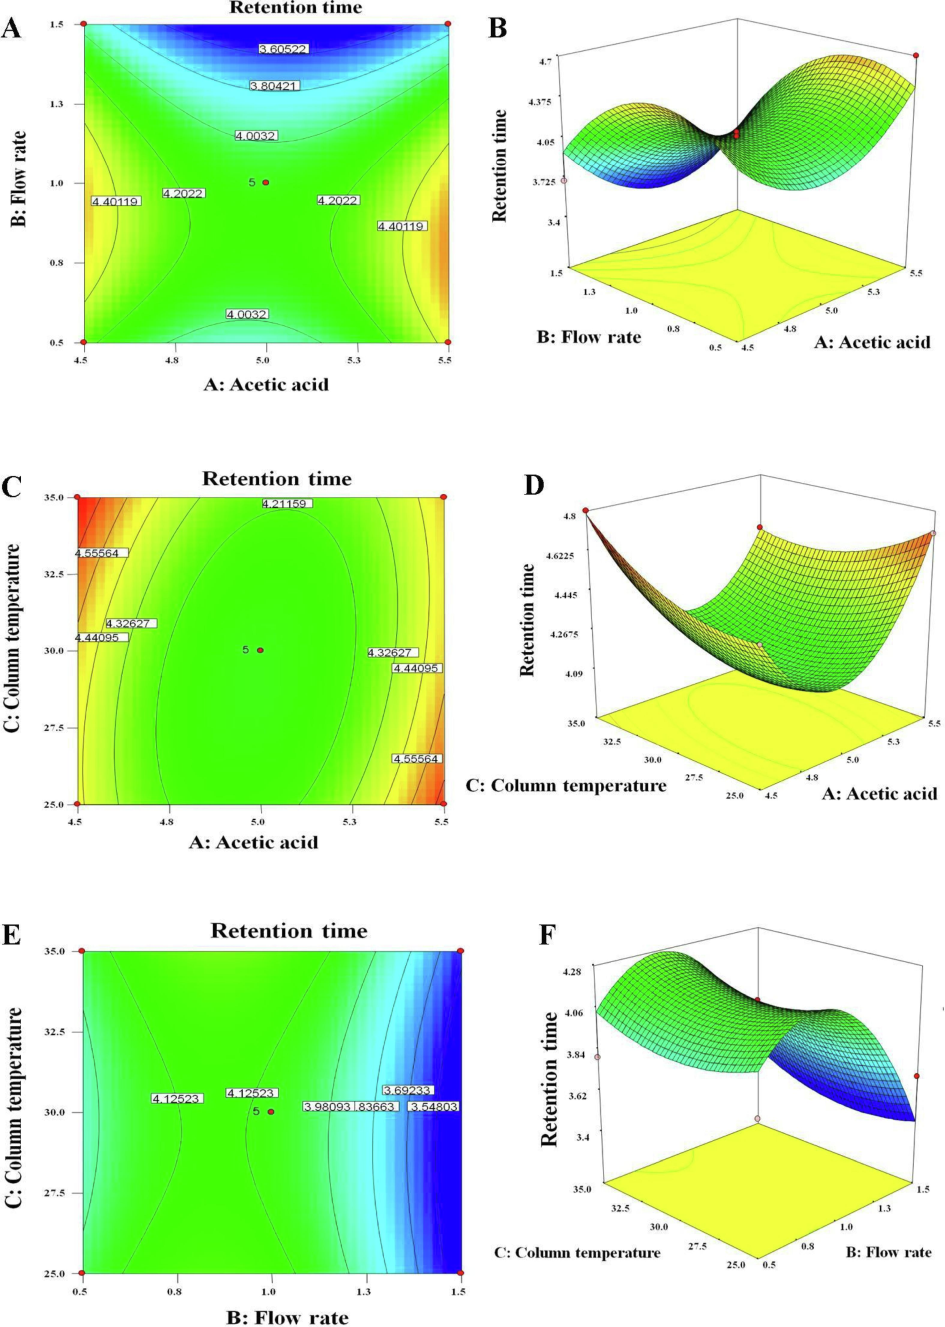
2D and 3D contour and response plots depicting the effect of significant factors on selected responses, respectively. (A and B) 2D and 3D plots exhibiting the impact of A and B on retention time, (C and D) the impact of A and C on retention time, and (E and F) the impact of B and C on retention time.
The impact of A, B, and C was quite different on PA (Fig. 4A-F). The PA was quadratic in relation with pH whereas the flow rate was linearly related to the PA (Fig. 4A-B). Thus, maximum flow rate (1.5 mL/min) and pH 5 can be optimal conditions for maximum PA. The column temperature and pH were quadratic with the PA working in tandem. Therefore, it is better to opt for optimal conditions of both (Fig. 4C-D). The combined impact of the flow rate and the column temperature is illustrated in Fig. 4E-F. The flow rate had a linear impact (directly proportional to PA) whereas the column temperature had a quadratic relationship. Thus, optimized conditions could be decided based on a high flow rate (1.5 mL/min) and medium temperature (30 °C) to get a maximum PA. Finally, a reliable and reproducible analytical method was developed at pH 5.0, 1.0 mL/min, and 30 °C. The design was the best-fit model as evidenced with the low values of p (0.04 and 0.004 for Y1 and Y2, respectively) and high values of F (13.77 and 3.72 for Y1 and Y2, respectively) in the statistical analysis report. Table 3 summarizes the statistical parameters of different variables analysis. The sum of square and mean square values are very close to each other in both responses. The overall desirability value of respective responses was 1.0 suggesting the best fit of the model under set conditions of constraints.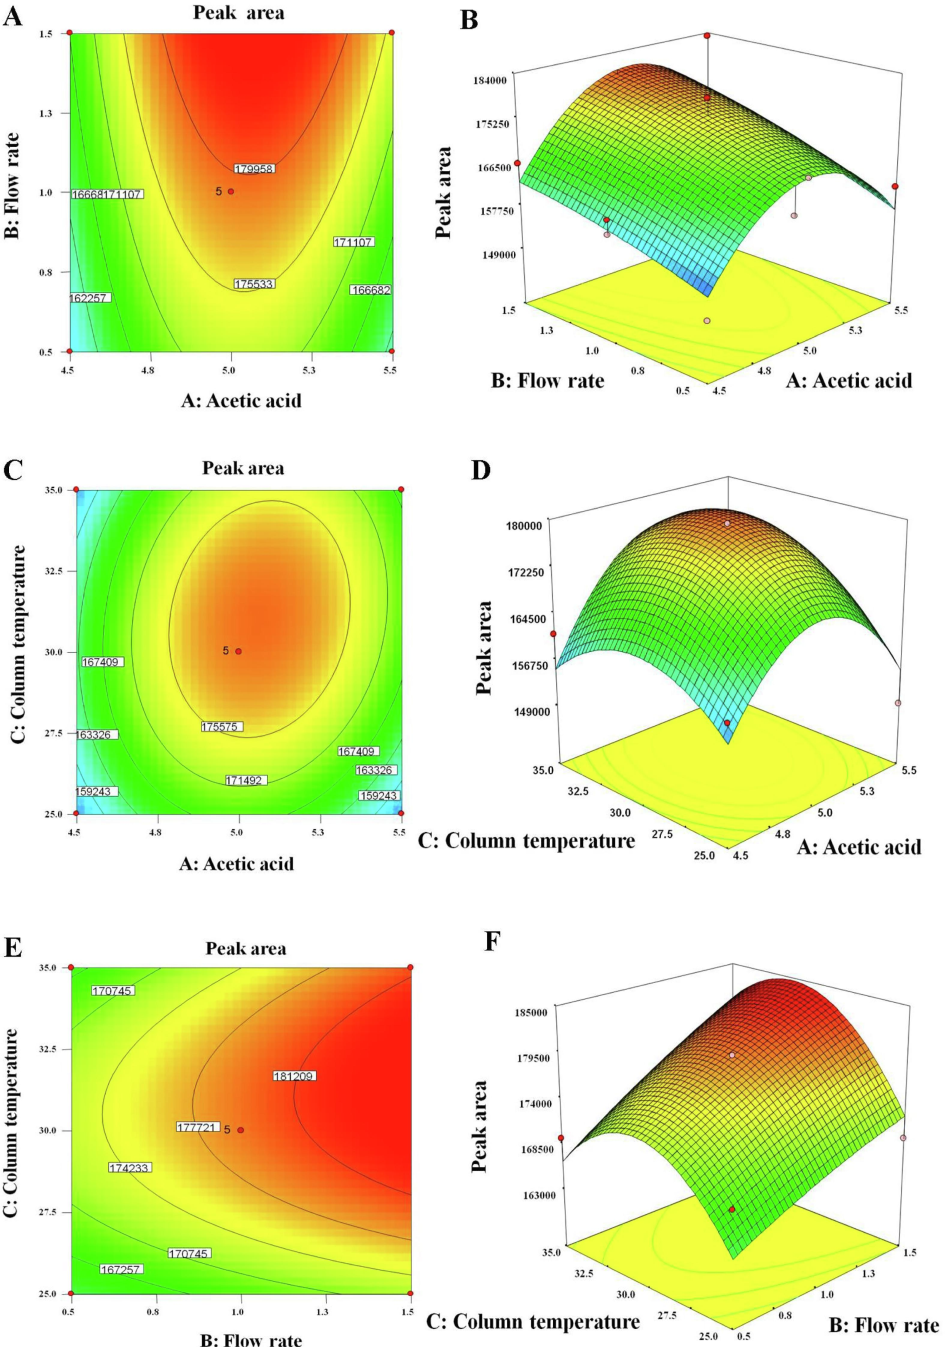
2D and 3D contour and response plots depicting the effect of significant factors on selected responses, respectively. (A and B) 2D and 3D plots exhibiting the impact of A and B on peak area, (C and D) the impact of A and C on peak area, and (E and F) the impact of B and C on peak area in chromatograms.
Square sum
DF
Mean squares
F-values
p-values
Retention time (Y1)
Model
5.15
9
0.6438
13.77
0.0469
Significant
A. AA pH
0.8655
1
0.8655
23.76
0.0671
B-Flow rate
0.54
1
0.54
8.55
0.0222
C-Column temperature
9.800E-003
1
9.800E-003
1.15
0.0075
Peak area (Y2)
Model
1.498E + 009
9
1.664E + 008
3.72
0.0046
Significant
A-AA pH
6.188E + 007
1
6.188E + 007
1.38
0.0281
B-Flow rate
2.503E + 008
1
2.503E + 008
5.59
0.0500
C-Column temperature
6.440E + 007
1
6.440E + 007
1.44
0.0265
6 Bionalytical method validation
6.1 Linearity of the method
The linearity of the method was expressed in the calibration curve (Table 4). Fig. 5A represents a standard calibration curve-based characteristic chromatogram at the low concentration (10 ng/mL). A calibration plot was linear with a high regression coefficient (r2) value (0.999) (Fig. 5B) over the concentration range of 10–1000 ng/mL.
HPLC factors Values
Mobile phase ratios
AA: Acetonitrile: methanol (05:85:10)
AA pH
5.0
Column dimensions
270 × 3.5 mm, 5.0 µm
λmax (nm)
409
Flow-rate (mL/min)
1.0
Injection-volume (µL)
10
Run-time (min)
10.0
Column-temperature (°C)
30
Sampler temperature (°C)
10
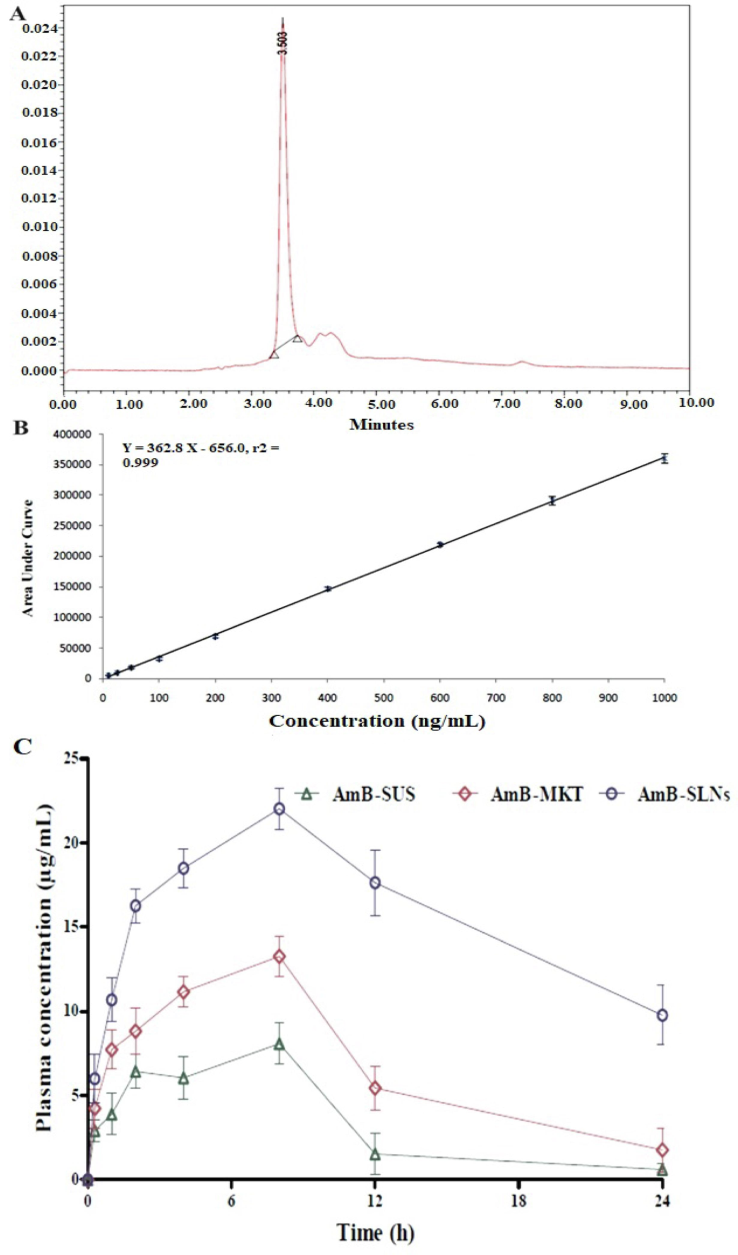
(A) a chromatogram of the blank plasma, (B) a calibration curve of AmB in the rat plasma, and (C) Pharmacokinetic behavior of various AmB formulations in rat plasma of various AmB formulations (AmB-SUS, AmB-MKT, and AmB-SLNs) following intravenous administration (3.2 mg/Kg).
6.2 System suitability
It is a critical aspect to ensure reliability and accuracy of HPLC-based analysis validation. The system functionality was found to be suitable for the determination of AmB under the explored chromatographic conditions. The average PA per injection was determined at each time point and the relative standard deviation (RSD) was ≤ 3.7 % as per US FDA bio-analytical method validation guidelines (US FDA, 2018). The accuracy of the developed analytical procedure should be high and its RSD should be < 5 %.
6.3 Specificity and sensitivity
The validated method was quite specific without interfering with the peak near RT as observed in the chromatogram of AmB (Fig. 5A). The LLOD and LLOQ values for AmB were 1.6 and 50 ng/mL, respectively. The lowest values of “LLOD” and “LLOQ” confirmed the selectivity, sensitivity, simplicity, and reliability of the developed method as an alternative to the conventional mobile phase. The signal did not interfer with the sensitivity of analysis at the explored column temperature and the mobile phase without affecting the acceptable bias range (deviation was deemed acceptable).
6.4 Drug recovery from the plasma samples
Recovery (n = 6) of AmB was found to be 95.8 ± 3.9 %, 98.3 ± 2.2 %, and 98.5 ± 3.0 % for “LQC”, “MQC”, and “HQC” samples, respectively.
7 Estimated inter-day and intra-day “precision” and “accuracy”
The calculated value of intra-day accuracy of AmB was achieved to be in the range of 97.2–98.3 (RSD < 5 %) of the QC samples (Table 5). Similarly, the value of the inter-day accuracy was in the range of 91.1–97.7 % (RSD < 5 %) in the same plasma sample (Table 5).
Spiked concentration (ng/mL)
Intra-day (n = 3)
Mean concentration (ng/mL)
Accuracy (%)
Precision/relative standard deviation (%)
100 (LQC)
98.3 ± 2.5
98.3 ± 1.4
2.5
500 (MQC)
486.2 ± 8.1
97.2 ± 2.1
1.6
1000 (HQC)
981.1 ± 16.7
98.1 ± 1.6
1.7
Inter-day (n = 3)
Mean concentration (ng/mL)
Accuracy (%)
Precision/relative standard deviation (%)
100 (LQC)
91.1 ± 1.9
91.1 ± 0.4
1.9
500 (MQC)
461.2 ± 5.1
92.2 ± 3.2
1.1
1000 (HQC)
971.3 ± 12.7
97.7 ± 2.7
1.3
Pharmacokinetic profiles
Pharmacokinetic parameters
AmB-SUS
AmB-MKT
AmB-SLNs
T1/2(h)
11.01 ± 1.5
16.43 ± 1.6
21.16 ± 1.9
AUC0-∞ (ng.h/mL)
1243.54 ± 33.2
3221.06 ± 91.0
9287.60 ± 87.9
AUMC (ng.h2/mL)
3431.44 ± 156.2
10979.32 ± 332.5
46542.89 ± 1415.7
MRT(h)
9.90 ± 1.3
24.68 ± 3.1
38.18 ± 4.3
Ke (h−1)
0.006 ± 0.002
0.005 ± 0.001
0.01 ± 0.001
7.1 Pharmacokinetic study of AmB formulations in the rat plasma
In vivo measurement of AmB was mandatory to apply the developed HPLC method after parenteral delivery of AmB-SUS, AmB-MKT, and AmB-SLNs. An attempt has been made to monitor AmB in the plasma using the validated method. The data exhibited that in vivo drug release from AmB-SLNs achieved slow and sustained drug delivery which may reduce portal vein access and protein binding. Table 5 and Fig. 5C illustrate several pharmacokinetic parameters and graphical presentation, respectively. Fig. 5C elicited that AmB was slowly released in vivo from SLNs matrix followed by a decline in the plasma. There was no drug solution injected to execute a normal parenteral pattern (lack of absorption phase as an ideal parenteral graph). The concentration time profile of AmB is given in Fig. 5C. The PK parameters such as AUC0-t (7.46-fold) and AUMC0-t (13.56-fold) for AmB-SLNs were substantially (p < 0.05) higher than AmB-SUS. Similarly, AmB-SLNS executed several folds higher T1/2 (1.92-fold), MRT (3.85-fold) and Ke (1.6-fold) values as compared to AmB-SUS.
8 Conclusions
We reported HSPiP and QbD assisted optimized HPLC method development and validation of AmB from the plasma sample with high accuracy, sensitivity, robustness, reproducibility, and simplicity. Major factors were identified and optimized in the analytical method. HSPiP and QbD-oriented methodology resulted in economic method as evidenced by the satisfactory data of performance, economic mobile phase, efficient method, and rapid analysis. The low plasma sample are required for the simplest separation method, and the optimized run time are the uniqueness of the proposed method for rapid, reliable, and regular AmB monitoring in the plasma sample.
Funding
The authors are thankful to the Researchers Supporting Project number (RSPD2024R1005), King Saud University, Riyadh, Saudi Arabia for financial support.
CRediT authorship contribution statement
Mohhammad Ramzan: Writing – review & editing, Validation, Software, Resources, Project administration, Investigation, Data curation, Conceptualization. Tasneem Khan: Writing – review & editing, Writing – original draft, Software. Arusha Ayub: Writing – review & editing, Writing – original draft, Visualization, Conceptualization. Mudassar Shahid: Validation, Funding acquisition, Methodology, Investigation, Data curation.
Acknowledgements
The authors extent their appreciation to the Researchers Supporting Project number (RSPD2024R1005), King Saud University, Riyadh, Saudi Arabia for financial support.
Declaration of competing interest
The authors declare that they have no known competing financial interests or personal relationships that could have appeared to influence the work reported in this paper.
References
- Amphotericin B Pharmacokinetics: Inter-strain Differences in Rats Following Intravenous Administration of the Most Commonly Marketed Formulations of the Drug. Iran J. Pharm. Res.. 2023;22(1)
- [CrossRef] [Google Scholar]
- A Review on Analytical Methods for Quantification of Amphotericin-B in Marketed Dosage Form and Biological Samples. RRJ Pharm Anal.. 2023;12:001.
- [Google Scholar]
- Development and validation of an HPLC method for determination of amphotericin B in plasma and sputum involving solid phase extraction. Chromatographia. 1997;46(11–12):641-646.
- [Google Scholar]
- Setting system suitability criteria for detectability in high-performance liquid chromatography methods using signal-to-noise ratio statistical tolerance intervals. J. Chromatogr. A. 2001;917(1–2):23-27.
- [Google Scholar]
- Thiacarbocyanine as Ligand in Dye-Affinity Chromatography. Biomed. Chromatogr.. 2008;22:402-1288.
- [Google Scholar]
- Lipid systems for the delivery of amphotericin B in antifungal therapy. Pharmaceutics.. 2020;12:1-47.
- [Google Scholar]
- Hansen Solubility Parameters. A User's Handbook (Second Edition). CRC Press; 2007. p. :1-544.
- An environmentally benign approach for rapid analysis of indomethacin using a stability-indicating RP-HPLC method. J. Liquid Chromatogr. Relat. Technol.. 2014;37(6):878-892.
- [Google Scholar]
- Applying green analytical chemistry for rapid analysis of drugs: Adding health to pharmaceutical industry. Arab. J. Chem.. 2017;10:S777-S785.
- [Google Scholar]
- HSPiP and QbD Program-Based Analytical Method Development and Validation to Quantify Ketoconazole in Dermatokinetic Study. AAPS PharmSciTech. 2023;24(8):231.
- [Google Scholar]
- Hansen Solubility Parameters and QbD-Oriented HPLC Method Development and Validation for Dermatokinetic Study of a Miconazole-Loaded Cationic Nanoemulsion in Rat Model. ACS Omega. 2023;8(38):34746-34759.
- [Google Scholar]
- HSPiP, Computational Modeling, and QbD-Assisted Optimized Method Validation of 5-Fluorouracil for Transdermal Products. ACS Omega. 2024;9(1):903-916.
- [Google Scholar]
- ICH, 2005. “Q2 (R1) validation of analytical procedures: Text and methodology. Https://www.Database.Ich.Org/sites/default/files/q2%28r1%29%20guideline.Pdf.” 25/02/2020.
- High-Performance Liquid Chromatographic Analysis of Amphotericin B in Rat Plasma Using Alpha-Naphthol as an Internal Standard. Anal. Chim. Acta. 2009;634:110-114.
- [Google Scholar]
- A Critical Review of Analytical Methods for Quantification of Amphotericin B in Biological Samples and Pharmaceutical Formulations. Crit. Rev. Anal. Chem.. 2022;52(3):555-576.
- [Google Scholar]
- Box–Behnken design-assisted optimization of RP-HPLC method for the estimation of evogliptin tartrate by analytical quality by design. Futur J Pharm Sci.. 2023;9:57.
- [Google Scholar]
- In vitro release, ex vivo penetration, and in vivo dermatokinetics of ketoconazole-loaded solid lipid nanoparticles for topical delivery. Drug Deliv. Transl. Res.. 2022;12(7):1659-1683.
- [Google Scholar]
- Analytical Procedures for PAH and PCB Determination in Water Samples—Error Sources. Crit. Rev. Anal. Chem.. 2006;36(2):63-72.
- [Google Scholar]
- An exploration into the use of Hansen solubility parameters for modelling reversed-phase chromatographic separations. J. Anal. Sci. Technol.. 2022;13:12.
- [Google Scholar]
- Solubility, aggregation and stability of Amphotericin B drug in pure organic solvents: Thermodynamic analysis and solid form characterization. J. Mol. Liq.. 2022;366:120276
- [Google Scholar]
- Bioanalysis of Free and Liposomal Amphotericin B in Rat Plasma Using Solid Phase Extraction and Protein Precipitation Followed by LC-MS/MS. J. Pharm. Biomed. Anal.. 2018;158:288-293.
- [Google Scholar]
- Amphotericin B and its new formulations: pharmacologic characteristics, clinical efficacy, and tolerability. Transpl. Infect. Dis.. 1999;4:273-2831.
- [Google Scholar]
- US FDA 2018. https://www.fda.gov/regulatory-information/search-fda-guidance-documents/bioanalytical-method-validation-guidance-industry. Accessed on 27th May, 2024.
- Waugh, C.D., 2007. Amphotericin B. Pharm: The Comprehensive Pharmacology Reference, 2007, 1–5.
Appendix A
Supplementary data
Supplementary data to this article can be found online at https://doi.org/10.1016/j.jksus.2024.103546.
Appendix A
Supplementary data
The following are the Supplementary data to this article:


