

Genetic and haplotype diversity of redbreast tilapia (Coptodon rendalli) based on cytochrome oxidase subunit I and D-loop
⁎Corresponding author. Mehrnoush.aminisarteshnizi@ul.ac.za (Mehrnoush Aminisarteshnizi)
-
Received: ,
Accepted: ,
This article was originally published by Elsevier and was migrated to Scientific Scholar after the change of Publisher.
Abstract
The genetic diversity in Redbreast tilapia (Coptodon rendalli) is under threat from climate change, human activities, and natural hybridisation, prompting conservation concerns. To investigate the genetic characteristics of C. rendalli, genetic diversity, genetic structure, population differentiation, and historical demography were evaluated using mitochondrial DNA COI (cytochrome oxidase subunit I) and D-loop sequences from various countries. Phylogenetic and genetic diversity analysis based on the mtDNA sequences (COI H = 9, haplogroup = 3, and D-loop H = 5, haplogroup = 3) showed private haplotypes in some of the populations. The results showed significant differences in genetic diversity among the analysed populations (P < 0.001). Molecular variance analysis showed low variation levels among populations (COIFST = 0.02176, D-loopFST = 0.52), which was significant only for D-loop. The neutrality tests and mismatch distribution based on the mtDNA supported the hypothesis of under-purifying selection of C. rendalli. The results indicated that the population did not undergo expansion. The findings of this study revealed molecular divergence among the C. rendalli populations and may serve as pivot information for the genetic improvement of this species. In conclusion, this study has elucidated the utility of two reliable and cost-effective molecular markers for analysing genetic diversity. Notably, the mitochondrial D-loop region’s sensitivity to reflecting genetic diversity in C. rendalli surpasses that of the COI gene.
Keywords
Tilapia fish
Coptodon rendalli
Genetic diversity
mitochondrial DNA
AMOVA

1 Introduction
Coptodon rendalli is a native and important tilapia species used in aquaculture in the southern half of Africa. Total aquaculture production worldwide for C. rendalli was 22000 tons in 2022 (FAO, 2023). Redbreast tilapia has a wide and varied diet, from plankton for juveniles to leaves and stems of aquatic plants, as well as algae, vegetative detritus, insects, and crustaceans for adults (Lamboj, 2004). This fish is very adaptable to different conditions, temperatures (11-37℃), and salinities (Skelton, 2012). For aquaculture and weed control, this fish was introduced from Africa to Asia (1955 and 1981) and to America in 1957 (Devick, 1991). Redbreast tilapia in 1955 was introduced from Belgium to Thailand and Brazil (Lazzaro, 1991). This fish was introduced from D.R. Congo to Mauritania and Madagascar (Konings et al., 2019). Nevertheless, C. rendalli is classified on the IUCN Red List as vulnerable (Konings et al., 2019). Thus, it is essential to assess the genetic integrity of C. rendalli globally. Historical gene flow patterns significantly affect the genetic structure of C. rendalli populations (Tibihika et al., 2020). The diversification, adaptation, and speciation of species are largely influenced by external and internal factors, which play a crucial role in structuring genetic variation (Schluter, 2000).
COI gene is a small, highly conserved, heme-containing bifunctional protein widely utilised in species identification and biodiversity research (Arai et al., 2023). On the other hand, the mitochondrial control region (CR) is the longest noncoding region in animal mitochondrial DNA (mtDNA) (Stoneking et al., 1991). The CR is advantageous for phylogenetic studies and genetic diversity due to its maternal inheritance, lack of recombination, exceptionally fast evolutionary rate (Meyer 1993), polymorphic nature (Ghatak et al., 2014) and presumed selective neutrality as a noncoding region (Rech et al., 2014). COI and D-loop gene is used as a genetic marker for phylogenetic analysis and genetic diversity of various animals, including fish species (Jamandre et al., 2014), such as Coptodon zillii (Soliman et al., 2017), wild Tilapia species in Japan (Fatsi et al., 2020).
This study aimed to determine the genetic diversity of C. rendalli globally. Moreover, the study examined phylogenetic relationships among different countries’ populations. This was done by analysing and utilising two mtDNA markers (COI and D-loop). This study investigates the genetic diversity of C. rendalli worldwide and analyses the genetic variation and differentiation among its populations utilising mitochondrial DNA (mtDNA). A universal study of the genetic diversity, haplotype diversity, and population differentiation of C. rendalli could lead to guidance for effectively managing this fish in aquaculture and inform conservation strategies.
2 Material and methods
2.1 Study area, DNA extraction, amplification, and sequencing
This study focused on the global perspective of C. rendalli. To determine the genetic structure of C. rendalli worldwide, all available COI and D-loop sequences from various countries were collected from GenBank (Table S1 and S2). To supplement the dataset, 20 specimens of C. rendalli were collected randomly in Doorndraai Dam (24°16′51.0 “S 28°46’38.0” E) Limpopo Province, South Africa.
Genomic DNA was extracted from fin clips using the NucleoSpin® Tissue kit (Macherey–Nagel, Düren, Germany). The DNA quality and quantity were assessed with a NanoDrop spectrophotometer (Thermo Fisher Scientific Inc., USA). PCR was performed on two regions of mitochondrial DNA: COI applying universal primers FishF1, 5′-TCAACCAACCACAAAGACATTGGCAC-3′ and FishR1, 5′-TAGACTTCTGGGTGGCCAAAGAATCA-3′ (target sequence length 655 bp) (Ward et al., 2005) and the D-loop (noncoding) control region using universal primers CR-A, 5′-TTCCACCTCTAACTCCCAAAGCTAG-3′and CR-E, 5′-CCTGAAGTAGGAACCAGATG-3′ (target sequence length 405 bp) (Lee et al., 1995). The PCR reaction comprised 30 µl total volume with eight ng/μl of genomic DNA, one μl each of forward and reverse primers, 12 μl of Taq Master Mix, and eight μl of nuclease-free water. Cycling conditions included an initial denaturation at 95 °C for 15 min, followed by 35 cycles of denaturation at 94 °C for 45 s, annealing (55 °C for D-loop, 50 °C for COI) for 45 s, and extension at 72 °C for 1 min, with a final extension at 72 °C for 10 min. After electrophoresis on a 1.5 % agarose gel in 1 × TAE buffer for 30 min at 120 V, the products were visualised under UV light. The PCR products were purified and sequenced successfully at Inqaba Biotec (Pretoria, South Africa).
2.2 Genetic diversity and structure
The quality of all sequences generated from the current study (Accession no COI. PP352615- PP352627; Accession no D-loop. PP350705- PP350724) was checked in BioEdit (Hall, 1999). Sequence alignment was conducted by MEGA X (Kumar et al., 2018), and all COI and D-loop gene sequences were standardised to 581 bp and 390 bp, respectively, to terminate missing data by FaBox online toolbox (Villesen, 2007).
Genetic variation was assessed using parameters such as haplotype diversity (h), haplotype number (H), segregating sites (S), and nucleotide diversity (π) across populations and regions, utilising DnaSP version 6 (Rozas et al., 2017). Sequence data was exported for the TCS haplotype network (Clement et al., 2002) from DnaSP v6.12.03 to analyse haplotypes in the D-loop and COI loci of the C. rendalli population with the PopART program (Leigh and Bryant, 2015). Genetic diversity within and among populations was evaluated through analysis of molecular variance (AMOVA), and F-statistics (FST) were calculated with 10,000 permutations in Arlequin version 3.5 (Excoffier and Lischer, 2010), quantifying population differentiation through pairwise FST values (P < 0.05).
2.3 Phylogenetic analysis
Phylogenetic trees were constructed employing Bayesian inference in Mr. Bayes 3.1.2 (Ronquist and Huelsenbeck, 2003). The GTR + I + G model was chosen with jModeltest 2.1.10 (Guindon and Gascuel, 2003) and executed for 1,000,000 generations. Chetia flaviventris (accession number COI: OL306332, D-loop: AY913914) served as the outgroup. Phylogenetic trees were visualised utilising FigTree v1.4.4 (Rambaut, 2018).
2.4 Neutrality test
Tajima (1989) and Fu’s Fs (1997) assess the neutrality of mutations. Analyses were conducted utilising Arlequin v3.5 (Excoffier and Lischer, 2010) with 1000 simulations under a neutrality model. Population size changes were analysed using DnaSP v6.12.03.
3 Results
3.1 Genetic diversity
Sequence fragment lengths in C. rendalli were 581 bp of COI, and 390 bp of D-loop. TCS haplotype network spanned 9 and 5 haplotypes, obtained from genes COI and D-loop, respectively, representing the dispensation pattern of haplotypes from C. rendalli populations per country (Fig. 1). The most widespread haplotype was haplotype 1 in the COI marker (8 populations). Haplotype 1 was the same among South Africa, Namibia, Congo, Mauritania, Colombia, Madagascar, Mozambique, and Panama populations. Haplotype 4 was a shared haplotype between the Tanzania and Zimbabwe populations for the D-loop marker.
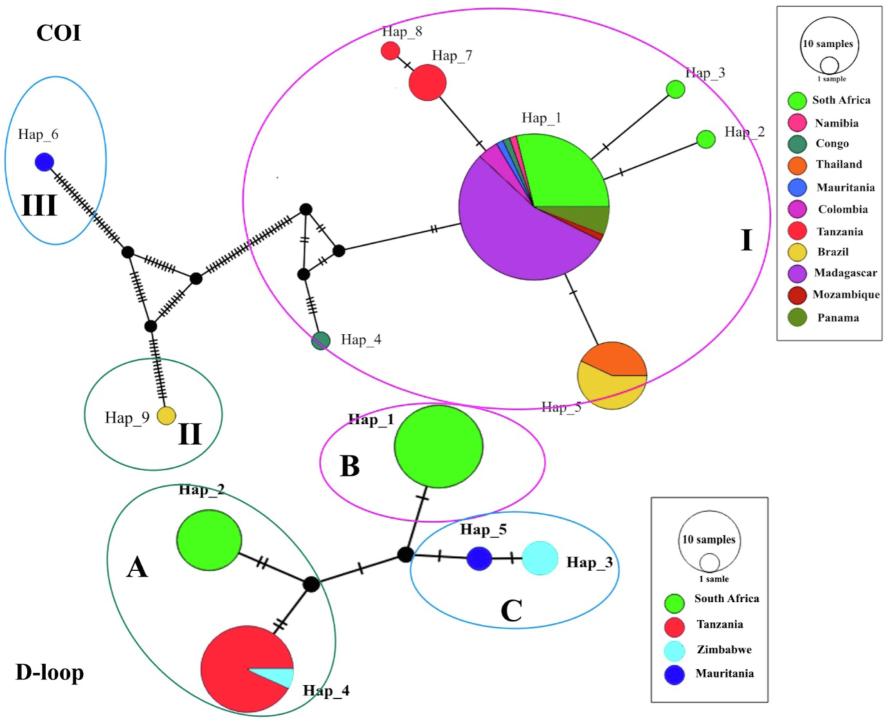
- TCS haplotype network inferred from mtDNA cytochrome oxidase subunit I (COI), and D-loop region. The size of the circle indicates the relative frequency of the corresponding haplotype, and the colors represent the corresponding population. The branches’ black lines point to the mutational changes between two haplotypes.
South African and Tanzania populations from gene COI and South African and Zimbabwe populations from gene D-loop have the highest number of haplotypes. The shared haplotypes represented 22.22 % and 20 % (COI and D-loop) of the entire data set, while private or singleton haplotypes represented 77.77 % and 80 % (COI and D-loop) (Fig. 2), which indicated the different levels of genetic diversity in all populations.
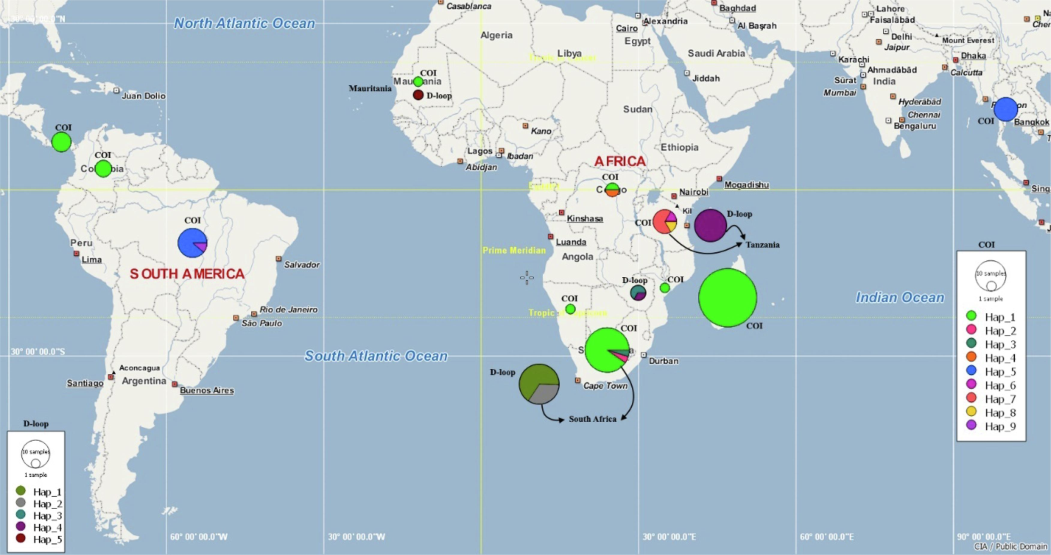
- Frequency of haplotypes in different countries. Colors show various haplotypes of COI and D-loop in the Coptodon rendalli population. The size of the circle is proportional to the number of specimens in different geographic regions.
The average haplotype diversity (Hd) value for COI was 0.45, and for D-loop was 0.70. The average nucleotide diversity (π) for COI was 0.0083, and for D-loop was 0.0090 (Table 1). Haplotype diversities among all genetic markers ranged from 0.00 to 0.66. The COI indicated lower haplotype diversity (0.00–0.60) than D-loop (0.00–0.66) among all populations.
| Countries | Genetic diversity | Neutrality test | |||||
|---|---|---|---|---|---|---|---|
| N | h | Hd | π | S | Tajima (D) | Fu's Fs | |
| COI | |||||||
| Madagascar | 36 | 1 | 0.00 | 0.00 | 0 | NA | NA |
| South Africa | 21 | 3 | 0.18 | 0.00046 | 2 | −1.51 | −1.92 |
| Brazil | 9 | 2 | 0.22 | 0.031 | 58 | −2.03** | 10.00** |
| Thailand | 6 | 1 | 0.00 | 0.00 | 0 | NA | NA |
| Tanzania | 6 | 3 | 0.60 | 0.052 | 65 | −1.54** | 5.27** |
| Panama | 4 | 1 | 0.00 | 0.00 | 0 | NA | NA |
| Colombia | 3 | 1 | 0.00 | 0.00 | 0 | NA | NA |
| D.R. Congo | 2 | 2 | 1 | 0.022 | 9 | NA | NA |
| D-loop | |||||||
| South Africa | 20 | 2 | 0.47 | 0.006 | 4 | 2.02 | 5.15 |
| Tanzania | 6 | 1 | 0.00 | 0.00 | 0 | NA | NA |
| Zimbabwe | 3 | 2 | 0.66 | 0.010 | 5 | NA | NA |
NA = not applicable;
3.2 Genetic structure and population differentiation
Analysis of Molecular Variance (AMOVA) was applied to distinguish the genetic structure of populations in different countries, as shown in Table 2. The AMOVA grouped all localities as one population, indicating that the percentage of variation among populations is lower for COI (2.18 %) and slightly higher for the D-loop (51.86 %) marker than within populations (COI:97.82 %; D-loop: 48.14 %), with a significant structure for D-loop marker (COI: Fst = 0.02176, P = 0.262; D-loop: Fst = 0.5186, P < 0.001) (Table 2).
| Source of variance | df | Sum of squares | Variance component | % Total of variance | Significance |
|---|---|---|---|---|---|
| COI | |||||
| Among populations | 10 | 982.64 | 1.821 | 2.18 | P = 0.262 |
| Within populations | 79 | 6468.22 | 81.87 | 97.82 | P = 0.262 |
| Total | 89 | 7450.86 | 83.69 | 100 | P = 0.262 |
| D-loop | |||||
| Among populations | 3 | 116.209 | 2.912 | 51.86 | P < 0.001 |
| Within populations | 33 | 89.467 | 2.711 | 48.14 | P < 0.001 |
| Total | 36 | 205.676 | 5.632 | 100 | P < 0.001 |
The FST values were utilised to determine differentiation in all populations, whether due to drift, inbreeding, or adaptive population structures. The results for COI marker showed a low and insignificant FST value (Fst = 0.02176, P = 0.262), indicating that advantageous alleles were not spread throughout the population, and the populations were more isolated (Table S3). On the other hand, the D-loop marker had a high and significant FST value (FST = 0.52; P < 0.001), indicating adaptive connectivity, where advantageous alleles spread throughout the population (Table S4).
3.3 Phylogenetic analysis
The phylogenetic analysis of COI revealed three major clades, including Clade I, which comprised haplotypes from South Africa, Namibia, D.R. Congo, Thailand, Mauritania, Colombia, Tanzania, Brazil, Madagascar, Mozambique, and Panama; Clade II, which represented haplotypes from Brazil. Clade III represented haplotypes from Tanzania. The phylogenetic tree showed a high posterior probability value (Fig. 3).
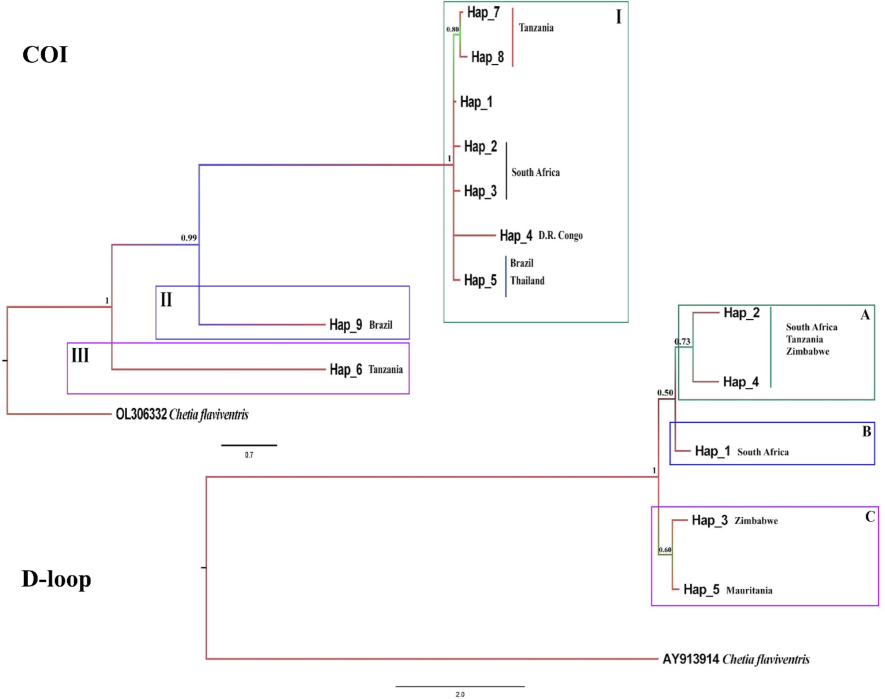
- The Bayesian tree inferred for Coptodon rendalli using haplotypes. Chetia flaviventris (COI: OL306332; D-loop: AY913914) was used as out-group.
The result of phylogenetic analysis for the D-loop indicated three clades, including Clade A, which represented haplotypes belonging to South Africa, Tanzania, and Zimbabwe. Clade B represented haplotypes belonging to South Africa. Clade C represented haplotypes belonging to Zimbabwe and Mauritania (Fig. 3).
3.4 Neutrality and population size change test
The results of the neutrality tests (Table 1) and the mismatch distribution (Fig. 4, Fig. S1) based on the COI gene provide support for the hypothesis of population expansion or under-purifying selection of C. rendalli. Tajima’s D-test of the COI gene showed a negative value (−2.76), and Fu’s FS-test reveald a positive value (1.88) with a significant level (total: P < 0.001). The mismatch distribution analysis, which was based on the COI gene, observed an unimodal pattern in all populations (raggedness index 0.13; P > 0.05) and per location (Figure S1). An unimodal mismatch distribution graph for COI showed the pairwise distribution for entire sequences, indicating a recent population expansion, which was not significant. However, Tajima’s D (1.38) and Fu’s FS (3.0) of the D-loop region were positive while not reaching a significant level (P > 0.05). The D-loop region revealed a bimodal distribution in all populations and per location (Figure S1) during mismatch analyses (raggedness index 0.66; P > 0.05). The bimodal mismatch distribution graph implies an equilibrium in population structure. In addition, the result for the D-loop marker showed the population had no expansion (Fig. 4).
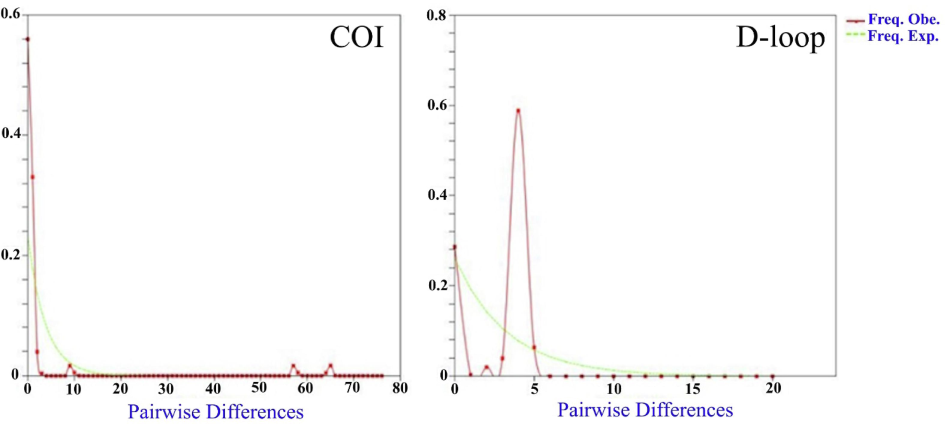
- Mismatch distributions from COI and D-loop sequences of all Coptodon rendalli populations. The pairwise distribution is shown in a Uni-modal mismatch distribution graph for COI and a multimodal mismatch distribution graph for D-loop, implying the equilibrium in population structure, regardless of location. X-axis (x): number of pairwise differences; Y-axis (y): frequency of mismatches; Freq. Exp.: frequency expected (green dashed line) and Freq. Obs: frequency observed (red solid line).
4 Discussion
We analysed mtDNA markers to investigate the genetic diversity among global populations of C. rendalli. The analysis revealed a distinct genetic population structure globally in Redbreast tilapia, as determined by mtDNA markers. The mitochondrial genes of C. rendalli exhibited high genetic diversity for both markers in all the countries, which suggests that the current genetic structure arises from populations being geographically isolated. The results also showed that this fish has high genetic diversity due to its biological fertility and ecological adaptability in different countries (e.g. Tanzania and Zimbabwe). The wide geographical distribution of haplotype 1 indicates a shared haplotype (Leigh et al., 2019). The existence of common haplotypes in different countries indicates a common ancestral lineage. This finding demonstrates that a shared origin is linked to the introduction of fish for aquaculture. As a result, C. rendalli was cultured and widely introduced for mosquito control from Africa to Asia and America (Devick, 1991). Therefore, all countries to which this fish was introduced have a shared haplotype (Hap_1). Shared haplotype, seen as an ancestral lineage, expanded to other regions through mutation and recombination over time, resulting in the emergence of other haplotypes. However, it may take at least 60 years for exotic populations to develop genetic differences (Zidana et al. 2009), which could explain why some populations have only one haplotype (e.g., in Asia and America). Although the D-Loop’s haplotype network revealed only one shared haplotype among two populations, this may be due to DNA super-diversity (Robalo et al., 2020). This result may be clarified by combining small sample sizes and high mutation rates in D-loop sequences (Fourdrilis et al., 2019). Consequently, COI results might offer more reliable insights into spatial distribution and connectivity. Similar patterns of genetic differentiation have been detected in C. zillii in Egypt, as reported in a previous study by Soliman et al. (2017). The presence of C. zillii and hybridisation with C. rendalli (Mwanja, 2000) is the possible reason for the high genetic diversity in C. rendalli (D.R. Congo and Tanzania). On the other hand, the results indicated that genetic diversity was low in the introduced population (Thailand, Panama, and Colombia).
The study’s results revealed that the total genetic diversity in the COI marker was lower than that of the D-loop despite the total number of COI sequences being higher than those of the D-loop. This discrepancy may be due to the varying evolutionary rates of the dissimilar molecular markers (Yan et al., 2009; Fang et al., 2022). There is no selection pressure for coding, resulting in a higher mutation and evolution rate in the D-loop region compared to the COI gene (Antoniou and Magoulas, 2014). The findings clearly indicate that both COI and D-loop markers are valuable for analysing the genetic variation of C. rendalli. Moreover, the nucleotide diversity (π) value of mitochondrial DNA is crucial for measuring the population’s genetic diversity. A higher nucleotide diversity (π) value indicates greater polymorphism within the population. The results suggested that nucleotide diversity (π) of C. rendalli for the COI gene was lower than D-loop. These results indicate that the D-loop is more sensitive in reflecting the genetic diversity of C. rendalli than the COI gene. This also confirms that the evolution rate of the D-loop is higher than the COI gene. Several studies indicated that the D-loop marker can detect genetic differentiation better than the COI marker (Soliman et al., 2017; Fang et al., 2022; Zhao et al., 2023). Thus, the D-loop region is more effective in detecting genetic variability within species and may help explain the discrepancies in genetic variability data obtained using different mtDNA markers (Butkauskas et al., 2023).
Haplotype network analysis revealed a complex pattern. Some haplotypes were separated by a several number of mutations. In contrast, others are separated by only a few, which is represented on the phylogenetic tree. The result of phylogenetic analysis for COI revealed the clades I, II, and III were also inferred in the TCS Network for haplotype analysis (Fig. 1), supporting the topology of the phylogenetic tree (Fig. 3). Tanzania and D.R. Congo had a high value of haplotype diversity, and these populations in the phylogenetic tree were divided into two clades that confirmed the results of haplotype diversity. The phylogenetic analysis of the D-loop inferred clades A, B, and C. The TCS Network haplotypes (Fig. 1), support the topology of the phylogenetic tree (Fig. 3). Zimbabwe and South Africa had high values for haplotype diversity (0.66 and 0.47), and these populations in the phylogenetic tree were divided into two clades that confirmed the results of haplotype diversity. Our research revealed that the C. rendalli located in Tanzania and D.R. Congo may have a higher polymorphism.
Population genetic structure undergoes dynamic modifications due to historical and ongoing evolutionary processes (Wereszczuk et al., 2017). Identifying the population structure is crucial because it helps to understand the genetic processes between past and present species, which have shaped the natural selection of current species (Fatsi et al., 2020). Another significant discovery about the genetic structure of C. rendalli mainly happened within the population (Fst COI = 0.02176; P > 0.005), as indicated by the COI marker. Due to all sequences being from different countries with different ecological situations, we expected a significant genetic structure and differentiated genetic clusters in all populations (Table S3). The results showed that the COI marker could not show differentiated genetics in the C. rendalli populations. The results for the COI marker were also in compliance with the findings of Collichthys lucidus (Song et al., 2014), Larimichthys crocea (Han et al., 2015), Gymnocypris przewalskii (Fang et al., 2022), and Ocypode ceratophthalmus (Zhao et al., 2023). In contrast, AMOVA based on the D-loop marker was conducted in all populations, and the percentage of variation observed among populations was the highest, with significant differences (Fst D-loop = 0.5186, P < 0.005). This result indicates that C. rendalli has a different pattern in all populations (Table S4). The result of the analysis of the haplotype network was consistent with the AMOVA, and showed that there was a 51.86 % genetic structure among populations. D-loop marker clearly illustrates the genetic ancestry of all the populations (Fatsi et al., 2020). Likewise, D-loop marker results were in agreement with several studies (Barasa et al., 2016; Jiang et al., 2019; Fatsi et al., 2020). Fang et al. (2022) indicated that different molecular marker methods can show different genetic structures.
Tajima (D) and Fu’s Fs results were obtained for only a single population (South Africa) in D-loop region. However, due to the slightly faster evolutionary rate in this region, it is not suitable for accurately analysing the population dynamics of C. rendalli. Therefore, we used the findings from the COI gene analysis only. Fu (1997) suggested that demographic expansion indices (Fu’s Fs and Tajima’s D) can identify populations that have recently expanded or are under purifying selection. The negative Tajima’s D values and positive Fu’s Fs values suggest that the actual polymorphism frequency is lower than expected (Zhang et al., 2021). These results indicate that C. rendalli populations have been notably affected by purifying or population expansion (Fatsi et al., 2020) as the number of polymorphic sites exceeds the average heterozygosity. In this study, we detected significant values of Tajima’s D and Fu’s Fs for COI. Additionally, C. rendalli can hybridise with C. zillii (Tanzania population). Therefore, purifying selection is likely a more influential force in shaping C. rendalli population demographics than a demographic expansion.
Based on mismatch analysis, the population of C. rendalli showed an unimodal pattern for all populations based on the COI gene. An unimodal mismatch distribution graph for COI showed the pairwise distribution for entire sequences, indicating a recent population expansion, which was not significant (Figure S1). However, all populations showed a bimodal distribution based on the D-loop (Figure S1). A bimodal mismatch distribution graph for the D-loop showed the pairwise distribution for entire sequences, implying an equilibrium in population structure. Bimodal distribution, which implies a stable population (Barasa et al., 2016). The nonsignificant raggedness index showed a stable population size of C. rendalli. Several studies reported unimodal (COI marker) and bimodal (D-loop marker) distribution in fish taxa, including G. przewalskii (Fang et al., 2022), Clarias gariepinus (Barasa et al., 2016), Schilbe intermedius (Nneji et al., 2020), and Labeo rohita (Modeel et al., 2023). The analysis of the historical evolution of the C. rendalli population suggests that it has not experienced significant population expansion in recent times and has remained relatively stable. This stability is likely due to changes in environmental conditions not having a substantial impact on the population. However, further investigation is needed to confirm this finding.
Understanding genetic diversity is crucial for developing effective conservation and management plans for C. rendalli populations. This knowledge also guides the selection of fish species and their long-term genetic progress. We found the haplotype diversity of C. rendalli populations from Zimbabwe, Tanzania, and the Democratic Republic of Congo (D.R. Congo) was the highest, indicating that these populations are genetically diverse. This finding highlights spatially explicit management strategies. Such strategies should include reducing pollution, minimising habitat degradation and fragmentation, and decreasing fishing pressure to ensure the sustainable use of fish stocks.
5 Conclusion
The current study provides information on the global haplotype diversity of C. rendalli for the first time. It has also elucidated the utility of two reliable and cost-effective molecular markers for analysing genetic diversity. Notably, the mitochondrial D-loop region’s sensitivity to reflecting genetic diversity in C. rendalli surpasses that of the COI gene, but COI results might offer more reliable insights into spatial distribution and connectivity. Considering the number of existing sequences in databases, studies about this fish are limited. Therefore, a study on mitochondrial sequences in different countries would be recommended. Further research is required, utilising additional molecular markers and samples to expand current knowledge.
CRediT authorship contribution statement
Mehrnoush Aminisarteshnizi: Writing – review & editing, Writing – original draft, Software, Data curation, Conceptualization. Ngonidzashe A.G. Moyo: Supervision. Mokgadi E. Raphalo: Writing – review & editing.
Acknowledgments
This project was supported by the University of Limpopo, which the authors appreciate.
Declaration of competing interest
The authors declare that they have no known competing financial interests or personal relationships that could have appeared to influence the work reported in this paper.
References
- Application of mitochondrial DNA in stock identification. In: Stock Identification Methods (2nd ed.). Cambridge: Academic Press; 2014. p. :257-295.
- [CrossRef] [Google Scholar]
- A mitochondrial cytochrome c oxidase subunit i gene analysis of the yellowfin snapper, lutjanus xanthopinnis in the indo-pacific region and a note on lutjanus lutjanus population structure. Heliyon.. 2023;9(9):e19348
- [CrossRef] [Google Scholar]
- High genetic diversity and population differentiation in Clarias gariepinus of Yala Swamp: evidence from mitochondrial DNA sequences. J. Fish. Biol.. 2016;89(6):2557-2570.
- [CrossRef] [Google Scholar]
- Temporal variation of genetic diversity in rutilus rutilus populations from lithuania using mtDNA markers in the context of anthropogenic activities. Diversity.. 2023;15:1113.
- [CrossRef] [Google Scholar]
- Clement, M., Snell, Q., Walke, P., Posada, D., Crandall, K., 2002. TCS Networks: estimating gene genealogies. Proc 16th Int Parallel Distrib Process Symp. 2,184.
- Devick, W.S., 1991. Patterns of introductions of aquatic organisms to Hawaiian freshwater habitats. Pages 189-213 in New directions in research, management and conservation of Hawaiian freshwater stream ecosystems. Proceedings of the 1990 symposium on freshwater stream biology and fisheries management, Division of Aquatic Resources, Hawaii Department of Land and Natural Resources.
- Arlequin suite ver 3.5: A new series of programs to perform population genetics analyses under Linux and Windows. Mol. Ecol. Resour.. 2010;10:564-567.
- [Google Scholar]
- Genetic diversity and population differentiation of naked carp (gymnocypris przewalskii) revealed by cytochrome oxidase subunit I and D-loop. Front. Ecol. Evol.. 2022;10:827654
- [CrossRef] [Google Scholar]
- FAO., 2023. Fishery and Aquaculture Statistics. Global aquaculture production 1950-2021 (FishStatJ). In: FAO Fisheries and Aquaculture Division [online]. Rome.
- Population genetics and taxonomic signatures of wild Tilapia in Japan based on mitochondrial DNA control region analysis. Hydrobiol.. 2020;847:1491-1504.
- [CrossRef] [Google Scholar]
- Highly polymorphic mitochondrial DNA and deceiving haplotypic differentiation: Implications for assessing population genetic differentiation and connectivity. BMC Evol. Biol.. 2019;19:92.
- [Google Scholar]
- Statistical tests of neutrality of mutations against population growth, hitchhiking and background selection. Genetics.. 1997;147(2):915-925.
- [CrossRef] [Google Scholar]
- Polymorphism in mtDNA control region of Mizo-Mongloid breast Cancer samples as revealed by PCR-RFLP analysis. Mitochondrial DNA Part a.. 2014;27(3):2205-2208.
- [Google Scholar]
- A simple, fast and accurate method to estimate large phylogenies by maximum-likelihood. Syst Biol.. 2003;52:696-704.
- [CrossRef] [Google Scholar]
- BioEdit: a user-friendly biological sequence alignment editor and analysis program for Windows 95/98/NT. In: InNucleic Acids Symposium Series. Information Retrieval Ltd London; 1999. p. :95-98.
- [Google Scholar]
- Lack of genetic structure in endangered large yellow croaker Larimichthys crocea from China inferred from mitochondrial control region sequence data. Biochem. Syst. Ecol.. 2015;61:1-7.
- [Google Scholar]
- High sequence variations in mitochondrial DNA control region among worldwide populations of flathead mullet Mugil cephalus. Int J Zool.. 2014;2014:9.
- [Google Scholar]
- Maternal ancestry analyses of red tilapia strains based on D-loop sequences of seven tilapia populations. PeerJ. 2019;7:e7007.
- [Google Scholar]
- Konings, A., Awaïss, A., Azeroual, A., Getahun, A., Hanssens, M., Lalèyè, P., Marshall, B., Moelants, T., Natakimazi, G., Tweddle, D., 2019. Coptodon rendalli (amended version of 2018 assessment). The IUCN Red List of Threatened Species 2019: e.T60690A155041001. https://dx.doi.org/10.2305/IUCN.UK.2019-3.RLTS.T60690A155041001.en.
- MEGA X: molecular evolutionary genetics analysis across computing platforms. Mol. Biol. Evol.. 2018;35(6):1547.
- [CrossRef] [Google Scholar]
- The Cichlid Fishes of Western Africa. Bornheim, Germany: Birgit Schmettkamp Verlag; 2004. p. :255.
- Feeding convergence in South American and African zooplanktivorous cichlids Geophagus brasiliensis and Tilapia rendalli. Environ. Biol. Fishes.. 1991;31:283-293.
- [Google Scholar]
- Structure and evolution of teleost mitochondrial control regions. J. Mol. Evol.. 1995;41:54-66.
- [Google Scholar]
- PopART: Full-feature software for haplotype network construction. Methods. Ecol. Evol.. 2015;6(9):1110-1116.
- [Google Scholar]
- Estimated six per cent loss of genetic variation in wild populations since the industrial revolution. Evol. Appl.. 2019;12(8):1505-1512.
- [CrossRef] [Google Scholar]
- Evolution of mitochondrial DNA in fishes. In: Hochachka P.W., Mommsen T.P., eds. Biochemistry and Molecular Biology of Fishes. Vol vol. 2. Amsterdam: Elsevier Science; 1993. p. :1-38.
- [Google Scholar]
- Genetic biodiversity and evolution of two principal fisheries species groups, the Labeine and Tilapiine, of Lake Victoria region. East Africa: The Ohio State University; 2000.
- DNA barcoding silver butter catfish (schilbe intermedius) reveals patterns of mitochondrial genetic diversity across african river systems. Scientific. Rep.. 2020;10:7097.
- [CrossRef] [Google Scholar]
- Rambaut, A., 2018. Figtree, a graphical viewer of phylogenetic trees, version 1.4.4. Institute of Evolutionary Biology, University of Edin-burgh. https://github.com/rambaut/figtree/releases/tag/v1.4.4.
- Natural selection on coding and noncoding DNA sequences is associated with virulence genes in a plant pathogenic fungus. Genome. Biol. Evol.. 2014;6(9):2368-7916.
- [Google Scholar]
- Against all odds: A tale of marine range expansion with maintenance of extremely high genetic diversity. Sci. Rep.. 2020;10:12707.
- [Google Scholar]
- MrBayes 3: bayesian phylogenetic inference under mixed models. Bioinformatics.. 2003;19:1572-1574.
- [CrossRef] [Google Scholar]
- DnaSP v6: DNA sequence polymorphism analysis of large datasets. Mol. Biolevolu.. 2017;34:3299-3302.
- [Google Scholar]
- The Ecology of Adaptive Radiation. New York: Oxford University Press; 2000.
- A complete guide to the freshwater fishes of Southern Africa. Halfway House, Harare: Southern Book Publishers; 2012.
- Comparative population genetic structure of redbelly tilapia (Coptodon zillii (Gervais, 1848)) from three different aquatic habitats in Egypt. Ecol. Evol.. 2017;15(24):11092-11099.
- [CrossRef] [Google Scholar]
- Genetic structure and historical demography of Collichthys lucidus inferred from mtDNA sequence analysis. Environ. Biol. Fishes.. 2014;97:69-77.
- [Google Scholar]
- Population variation of human mtDNA control region sequences detected by enzymatic amplification and sequence-specific oligonucleotide probes. Am. J. Hum. Genet.. 1991;48(2):370-382.
- [Google Scholar]
- Statistical method for testing the neutral mutation hypothesis by DNA polymorphism. Genetics.. 1989;123(3):585-595.
- [CrossRef] [Google Scholar]
- Molecular genetic diversity and differentiation of Nile tilapia (Oreochromis niloticus, L. 1758) in East African natural and stocked populations. BMC Evol. Biol.. 2020;20(16)
- [CrossRef] [Google Scholar]
- DNA barcoding Australia’s fish species. Philosoph. Trans. Royal Society B-Biolog. Sci.. 2005;360:1847-1857.
- [CrossRef] [Google Scholar]
- Genetic diversity and structure related to expansion history and habitat isolation: stone marten populating rural–urban habitats. BMC Ecol.. 2017;17:46.
- [CrossRef] [Google Scholar]
- Maternal inheritance in polyploid fish inferred from mitochondrial ATPase genes analysis. Prog. Nat. Sci.. 2009;19:693-698.
- [Google Scholar]
- Genetic diversity and connectivity of ocypode ceratophthalmus in the east and south china seas and its implications for conservation. Biology.. 2023;12:437.
- [CrossRef] [Google Scholar]
Appendix A
Supplementary material
Supplementary data to this article can be found online at https://doi.org/10.1016/j.jksus.2024.103585.
Appendix A
Supplementary material
The following are the Supplementary data to this article:


