

Translate this page into:
Ecological risk assessment and potential source of As, Cd, Co, and Ni in Al Qunfudhah seawater, Red Sea coast, Saudi Arabia
⁎Corresponding author. asmohamed@ksu.edu.sa (Abdelbaset S. El-Sorogy),
-
Received: ,
Accepted: ,
This article was originally published by Elsevier and was migrated to Scientific Scholar after the change of Publisher.
Abstract
The rapid economic expansion of the worldwide coastal settlements has resulted in the discharge of substantial amounts of heavy metals (HMs), posing a considerable risk to marine organisms. The present work aims to evaluate the HM contamination of seawater and determine their potential sources in Al Qunfudhah seawater, Red Sea coast utilizing contamination factor (CF), degree of contamination (Cd), modified contamination factor (mCd), heavy metal pollution index (HPI), and multivariate analysis. A total of twenty-nine samples of surface seawater were gathered and the analysis of HMs was conducted using Inductively Coupled Plasma Mass Spectrometry (ICP-MS). The average concentration of dissolved HMs follows the following order: As (5.83 μg/L) ˃ Ni (0.990 μg/L) ˃ Co (0.168 μg/L) ˃ Cd (0.090 μg/L). The average concentrations of As, Co, Ni, and Cd were below the maximum admissible concentration (MAC) set by the World Health Organization (WHO), as well as the criterion continuous concentration (CCC) and criterion maximum concentration (CMC) set by the environmental protection agency. This suggests that the levels of these substances are within the acceptable limits for protecting aquatic life, both in the short-term and long-term exposures. The results of the analysis for CF, Cd, mCd, and HPI suggested clean and uncontaminated seawater in most sites. Few individual samples obtained elevated values, which might be attributed to natural source, mostly from chemical weathering of rock forming minerals from the Arabian Shield, as well as agricultural and coastal activities.
Keywords
Contamination factor
Water quality index
Heavy metal pollution index
Arsenic
Nickel
Principal component analysis

1 Introduction
Coastal environments are inherently dynamic and very fragile ecosystems that are particularly vulnerable to the effects of climate change, agricultural and industrial operations, and population expansion in coastal zones (Rao et al., 2021). Nevertheless, these settings are distinguished by their remarkable biological, geological, ecological, and topographical diversity (Er-Ramy et al., 2022). The rapid economic expansion across coastal areas has resulted in a continuous increase in contamination of the marine ecology, particularly in the coastal zones (Azdem et al., 2024).
Heavy metals are extensively disseminated in the environment, resulting from both natural processes and anthropogenic activities within aquatic ecosystems. In 1995, the Environment Protection Agency identified As, Cd, Cr, Cu, Hg, Ni, Pb, and Zn as the eight most prevalent heavy metal pollutants. impact of HMs on aquatic systems is contingent upon their concentration and the chemical forms (Hader et al., 2021). The permanence of HM pollution in the environment and their significant capacity to accumulate in aquatic creatures and human tissues make them a matter of great worry (Chen et al. 2019; Hader et al., 2021).
Elements such as As, Cd, Co, and Ni are commonly found in coastal areas and can contaminate aquatic systems through both natural and human activities. This contamination poses significant environmental challenges for marine creatures (Pan and Wang, 2012). Hazardous HMs can be absorbed by marine animals and then enter the food chain, potentially accumulating at higher levels of the food web and ultimately impacting human health (Hader et al., 2021). The main pathway of metal exposure in human populations is via the ingestion of pesticide-contaminated seafood, together with the consumption of water. Adverse effects of metal toxicity in the human body have been shown to cause several diseases (Jaishankar et al., 2014; Hader et al., 2021). HMs provide hazards not just to human health but also to the biodiversity of aquatic organisms.
HMs have been increasingly discharged into the coastal environments of the Red Sea and Gulf of Aqaba coasts through human activities by oil spills, wastewater discharge, and marine traffic, as well as the geogenic source, mainly from weathering of nearby rocks (e.g., Badr et al. 2009; Kahal et al., 2023; El-Sorogy et al. 2023; Alharbi et al., 2024). To be precise, there have been no prior investigations undertaken to assess the quality of seawater in Al-Qunfudhah study region. Nevertheless, the two most proximate investigations in this region are the coastal seawater study carried out in Al-Lith, situated directly north of the current study area (Alharbi et al., 2024), and the seawater study conducted in Jazan, located south of the present study area (Kahal et al., 2023). The two prior investigations have consistently shown that the Arabian Shield rocks and sediments located in the coastal plain of the Red Sea are the primary natural origins of the majority of HMs. Yet, agricultural and industrial operations can be the origin of certain elements including lead, cadmium, zinc, and chromium.
Principal component analysis (PCA) helps identify seawater pollution causes, including industrial and agricultural activities, by handling large datasets (Shokr et al., 2022). Water quality indices (WQIs) and the heavy metal pollution index (HPI) simplify data into a single value and assess water quality based on permissible heavy metal limits, respectively (El Behairy et al., 2022). The primary objectives of this work are to evaluate the ecological risk assessment of arsenic, cadmium, cobalt, and nickel in Al Qunfudhah seawater, Red Sea coast, Saudi Arabia, using various contamination indices (CF, Cd, mCd, and HPI), and to investigate the potential sources of HMs through statistical analysis.
2 Material and methods
2.1 Study area
The research area is located along the Al Qunfudhah coastline on the southwestern coast of Saudi Arabia, in close proximity to the Red Sea. Al Qunfudhah area is located east of the fundamental rocks of the Asir mountain range. The rocks are mostly composed of Proterozoic volcanic-sedimentary formations from the Arabian Shield (Sulaiman et al., 2018; Abdelkareem et al., 2020). The intertidal sediment is composed of fine to coarse sandy mud and sands of both terrestrial and biogenic elements. The terrestrial portion has been transported from the Arabian shield, whereas the biogenic elements are deposited on the beach during storms and tides (El-Sorogy et al., 2016). Mangrove trees are present in certain areas of the region.
Al-Qunfudhah Governorate encompasses agricultural areas that depend on groundwater for irrigation purposes. These agricultural establishments cultivate maize for animal feed, a diverse range of fruits, mangoes, date palms, lemons, olives, pomegranates, prickly pears, other citrus fruits, and an assortment of vegetables. Alshehri et al. (2021) attributed the increase of the average values of some major ions, and HMs in groundwater of Al-Qunfudhah area to seawater intrusion, over application of fertilizers and pesticides in agricultural practices.
2.2 Sampling and content of heavy metals
A total of twenty-nine saltwater samples were collected in January 2024 using pre-cleaned high-density polyethylene (HDPE). The seawater samples were obtained from the intertidal zone adjacent to the Al Qunfudhah beach, situated within the geographical coordinates of 18° 05′ 51″ N − 19° 29′ 31″ N and 40° 57′ 31″ E − 41° 27′ 35″ E (Fig. 1). The aforementioned samples were obtained from the uppermost 10 cm layer of saltwater directly to HDPE containers to avoid contamination from the surrounding environment and store samples at 4 °C until analysis. Nitric acid (65–70 %) was added to the samples to prevent metal adsorption onto container walls and microbial activity. Seawater samples subjected to preparation through dilution, matrix removal or control, and spiking. This ensured the samples remained stable until analysis. The Saudi Food and Drug Authority conducted an analysis of arsenic, cadmium, cobalt, and nickel using Inductively Coupled Plasma Spectrometry (ICP-MS; Perkin Elmer, Waltham, MA, USA), a laboratory method renowned for its exceptional sensitivity and broad dynamic range in rapidly analyzing multiple elements (Mohapatra and Sinha, 2024). In a 15 mL polypropylene centrifuge tube, 10 mL of each water sample was combined with 0.2 mL of a 1 % solution of HNO3, 0.5 % hydrochloric acid, and 4 % isopropanol. The use of isopropanol will reduce the susceptibility to arsenic resulting from the presence of residual carbon during digestion (Mohapatra and Sinha, 2024).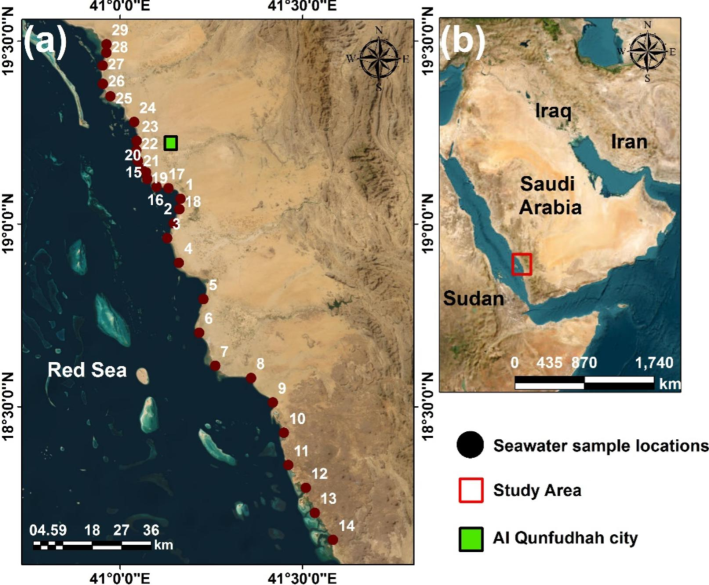
Study area and seawater sampling locations.
To ensure proper digestion, the solution was allowed to sit overnight, followed by a meticulous mixing and subsequent injection of the mixture. Simultaneously, a container of deionized water was prepared. The equipment underwent calibration using a multi-element standard and an internal standard provided by Agilent (Santa Clara, CA, USA). The calibration levels spanned from 0.1 µg/L to 100 µg/L. In order to quantitatively match the sample solutions with the calibration standards and blank solution, acid matching was performed using a 1 % (v/v) HNO3 and 1 % (v/v) HCl solution. Quality control measures include analyzing procedural blanks to monitor contamination and conducting duplicate analyses for precision. Accuracy is validated using certified reference materials (CRMs) and spike recovery tests with acceptable rates of 80–120 %. Drift is managed by analyzing internal standards and recalibrating as needed. Daily instrument tuning with Li, Y, Ce, and Tl ensures optimal performance.
2.3 Heavy metals assessment
This study employed the contamination factor (CF), contamination degree (Cd), modified contamination degree (mCd), and heavy metal pollution index (HPI) to assess the extent of pollution in seawater. The modified contamination degree (mCd) can function as a water quality indicator (WQI) to comprehensively assess the severity and quality of saltwater pollution (Abdel Ghani et al., 2023). The calculation procedures for the contamination indices used in this study are outlined in Eqs. (1)–(5) and Table S.1, following the descriptions provided by Hakanson (1980) and Abrahim and Parker (2007).
2.4 Statistics
The statistical methods used in this study included dendrogram analysis with average linkage, correlation matrix, Kaiser-Meyer-Olkin Measure of sampling adequacy test and principal component analysis (PCA), based on Eigenvalue more than 1, which makes the interpretation of sources of heavy metals easy and find the hidden relationship between them. These tools were applied to identify potential sources of HMs. These statistical methods were applied using IBM SPSS Statistics 29 and Origin Pro 2023b software.
3 Results and discussion
3.1 Concentration and distribution of heavy metals
In supplementary Table 2, the HMS content, together with the results of Cd and HPI, are presented for the 29 surface seawater samples. A descending order of the HMs was established as follows: arsenic ˃ nickel ˃ cobalt ˃ cadmium, recording values of 5.83 μg/L, 0.99 μg/L, 0.17 μg/L, and 0.09 μg/L, respectively. The distribution of cobalt per sample location exhibits a shifting pattern devoid of any discernible trend (Fig. 2). Nevertheless, Q23 had the greatest concentration of Co, with a value of 1.129 μg/L. The data for Cd exhibited a consistent changing trend, with elevated values observed in Q8, Q10, Q17, and Q28. The data distribution of As revealed that Q23 exhibited the highest concentration (30.27 μg/L), with relatively elevated levels observed in Q9, Q10, Q13, Q17, Q21, and Q22. In relation to the Ni, Q23 had the highest recorded value of 7.634 μg/L, but Q9 and Q16 displayed higher values as well (Fig. 2). Sources of HMs in the investigated seawater may include natural geochemical processes or mining activities. The increased concentrations of HMs in particular locations can be linked to the rapid growth of mangrove trees in those areas, as mangrove trees possess the ability to capture and store material from the land, resulting in a rise in the concentration of HMs within these sediments (Al-Kahtany and El-Sorogy, 2022).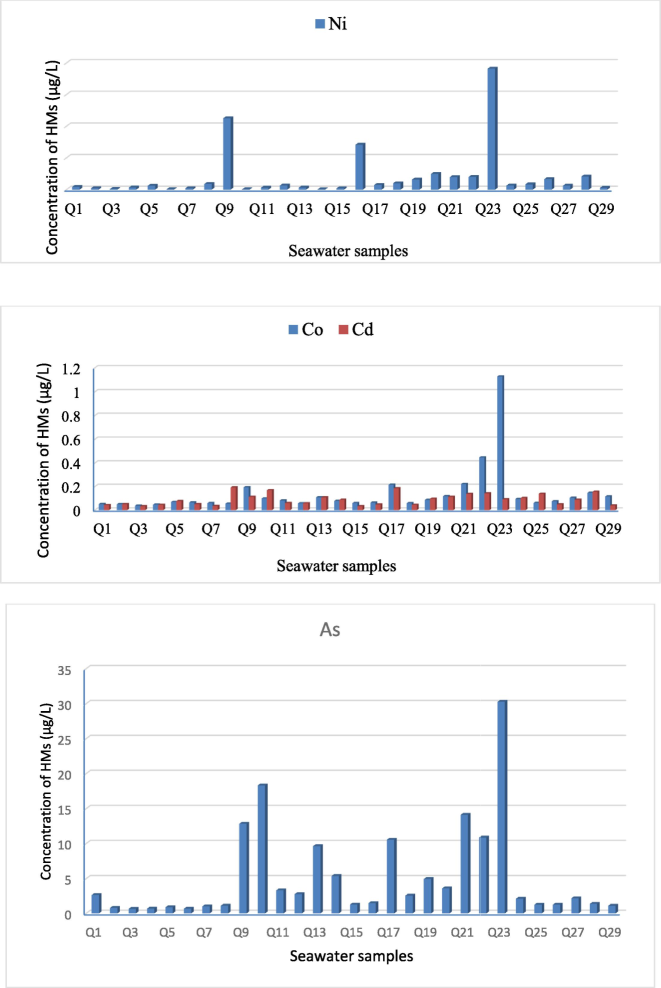
Distribution of heavy metals per sample locations in Al Qunfudhah seawater.
The PCA was utilized to ascertain the potential origins of the HMs present in the examined seawater (Al-Hashim et al., 2022; Al-Kahtany and El-Sorogy, 2022). Q-mode HCA supported the sample distribution and subdivided the studied localities into three clusters (Fig. 3). The first cluster contains samples Q1-Q8, Q11, Q12, Q14-Q16, Q18-Q20, and Q24-Q29. Seawater samples in this cluster reported the lowest values of the tested HMs (Table S.2). For instant, the lowest values of Co, Ni, As, and Cd are reported in Q3, Q14, and Q15. The second cluster accounts sample Q23, which is characterized by the highest concentrations of Co, Ni, As, and Cd (1.13, 7.63, 30.27, and 0.09 μg/L, respectively). The sediment at the Q23 site consists of a mixture of sandy mud and fine quartz sands. In contrast to the coarser sediments, these sediments possess the ability to hold HMs and then release them into the water column (El-Sorogy et al., 2022). The third cluster comprises samples Q9, Q10, Q13, Q17, Q21, and Q22, which have HM values above those of the first cluster and below those of the second cluster.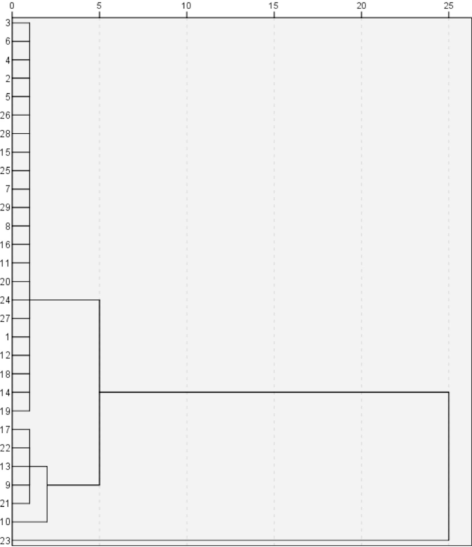
Q mode HCA of Al Qunfudhah seawater samples.
Upon comparing the results with the MAC established by WHO (2011) and the guidelines released by the EPA regarding the CMC for acute toxicity and the CCC in 2015, it is evident that the average arsenic value from Al Qunfudhah seawater (5.83 μg/L) decreases the MAC (10 μg/L).
However, 7 samples (Q9, Q10, Q17, Q21-Q23) exceeded the MAC level and all samples decreased the CCC level (36 μg/L) and the CMC for As (Table 1, Table S.2). This suggests possible issues with long-term exposure but compliance with acute toxicity standards. Conversely, the levels of Co, Ni, and Cd were found to be lower than the MAC, CCC, and CMC, suggesting adherence to the standards for safeguarding aquatic environments in both short-term and long-term exposures.
References
Ni
Co
As
Cd
Present study
0.99
0.168
5.83
0.09
Maximum admissible concentration (WHO, 2011)
20
5
10
3
Yanbu coastline, Red Sea, Saudi Arabia (El-Sorogy et al., 2023)
4.42
0.14
4.3
0.31
Red Sea-Gulf of Aqaba, Saudi Arabia (El-Sorogy and Youssef, 2021)
2.45
0.31
2.43
0.05
Abu Ali Island, Arabian Gulf (Al-Kahtany and El-Sorogy, 2022)
3.49
0.27
3.96
0.08
Rosetta coast, Mediterranean Sea, Egypt (El-Sorogy and Attiah 2015)
1.92
−
0.3
−
Al-Khobar, Arabian Gulf, Saudi Arabia (Alharbi et al. 2017)
4.36
0.36
2.41
0.11
Jazan, Red Sea, Saudi Arabia (Kahal et al., 2023)
1.3
0.22
−
0.06
Tarut Island, Saudi Arabia (El-Sorogy et al., 2016)
−
2.06
11.13
0.03
Caspian coast, Iran (Nematollahi et al., 2021)
9.93
1.65
−
0.27
Al-Khafji, Arabian Gulf, Saudi Arabia (Alharbi and El-Sorogy, 2019))
4.4
0.23
1.74
0.07
Gulf of Aqaba (Shriadah et al., 2004)
0.22
0.17
−
0.57
Gulf of Aqaba, Saudi Arabia (Al-Taani et al.,2014)
−
0.24
0.82
0.03
US EPA, 2015
criterion maximum concentration (CMC)
47
−
69
33
criterion continuous concentration (CCC)
8.2
−
36
7.9
Moreover, the mean values of Co, Ni, and Cd were below the typically reported averages seen in seawaters from various regions globally, including the Mediterranean, Red and Caspian seas, as well as the Arabian and Aqaba gulfs (e.g., Shriadah et al. 2004; Al-Taani et al. 2014, El-Sorogy and Attiah 2015; El-Sorogy et al. 2016; Alharbi et al. 2017; Alharbi and El-Sorogy 2019, Abadi et al. 2018).
3.2 Ecological assessment of heavy metals
The assessment of the CF across the sample locations in the studied area revealed diverse environmental conditions. In general, the average CF values for As, Co, Ni, and Cd in the seawater samples remained below 1, indicating a low level of contamination for these HMs (Hakanson, 1980; Lü et al., 2015). Q23 showed CF value for As and Co more than 2, indicating a moderate level of contamination (Table S.3). Furthermore, the average CF values for As in Q9, Q10, Q17, and Q22 are slightly exceeded 1, suggesting a moderate level of contamination, likely from natural mineral dissolution and agricultural activities (Nematollahi et al., 2021).
Values of the Cd showed significant variability among the different studied sites along Al Qunfudhah coastline. Cd values varied from 0.119 to 4.39, with an average of 0.82, indicating low contamination for overall tested seawaters. However, Q23 exhibits low to moderate contamination (Cd = 4–8). The distribution of Cd values per sample locations indicated that 28 seawater samples obtained values less than 4, while one sample (Q23) showed Cd value of 4.39 (Fig. 4). These findings implying a clean marine environment in large portions of the Red Sea coast. The variability suggests moderate localized pollution rather than widespread contamination (Backman et al. 1997).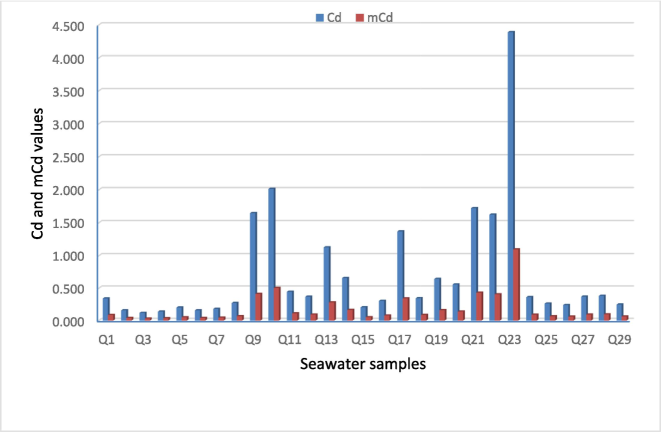
Distribution of Cd and mCd per sample locations in Al Qunfudhah seawater.
The obtained WQI values for the Al Qunfudhah seawater were varied from 0.03 to 1.10, with an average of 0.21, implying uncontaminated seawater (Abdel Ghani et al., 2023). However, the increase of mCd value in Q23 is mainly attributed to higher reported As concentration in these sites (Abrahim and Parker, 2007).
Analysis of the revealed that 18 samples (62 %) had minimal pollution or below the critical threshold (HPI < 5), suggesting natural or near-pristine conditions; 4 samples from 5 to 10, revealing medium pollution, and the remaining 7 samples showed HPI values above 10 (Fig. 5), indicating high pollution (Prasanna et al., 2012; Kahal et al., 2023). The elevated HPI values in the central part of the study area might be related to agricultural runoff and coastal development (Alharbi and El‑Sorogy, 2023; El-Sorogy et al., 2023). These sites require attention to identify and mitigate the proper sources.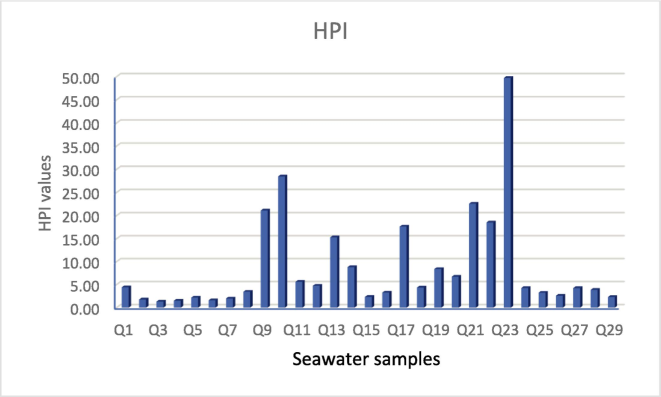
Distribution of HPI per sample locations in Al Qunfudhah seawater.
3.3 Multivariate tools
An analysis of the relationship between the HMs was conducted using a Pearson correlation matrix (Table 2). The correlation matrix showed a strong positive connection (r = 0.81) between the concentrations of Co and Ni, as well as between Co and As (r = 0.82), indicating that these HMs might originate from similar processes or inputs. The probable natural sources of these HMs are the process natural mineral dissolution and fragmentation from the igneous and metamorphic rocks in the eastern part of the coastal plain of the Red Sea. Anthropogenic sources might be the application of agricultural activities from Al Qunfudhah farms (Obinna and Ebere 2019; El-Sorogy and Al Khathlan, 2024).
The absence of substantial correlations between Cd and other HMs may indicate that its sources or mobility differ significantly from the other HMs, possibly being more influenced by specific factors such as localized pollution or biological processes (Chen et al. 2014; Alharbi and El-Sorogy 2019). R-mode HCA strongly supports the correlation matrix by dividing the tested HMs into two distinct clusters (Fig. 6). The first clutter showed a strong relationship between Co and Ni implies that these HMs are likely influenced by similar sources. The moderate inclusion of As in this cluster suggests partial overlap in its source or transport mechanism, possibly linked to agricultural runoff (Alharbi et al., 2024). The separate behavior of Cd indicates that its sources or mobility in seawater are unique compared to the other HMs. It could be influenced by localized pollution or biological Processes.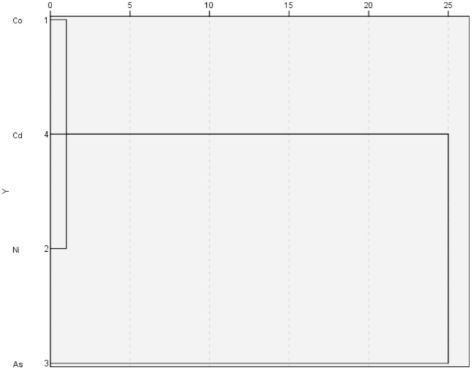
R mode HCA of the investigated HMs.
This study utilizes PCA to identify several sources of saltwater pollution and to calculate the percentage of HMs that contribute to seawater contamination (Lin et al., 2013; Yang et al., 2020). The Kaiser-Meyer-Olkin Measure of sampling adequacy test has done to explain if the data suitable for PCA or not (Table S.4). A single PC was recovered, which accounted for 66.34 % of the total variance (Table 3). This PC displays a significant loading for arsenic, cobalt, and nickel. The seawater quality along the Al Qunfudhah coastline is primarily influenced by natural processes resulting from the chemical breakdown of Proterozoic volcanic-sedimentary formations in the nearby Arabian Shield. A little contribution is made due to agricultural activates and coastal development (Masuda, 2018). Prominent arsenic minerals in the Arabian shield are arsenopyrite, orpiment, and enargite. These minerals are commonly linked with mineralization in schists, gneisses, volcanic, and sub-volcanic rocks.
Component
PC1
Co
0.939
Ni
0.869
As
0.929
Cd
0.391
% of Variance
66.34
Cumulative %
66.34
4 Conclusions
The distribution of HMs across the sample sites displayed a diverse pattern without a consistent trend. However, several individual samples of muddy and fine sediments near mangrove trees displayed slightly elevated HMs. The average concentrations of arsenic, cobalt, nickel, and cadmium were determined to be below the MAC, CCC, and CMC standards, indicating adherence to the guidelines for protecting aquatic life in both short-term and long-term exposures. The findings from the examination of CF, Cd, HPI, and m Cd indicated that most locations exhibit low contamination indices, implying that the seawater quality of Al Qunfudhah is generally acceptable. Natural sources of these substances include the process of rock weathering from the Arabian Shield. The coastal developments and the agricultural practices may attribute the least.
CRediT authorship contribution statement
Khaled Al-Kahtany: Writing – review & editing, Writing – original draft, Supervision, Software, Project administration, Funding acquisition. Abdelbaset El-Sorogy: Writing – review & editing, Writing – original draft, Validation, Software, Methodology, Investigation. Talal Alharbi: Writing – review & editing, Writing – original draft, Software, Methodology.
Acknowledgments
The authors extend their appreciation to Researchers Supporting Project number (RSPD2024R1044), King Saud University, Riyadh, Saudi Arabia. Moreover, the authors thank the anonymous reviewers for their valuable suggestions and constructive comments.
Declaration of competing interest
The authors declare that they have no known competing financial interests or personal relationships that could have appeared to influence the work reported in this paper.
References
- Heavy metals and arsenic content in water along the southern Caspian coasts in Iran. Environ. Sci. Pollut. Res. 2018
- [CrossRef] [Google Scholar]
- Spatial distribution and pollution assessment of heavy metals in surface and bottom water along the eastern part of the Egyptian Mediterranean coast. Mar. Pollut. Bull.. 2023;197:115713
- [CrossRef] [Google Scholar]
- Multispectral and RADAR images integration for geologic, geomorphic, and structural investigation in southwestern Arabian Shield, Al Qunfudhah area, Saudi Arabia. J. Taibah Univ. Sci.. 2020;14(1):383-401.
- [Google Scholar]
- Assessment of heavy metal enrichment factors and the degree of contamination in marine sediments from Tamaki Estuary, Auckland, New Zealand. Environ. Monit. Assess.. 2007;136:227-238.
- [CrossRef] [Google Scholar]
- Metal pollution in Al-Khobar seawater, Arabian Gulf, Saudi Arabia. Mar. Pollut. Bull.. 2017;119:407-415.
- [Google Scholar]
- Assessment of seawater pollution of the Al-Khafji coastal area, Arabian Gulf Saudi Arabia. Environ. Monitor. Assessment. 2019;191:383.
- [Google Scholar]
- Distribution and comprehensive risk evaluation of Cr, Cd, Fe, Zn, and Pb from Al Lith coastal seawater Saudi Arabia. Water. 2024;16(13):1923.
- [CrossRef] [Google Scholar]
- Environmental assessment of surface seawater in Al-Uqair coastline Eastern Saudi Arabia. Water. 2022;2022(14):3423.
- [CrossRef] [Google Scholar]
- Heavy metal contamination of surface seawaters in Abu Ali Island Saudi Arabia. Arab. J. Geosci.. 2022;15:1662.
- [CrossRef] [Google Scholar]
- Influence of seawater intrusion and heavy metals contamination on groundwater quality, Red Sea coast Saudi Arabia. Marine Pollut. Bull.. 2021;165:112094
- [Google Scholar]
- Status of trace metals in surface seawater of the Gulf of Aqaba, Saudi Arabia. Mar. Pollut. Bull.. 2014;86:582-590.
- [Google Scholar]
- Assessment of heavy metal contamination in seawater in Agadir coastline Morocco. Desalination Water Treat.. 2024;317:100129
- [CrossRef] [Google Scholar]
- Application of a groundwater contamination index in Finland and Slovakia. Environ. Geol.. 1997;36:55-64.
- [Google Scholar]
- Metal pollution records in core sediments of some Red Sea coastal areas, Kingdom of Saudi Arabia. Environ. Monit. Assess.. 2009;155(1–4):509-526.
- [Google Scholar]
- Spatial distribution and risk assessment of metals in dust based on samples from nursery and primary schools of Xi'an, China. Atmos. Environ.. 2014;88:172-182.
- [Google Scholar]
- Concentration, fluxes, risks, and sources of heavy metals in atmospheric deposition in the Lihe River watershed, Taihu region, eastern China. Environ. Pollut. 2019:255.
- [Google Scholar]
- Combination of GIS and multivariate analysis to assess the soil heavy metal contamination in some arid zones. Agronomy. 2022;12:2871.
- [Google Scholar]
- Assessment of potentially toxic elements and health risks of agricultural soil in Southwest Riyadh Saudi Arabia. Open Chem.. 2024;22:20240017
- [CrossRef] [Google Scholar]
- Assessment of metal contamination in coastal sediments, seawaters and bivalves of the Mediterranean Sea coast Egypt. Marine Pollut. Bull.. 2015;101:867-871.
- [Google Scholar]
- Integrated assessment of the Tarut Island coast, Arabian Gulf Saudi Arabia. Environ. Earth Sci.. 2016;75:1336.
- [Google Scholar]
- Water quality assessment and environmental impact of heavy metals in the Red Sea coastal seawater of Yanbu Saudi Arabia. Water. 2023;15:201.
- [CrossRef] [Google Scholar]
- Coastal scenic quality assessment of moroccan mediterranean beaches: a tool for proper management. Water. 2022;14:1837.
- [CrossRef] [Google Scholar]
- Anthropogenic pollution of aquatic ecosystems. Springer Nat. Switzerland. 2021;426:p.
- [CrossRef] [Google Scholar]
- An ecological risk index for aquatic pollution control a sedimentological approach. Water Res.. 1980;14:975-1001.
- [Google Scholar]
- Toxicity, mechanism and health effects of some heavy metals. Interdiscip. Toxicol.. 2014;7(2):60-72.
- [Google Scholar]
- Environmental risk assessment and sources of potentially toxic elements in seawater of Jazan Coastal Area Saudi Arabia. Water. 2023;15:3174.
- [CrossRef] [Google Scholar]
- Multivariate analysis of heavy metal contaminations in seawater and sediments from a heavily industrialized harbor in Southern Taiwan. Mar. Pollut. Bull.. 2013;76:266-275.
- [CrossRef] [Google Scholar]
- Distribution and pollution assessment of trace metals in seawater and sediment in Laizhou Bay Chin. J. Oceanol. Limnol.. 2015;33:1053-1061.
- [CrossRef] [Google Scholar]
- Arsenic cycling in the Earth’s crust and hydrosphere: interaction between naturally occurring arsenic and human activities. Prog Earth Planet Sci. 2018;5:68.
- [CrossRef] [Google Scholar]
- High Precision Analysis of Heavy Metals in Water by ICP-MS. In: Book: Futuristic Trends in Pharmacy and Biotechnology. Publisher: AkiNik Publications; 2024. p. :63-77.
- [CrossRef] [Google Scholar]
- Hydrogeochemical and ecological risk assessments of trace elements in the coastal surface water of the southern Caspian Sea. Environ. Monit. Assess.. 2021;193:452.
- [Google Scholar]
- Water pollution by heavy metal and organic pollutants: brief review of sources, effects and progress on remediation with aquatic plants. Anal. Methods Environ. Chem. J.. 2019;2(3):5-38.
- [Google Scholar]
- Trace metal contamination in estuarine and coastal environments in China. Sci. Total Environ.. 2012;421–422:3-16.
- [CrossRef] [Google Scholar]
- Evaluation of water quality pollution indices for heavy metal contamination monitoring: a case study from Curtin Lake, Miri City, East Malaysia. Environ. Earth Sci.. 2012;67:1987-2001.
- [Google Scholar]
- Spatial-temporal dynamics, ecological risk assessment, source identification and interactions with internal nutrients release of heavy metals in surface sediments from a large Chinese shallow lake. Chemosphere. 2021;282:131041
- [CrossRef] [Google Scholar]
- Assessment of potential heavy metal contamination hazards based on GIS and multivariate analysis in some Mediterranean Zones. Agronomy. 2022;12:3220.
- [CrossRef] [Google Scholar]
- Trace metals in the water columns of the Red Sea and the Gulf of Aqaba Egypt. Water, Air, Soil Pollut.. 2004;153:115-124.
- [Google Scholar]
- Gravity interpretation to image the geologic structures of the coastal zone in al Qunfudhah area, southwest Saudi Arabia. Geophys. J. Int.. 2018;214:1623-1632.
- [Google Scholar]
- US EPA, O., 2015. National Recommended Water Quality Criteria - Aquatic Life Criteria Table [WWW Document]. URL https://www.epa.gov/wqc/national-recommended-water-quality-criteria-aquatic-life-criteria-table (accessed 1.2.24).
- World Health Organization (WHO), 2011. Guidelines for drinking-water quality, 4th ed. Geneva, Switzerland.
- Beyond mere pollution source identification: determination of land covers emitting soil heavy metals by combining PCA/APCS GeoDetector and GIS Analysis. Catena. 2020;185:104297
- [Google Scholar]
Appendix A
Supplementary material
Supplementary data to this article can be found online at https://doi.org/10.1016/j.jksus.2024.103560.
Appendix A
Supplementary material
The following are the Supplementary data to this article:


