

Translate this page into:
Compositional constraints and selection forces dictate codon usage in human bocavirus
⁎Corresponding authors. rekha.khandia@bubhopal.ac.in (Rekha Khandia), azkhan@ksu.edu.sa (Azmat Ali Khan)
-
Received: ,
Accepted: ,
This article was originally published by Elsevier and was migrated to Scientific Scholar after the change of Publisher.
Abstract
Objectives
Human bocavirus (HBoV), of the genus Bocaparvovirus, is a small, non-enveloped linear single-stranded DNA virus of the Parvoviridae family. The virus is known to cause severe life-threatening respiratory tract infections in pediatric patients. Considering its deleterious impacts on respiratory, gastrointestinal, and hematological health, we prompted to investigate codon usage patterns, parity, neutrality, Nc-GC3 analysis, gene expression, Intrinsic codon bias index (ICDI), Codon bias index (CBI), Relative codon deoptimization index (RCDI), Translational selection (P2), and measure independent of length and composition (MILC) to investigate the role of evolutionary constraints such as selection and mutation and molecular patterns present in HBoV.
Methods
805 HBoV sequences were investigated using various software and statistical tools.
Results
The present study demonstrated the predominant governance of selection forces over mutational forces in determining codon usage. The compositional parameters were pivotal in deciding the dinucleotide occurrence and frequently used codons. Since the HBoV genomes were A-and T-nucleotide-rich, A/T ending codons and ApAdinucleotides were overrepresented. Despite the A/T richness, at the non-neutral positions of the codon, the G/C nucleotide content was found to be the highest, again underscoring the selective forces that drive a high percentage of G/C nucleotide. At the non-neutral codon positions, with an increase in GC nucleotide, codon bias also increased, while at the third position of the codon, with an increase in GC content, it was decreased. Overall, there is a low codon bias in HBoV. A total of nine A/T ending codons were overrepresented, while nineteen G/C ending codons were underrepresented. Interestingly, instead of CTG, a commonly overrepresented codon, AGA was the most overrepresented codon. AGA and CGG encoding for arginine showed average maximum and minimum RSCU values in the HBoV genome.
Conclusions
The collective inference from the neutrality plot, Nc-GC3 curve, and P2 analysis indicated the prevalence of selection force over mutation force. With that, our study offers a novel perspective on the different molecular patterns present in HBoV, and the results might be implicated in designing efficacious therapeutic modalities against HBoV.
Keywords
Human bocavirus
Influenza-like illness
Selection pressure
Compositional constraint
Ground-glass-like opacity

1 Introduction
Human bocavirus (HBoV) is a linear, small 5300 bp-sized, single-stranded DNA virus of the Bocaparvovirus genus (Schildgen et al., 2012). Most of the HBoV infections, the self-limiting influenza-like illness is caused (Bubshait et al., 2015), which can be exacerbated in severe life-threatening conditions such as respiratory failure, pneumothorax, and myocarditis (Bagasi et al., 2020). The severity may be high for cancer and immune-compromised patients. Bilateral and multifocal consolidation and ground-glass opacity are common radiological findings associated with HBoV infections, with an overall mortality rate of 54.5% (Choi et al., 2021). Chest computed tomography (CT) scan findings in cases of HBoV infection indicated bilateral consolidation (70.6%) and/or ground-glass opacities (64.7%); and centrilobular nodules (14.7%) (Lee et al., 2019). These CT scan patterns are reminiscent of SARS-CoV-2 infections (Silva et al., 2021).
HBoV is present as a co-infection with human metapneumovirus, human respiratory syncytial virus, and influenza viruses A and B (Guido et al., 2011). Co-infections of HBoV with the human respiratory syncytial virus lead to prolonged hospitalization and pneumonia than infections caused by HBoV or RSV alone (Sun et al., 2019). Similarly, HBoV-HPIV (human parainfluenza virus) experience more wheezing symptoms than patients infected with HBoV or HPIV alone (Fry et al., 2007).
So far, four genotypes of HBoV have been detected, namely HBoV1- HBoV4 (Paik et al., 2019). HBoV1 is detected in the respiratory tract and gastrointestinal infections, whereas HBoV2 and 4 are detected in fecal specimens (Guido et al., 2016; Nora-Krukle et al., 2018). In children, HBoV types 2 and 3 lead to acute gastroenteritis (Risku et al., 2012). HBoV is also found in the serum with unknown relevance, which may be linked to virus-related clinical manifestations (Kahn, 2008).
Such clinical outcomes of HBoV infection prompted us to investigate its molecular patterns that included codon usage bias, parity, neutrality, Nc-GC3 analysis, gene expression, intrinsic codon bias index (ICDI), Codon bias index (CBI), relative codon deoptimization index (RCDI), translational selection (P2), and measure independent of length and composition (MILC). Understanding these molecular patterns and signatures might help design vaccine candidates by attenuating the virus itself or increasing the HBoV protein expression in a heterologous expression system and thereby help scientists design effective therapies against it. Apart from that, the study is useful in gaining insights into the various evolutionary forces that acted upon the viral sequences and in paving the way to understanding other pathogens' evolution.
2 Material and methods
2.1 Data collection
Eight hundred-five coding sequences (CDSs) of HBoV (available till 15.07.22) were retrieved from the NCBI database. A total of 1,267,140 nucleotides and 422,380 codons were examined in this study. The entire attributes related to sequence are provided in Supplementary Table S1.
2.2 Dinucleotide abundance
The odds ratio (OR) is the ratio of observed and expected occurrence of 16 dinucleotides and is computed using Emboss compseq online tool.
2.3 Relative synonymous codon usage (RSCU) analysis
RSCU is an index of codon usage bias obtained using the DNASTAR LasergeneInc software. When the RSCU value is more than 1.6, it is overrepresented; when it is below 0.6, it is underrepresented.
2.4 Analysis of gene expression using measure independent of length and composition (MILC)
The MILC is a quantitative method for estimating gene expression levels and is independent of the gene's sequence length, nucleotide composition, and overall codon bias. The MILC and MELP values were calculated using the INCA version 2 software (Malakar et al., 2020).
2.5 Codon adaptation index (CAI)
Sharp and Li (1987) proposed directional synonymous CUB as a metric (Sharp and Li, 1987). The measurements ranged between 0 and 1. Values closer to 1 suggest an intense bias toward high gene expression; more specifically, it indicates translation efficiency (Sharp and Li, 1987).
2.6 Intrinsic codon bias index (ICDI)
ICDI measures codon bias and is independent of the optimal codons. Its value varies between 0 and 1, where 0 signifies no bias while 1 shows the utmost bias. Values less than 0.3 suggest relatively low bias (Freire-Picos et al., 1994). The ICDI value was calculated using COUSIN software available at https://cousin.ird.fr/.
2.7 Neutrality and parity and Nc determination
The neutrality, parity, and ENc-GC3 curve determine the interplay between the compositional, mutational, and selection forces. The regression coefficient expresses the equilibrium state of mutation and selection and is performed between %GC3 and %GC12. In the parity plot, AT bias and GC biases are plotted on the X and Y axes, respectively, suggesting the nucleotide skew at the third codon position. Nc value varies from 20 to 6. The lowest value for Nc is 20, achieved when out of many synonymous codons available, only one is used and shows the highest bias. The highest value, 61, points towards equal usage of all synonymous codons to code for an amino acid and suggest the lowest bias (Munjal et al., 2020).
2.8 Translational selection (P2)
The P2 value is a measure that calculates the codon and anticodon interactions and ultimately the translation efficiency (Bennetzens and Hall, 1982). P2 is calculated using the formula given by Gouy and Gautier (1982).
2.9 Codon bias index (CBI) analysis
CBI is an index useful in determining gene expressivity in a CDS. The value ranges between −1 and +1, where −1 indicates that all codons are non-preferred, 0 indicates random usage, and +1 indicates that all codons are most preferred within a gene. In this study, CBI was calculated using the CodonW 1.4.4.
2.10 Relative codon deoptimization index (RCDI)
It is a phenomenon for understanding virus adaptivity in the host. Here, the virus codon usage is compared with that of the host. RCDI values closer to 1 indicate minimum dissimilarity of codon usage between host and pathogen, hence better adaptation (Khandia et al., 2019).
2.11 Principal component analysis (PCA)
In PCA, each gene appeared as a 59-dimensional vector with a single codon for each dimension (one codon refers to one dimension, and methionine, tryptophan, and stop codons are omitted). PCA analysis was performed using the CodonW 1.4.4.
3 Results
3.1 Compositional analysis showed highest occurrence of nucleotide A
Compositional analysis showed that the HBoV genome had the highest nucleotide content for A (34.40%), followed by T (23.48%), C (21.57%), and G (20.53%). The occurrence of A nucleotide at the third position of the codon was the highest (34.34%), while the G nucleotide had the least occurrence at the same position (14.88%). The overall composition of different nucleotides might impact codon usage. The GC content was 42.11%. The GC content was highest and lowest for the first (48.18%) and third codon positions (32%). The first position of the codon is important because the change in codon makes a non-synonymous codon resulting in an altered amino acid. The alteration at the third base of a codon often results in synonymous codons, however the resultant amino acid is not altered. Fig. 1 shows the pie chart for the %GC content.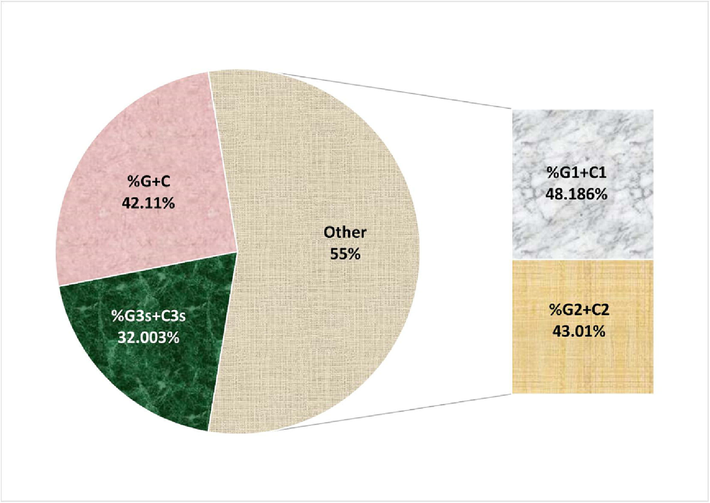
The pie chart for GC contents in coding sequences of HBoV at all three codon positions.
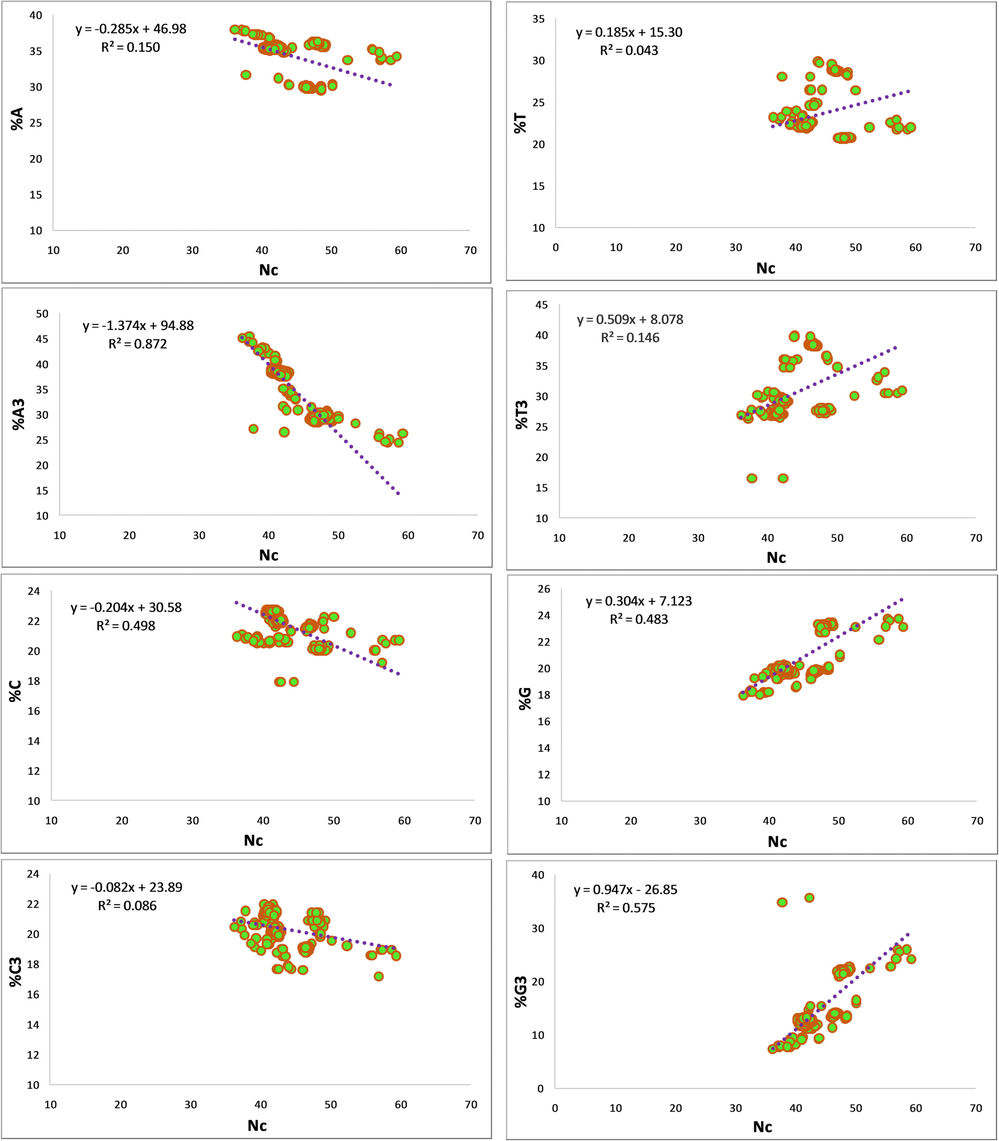
3.2 Compositional properties and gene expression are correlated
Statistically significant correlations were observed between CUB and different nucleotides. Table 1 shows the correlation between the various compositional parameters and Nc. Fig. 2 implies that the regression coefficient between Nc and nucleotides A, A3, C, and C3 is negative, while positive for T, T3, G, and G3. Because a high value of Nc indicates higher codon bias, it can be said that nucleotides A, C, T, T3, G, G3, GC, GC at non-neutral positions (GC1 and GC2) and GC3 affect CUB (Uddin and Chakraborty, 2019). Here *** P < 0.0001; ** P < 0.001; * P < 0.01; # P = 0.0001.
%A
%C
%T
%G
%A3
%C3
%T3
%G3
%G + C
%G1 + C1
%G2 + C2
%G3s + C3s
Nc
%A
*
***
***
***
***
***
#
***
***
***
***
***
%C
−0.0918
**
***
***
***
0.068792 (NS)
***
***
***
0.2021
(NS)***
***
%T
−0.9540
0.1226
***
***
***
***
***
***
***
***
***
***
%G
0.3185
−0.7561
−0.5095
***
***
***
***
***
***
***
***
***
%A3
0.5826
0.6670
−0.4252
−0.5563
***
***
***
***
***
***
***
***
%C3
0.6667
0.1915
−0.7849
0.3477
0.3921
***
***
***
***
***
***
***
%T3
−0.9102
−0.0642
0.9416
−0.3409
−0.5438
−0.8696
***
***
***
***
***
***
%G3
0.1340
−0.7605
−0.3263
0.9408
−0.6866
0.2404
−0.2298
***
***
***
***
***
%G + C
0.3898
−0.1432
−0.6479
0.7560
−0.1742
0.7172
−0.5797
0.6621
***
***
***
***
%G1 + C1
−0.6891
0.6639
0.7716
−0.8488
0.1534
−0.5432
0.6837
−0.7875
−0.6195
***
***
***
%G2 + C2
0.9075
0.0450
−0.9588
0.3933
0.5182
0.7821
−0.8862
0.1584
0.6397
−0.6185
***
***
%G3s + C3s
0.1990
−0.6719
−0.4113
0.9457
−0.6100
0.3820
−0.3320
0.9868
0.7581
−0.8066
0.2572
***
Nc
−0.3879
−0.7061
0.2087
0.6950
−0.9341
−0.2948
0.3829
0.7587
0.3448
−0.2991
−0.2847
0.6924
Regression analysis of ENc on compositional properties (%A, %T, %C, %G) and %GC3.
3.3 Regression analysis between compositional properties revealed highest contribution of T towards mutational force
A regression between the overall nucleotide component and component at the third codon place determined the impact of mutation. Among all nucleotides, nucleotide T contributed the maximum (62%) toward mutational force, while nucleotide C contributed the least (19%) [Fig. 3].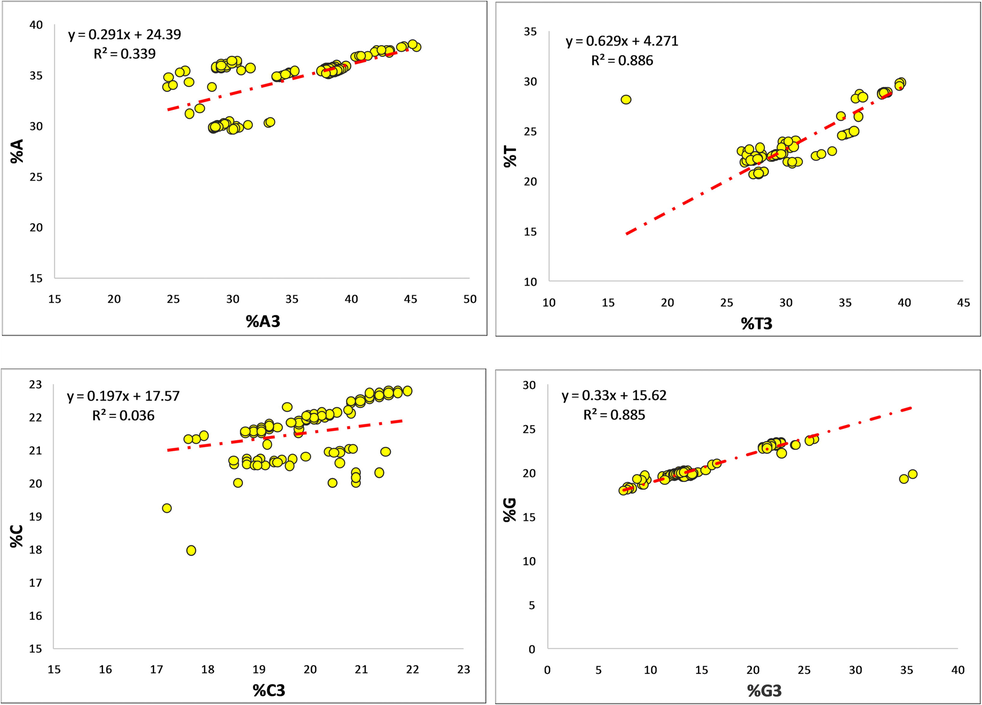
Regression analysis between %A-%A3, %T-%T3, %C-%C3, and %G-%G3.
3.4 Dinucleotide content is reflection of overall nucleotide composition
The OR of the 16 dinucleotide combinations was screened. Dinucleotide frequency has influence on codon usage (Khandia et al., 2019). At value 1, no bias was expected. In our study, the dinucleotide combinations CpC, CpG, GpC, and GpT were underrepresented (OR < 0.78), while ApA, ApC, and CpA were overrepresented (OR > 1.25). Generally, TpA dinucleotide is one of the most commonly represented dinucleotides; however, in the present study, the OR was 0.865, slightly above the value assigned for underrepresented dinucleotides. The ApA dinucleotide had the highest OR (1.921), possibly due to the highest proportion of nucleotide A in the genome, representing the ORs for all 16 dinucleotides (see Fig. 4).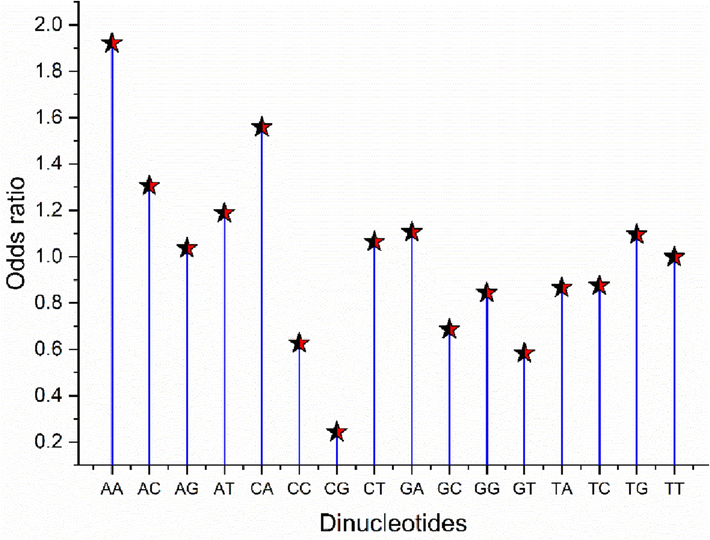
Odds ratio analysis for HBoV transcripts.
3.5 Codon bias influence gene expression level
Gene expressivity was predicted using MILC and MELP, two of the best indicators for estimating gene expressivity (Supek and Vlahoviček, 2005). The MELP values ranged between 1.439 and 4.749 (Supplementary Table S2), with a mean value of 1.857 ± 0.314, indicating the highest expressivity corresponding to the FJ8 gene (MELP = 4.749). In contrast, the GQ9 gene had the lowest gene expression (MELP = 1.439). Furthermore, a significant positive correlation between MELP and CBI (r = 0.543, P < 0.0001) and between MELP and GC3% (r = 0.452, P < 0.0001) indicated that gene expression is an imperative factor behind codon usage in Homo sapiens (Malakar et al., 2020).
3.6 T/A Ending codons are overrepresented
Based on RSCU values, nine codons were overrepresented, ending with either A or T. The AGA codon had the maximum average RSCU value (3.82), coding for Arg. In contrast, another codon for Arg, CGG, had the lowest RSCU (0.006). Nineteen codons were underrepresented with RSCU values less than 0.6; all were G/C ending except for TAT, TTA, CGT, and CGA. Fig. 5 shows the heat map for the RSCU values for codons (see Fig. 6).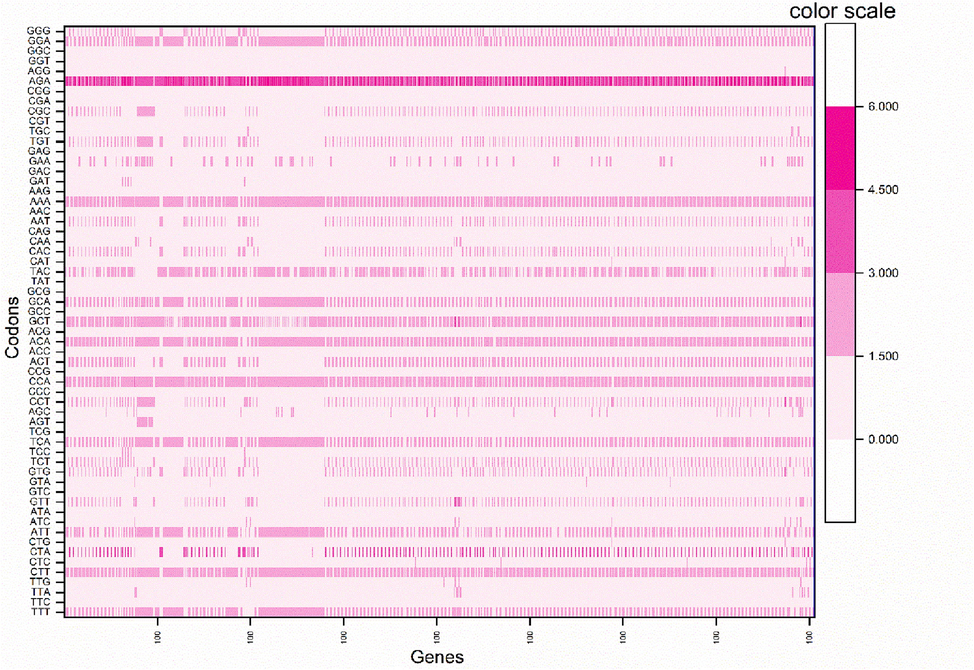
The heat map showing of RSCU values of HBoV codons.

The stacked chart of RSCU values for 18 amino acids.
The stacked chart for 18 amino acids corresponding to RSCU values, except for AUG (methionine) and TGG (tryptophan), showed different proportions of synonymous codon usage for individual amino acids (Fig. 7).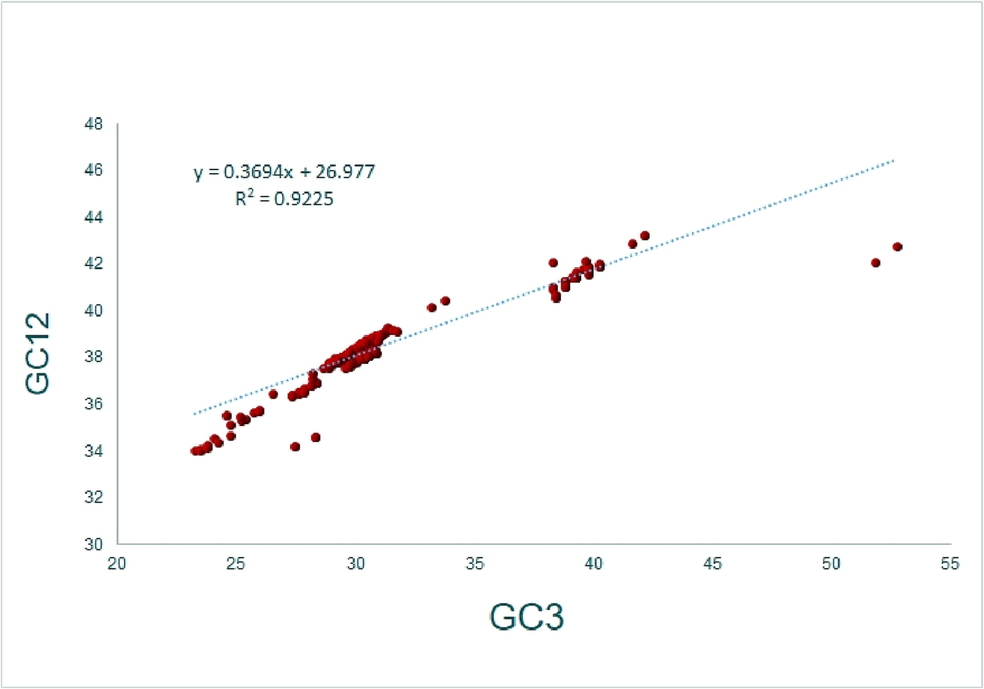
Neutrality plot analysis for the transcripts of HBoV.
3.7 The PR2 plot analysis
The PR2 plot analysis is performed to see the nucleotide skew at the third codon position. Our results indicate the average value of X = 0.529 ± 0.059 (AT bias) and y = 0.457 ± 0.058 (GC bias). As a result, T and G are preferred over their complementary bases.
3.8 Neutrality analysis, the tug of war between mutation and selection pressure
%GC12 and %GC3 (r = 0.959,p < 0.001) exhibited a positive correlation between them. Regression assessed the degree of directional and selection pressures. The linear regression exhibited (GC12%) = 0.369 (GC3%) + 26.97, with R2 = 0.922. These data indicated that 92.2%of the variance in %GC12 comes from %GC3, and therefore GC3 appears to be the major contributor to GC12 variance (Fig. 7). Here, the constant equilibrium ε was 36.9%, the contribution of mutation pressure was 36.9%, and the remaining (1-ε) was 63.1%, encompassing selectional constraints (Sueoka, 1988).
3.9 Nc-GC3 analysis revealed high influence of selection forces
The Nc-GC3 curve was used to determine whether mutational and other factors, such as selection or nucleotide compositional constraint, impact codon usage (Kumar et al., 2016). If only the compositional constraint is functional in shaping codon bias, all the points will appear on the expected Nc curve. Here, the GC3 value ranged from 57% to 26.9%, with an Nc value of 59.3 to 36.2%. Most of the data points in the Nc-GC3 curve in this investigation were below the curve (Fig. 8), suggesting the influence of selection pressure (Khandia et al., 2019).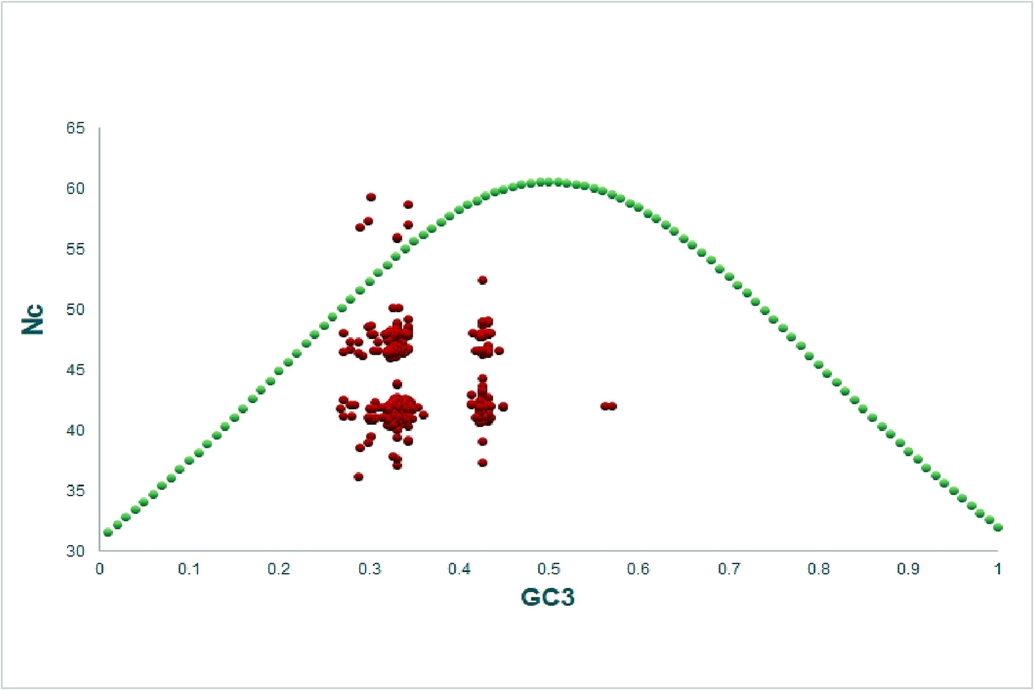
Nc-GC3 plot (selection curve) analysis. The presence of datapoints below the curve indicated the dominance of selection forces.
3.10 Intrinsic codon bias index (ICDI)
In instances when optimum codons are unknown, the ICDI is particularly useful for estimating codon bias (Rodríguez-Belmonte et al., 1996). An ICDI value is less than 0.3 is suggestive of a low level of bias (Freire-Picos et al., 1994). The mean ICDI value was 0.189 (Supplementary Table S2). In HBoV, the bias was found at a low level.
3.11 Codon bias index (CBI) revealed near random usage of codons
CBI is also a measure of bias in the gene. It indicates the extent of the favored codons utilized in a gene. The value also ranged between 0 and 1. A value of 0 implies that codons are chosen randomly, whereas 1 indicates that only preferred codons are utilized (Bennetzens and Hall, 1982). The value 0.0989 indicates a near-random choice of codons in the genome of HBoV (Supplementary Table S2).
3.12 Relative codon deoptimization index (RCDI)
It measures the similarity between codon frequencies of a specific virus gene to the desired host genome in the codon usage databases (Puigbò et al., 2010). The average RCDI value in the present study was 1.525 (Supplementary Table S2), indicating poor adaptation of HBoV in humans. It further predicts that the viral genome will be under translation in the host genome.
3.13 Translational selection (P2)
The P2 value is used to quantify the effectiveness of codon and anticodon interactions, as well as the translational efficiency of the gene (Bennetzens and Hall, 1982). Translational selection prevails over the mutation force in due course of evolution, as evidenced by the P2 value of 1.075.
3.14 PCA analysis
To understand the codon utilization pattern in HBoV strains, PCA was conducted, and the principal axes based on genes and codons were plotted between the first and second axes. The graph depicted in Fig. 9 (a) shows that the HBoV strains from different isolated countries are far away from the origin, and three clusters can be observed in different quadrants; Cluster I is the largest cluster in quadrant 1 and consists of the majority of strains from China, Greece, and Thailand; and the VP1 gene is dominant over all the other genes. Similarly, in Clusters II and III, VP2 and NS1 genes are dominant over all other genes, indicating the role of mutation pressure. The graph in Fig. 9(b) shows that all the codons are clustered near the origin except TCC, TTA, TCG, CGA, CCG, CGG, CCC AGG, and GCG (marked in red).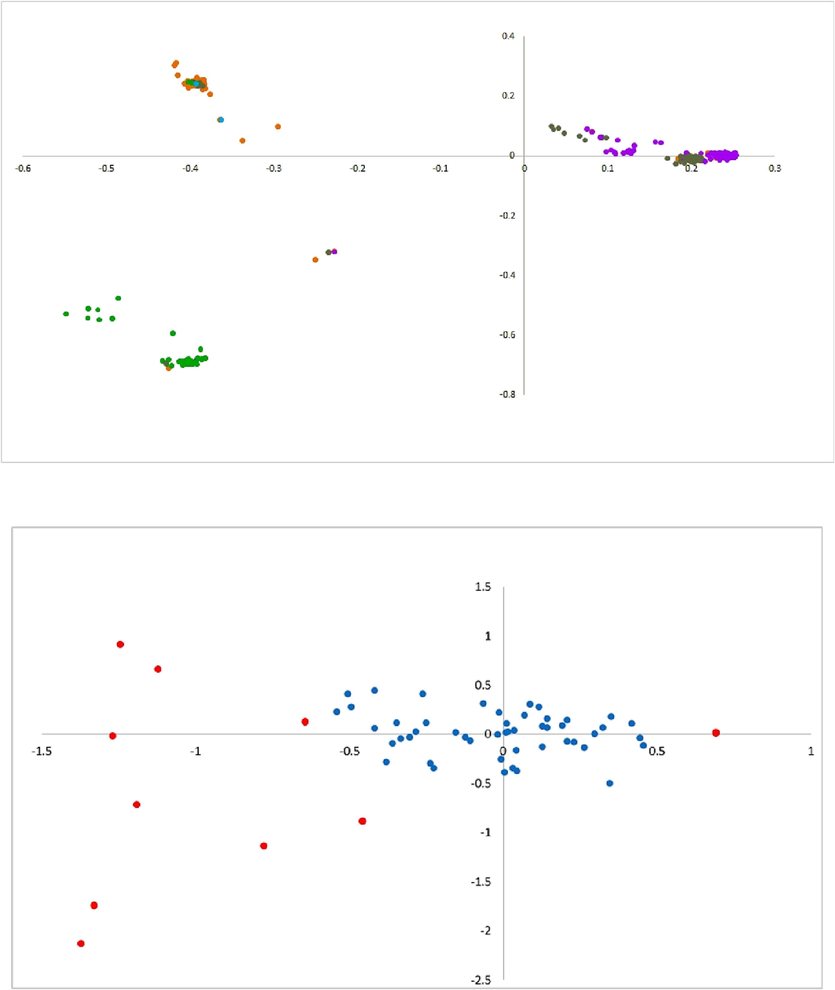
Principal component analysis of HBoV (a) Gene by axis: each point represents one HBoV transcript from a country. The HBoV strains from different isolated countries are far away from the origin(b) Codon by axis: all the codons are clustered near the origin except TCC, TTA, TCG, CGA, CCG, CGG, CCC AGG, and GCG (marked in red).
4 Discussion
Human bocavirus is a respiratory virus with pulmonary symptoms similar to SARS-CoV-2, and it requires extensive research since it may cause a threat to human health extensively. The present study envisaged codon usage for 805 HBoV genomes from different countries. The impact of compositional constraints was studied, revealing that composition affected the dinucleotide odds ratio and codon composition. In the present study, the HBoV sequences showed the richness of A and T content compared to G and C, and as a result, the ApA dinucleotide was the most overrepresented. An abundance of A and T nucleotides reflected in codon composition and corresponding RSCU values were obtained with the preference of T/A ending codons. A total of nine T/A ending codons were overrepresented, whereas nineteen G/C ending were underrepresented. Here codons TAT, TTA, CGT, and CGA were excluded since these contain CpG or TpA as a part of them.
Interestingly, among all amino acids, Arg is the only amino acid that has both maximum and minimum RSCU values among all codons AGA and CGG, respectively. The average RSCU value for AGA was 3.82, while for CGG, it was 0.006. Here it is noteworthy that the CTG codon, which is commonly an overrepresented codon owing to the transition of C to T nucleotide in methylated CpG dinucleotide that, upon deamination, gives rise to TpG dinucleotide(Khandia et al., 2022b, 2022c, 2021) in the present study is underrepresented with average RSCU value 0.657.
Nucleotide skew was evident in our study with the dominance of T and G at third codon positions. We may partially explain this phenomenon based on composition, but composition alone is unable to explain it thoroughly, and other yet undiscovered reasons might play a role.
Additionally, within the codon, nucleotide positions are important, as the changes in the first or second codons alter the synonymous codon to a non-synonymous codon, leading to changed amino acid (Lagerkvist, 1978); hence, in the study despite having low overall GC content, the highest GC content at the first codon position indicates that both composition and selection forces are vital in deciding codon usage in HBoV.
The nucleotide composition of any sequence can also affect the extent of gene expression. A correlation study was performed between Nc and different nucleotides to further understand the relationship between composition and gene expression. The presence of positive, negative, and no correlations between different nucleotides and Nc value exhibited the role of compositional parameters on codon bias. High Nc values indicate low codon bias; therefore, it can be inferred that nucleotides A, C, and GC at the first and second positions (non-neutral positions) also affect CUB (Uddin and Chakraborty, 2019). Additionally, a significant positive correlation between MELP and GC3% (r = 0.452, p < 0.0001) as well as between MELP and CBI (r = 0.543, P < 0.0001) inferred that with an increase in %GC3 content, there would be an increase gene expression of the coding sequences. Thus, there would ultimately be an increment in the CUB of the HBoV genome.
A similar result was reported in the codon usage study of the mammalian NKX-2.5 gene with a high positive correlation between MELP and GC3% (r = 0.977, P < 0.01), and between MELP and CBI (r = 0.647, P < 0.01), suggesting a direct relationship between codon bias and gene expression (Malakar et al., 2020). Furthermore, regression analysis to determine the significant force evolutionary force affecting codon usage revealed that the selection force was the dominant force compared to the mutational force and was maximum on nucleotide T.
Dinucleotide frequency affects CUB as it composes a genome signature for a particular organism. In the present study, CpC, CpG, GpC, and GpT dinucleotide frequencies were underrepresented, whereas ApA, ApC, and CpA were overrepresented. In many studies, TpA dinucleotide is frequently reported as an underrepresented dinucleotide. TpA dinucleotides are often depleted in various organisms (Munjal et al., 2020) owing to their higher susceptibility to cytoplasmic RNAses (Khandia et al., 2019), their mRNA destabilizing effects and structural part of two stops codons out of total three. Contrary to the existing notion, in the present study, TpA dinucleotides were not underrepresented (>0.78), possibly owing to the higher occurrences of A and T nucleotides in the genome. The highest abundance of ApA was also due to a similar reason.
CpG dinucleotide is the most underrepresented dinucleotide, with an OR of 0.24. This result is in concordance with the results of other studies that reported the underrepresentation of CpG dinucleotides. There are several plausible reasons for the depletion of CpG content, including a comparatively lower transcription rate for CpG-containing codons (Medvedeva et al., 2010), unmethylated CpG-mediated stimulation of Toll-like receptor-9 driven innate immune response (Chinnery et al., 2012) and deamination of methylated cytosine giving rise to T in CpG dinucleotides. In addition, it was observed in an experimental echovirus 7 model that upon artificially increasing the CpG/UpA dinucleotide frequency, the resulting virus exhibited attenuated replication (Fros et al., 2017).
In this study, a positive correlation between GC12% and GC3% had (r = 0.960, p < 0.001), suggested the presence of direction mutational forces at all the codon positions (Khandia et al., 2022a). A similar result was reported in a codon usage study of different genes of viruses of the Coronaviridae family, revealing a positive correlation between GC12% and GC3%, suggesting that natural selection might influence the CUB (Nyayanit et al., 2020), so it may be inferred that the correlation between %GC3 and %GC12 is a result of both selection and mutation. Based on neutrality plot analysis, and P2 analysis, it is inferred that selection pressure is vital in the HBoV genome (Kumar et al., 2016). Nc-GC3 plot also pointed to the same result, where data points below the expected Nc curve indicated a strong influence of selectional forces. To estimate the codon biasness (independent optimal codons) in the genomes of HBoV, ICDI analysis was performed, which showed a low level of bias, as was reported in the study of the genome of Kluyveromyceslactis (Freire-Picos et al., 1994). CBI analysis was performed to measure the gene expression level and degree of preferred codons used and suggested random choices or low bias of codons in the genome of HBoV.
RCDI is one parameter that measures the similarity between viruses and the host genome (Puigbò et al., 2010). Many studies have been conducted on the codon usage of viruses and their susceptible hosts, which report the mutual relationship between the virus and its host genome, to propose virus study models and vaccine candidates (Gurjar et al., 2023). In this study, RCDI indicated poor adaptation and translation of the HBoV genome in the host genome. Poor adaptation or, in other terms, poor replication rates in human hosts suggests low pathogenicity, which might be relieving for us. However, replication rates and pathogenicity are not always coupled. Some outliers are often present where low replication yet high pathogenicity and high replication but unaffected pathogenicity are observed resulting from the complex virus–host interactions (Furió et al., 2012). Therefore, RCDI determination may be further helpful in determining the host ranges for HBoV and detecting potential reservoirs of HBoVs.
5 Conclusion
In the present work, we studied 805 HBoV sequences, and the dominance of A and T nucleotides was reflected in odds ratio and RSCU values. Despite compositional constraints favoring A and T nucleotides, the highest G/C nucleotides at the first position (48.18%), while least at the third codon position (32%), is suggestive of the significance of selection and compositional factors in shaping codon usage in HBoV. The neutrality plot, Nc-GC3 curve, and P2 analysis further ascertain the significance of the selection force. Furthermore, the study provided insight into codon utilization patterns but also may impart to improve our understanding of the molecular signatures present in pathogens like HBoV and may help in designing effective gene delivery, expression, or vaccine candidates. The study will pave the way to determine the other host species possibly acting as a reservoir for HBoV, and identification of them will be a milestone in preventing the infections.
Author contribution
Conceptualization and execution- RK, SS, UK, AAK, MP, ANS, IVR, ROK, MNV, AR GEB, KD, ME; Writing and editing- RK, AAK, MP, SS, UK, AR, Statistical analysis- IVR, ROK, MNV, ANS, GEB, ME; Final editing- KD, ME. All authors read the manuscript and take the responsibility of the manuscript contents.
Acknowledgements
This work was funded by the Researchers Supporting Project Number (RSP2023R339) at King Saud University, Riyadh, Saudi Arabia.
Declaration of Competing Interest
The authors declare that they have no known competing financial interests or personal relationships that could have appeared to influence the work reported in this paper.
References
- Human Bocavirus infection and respiratory tract disease identified in a UK patient cohort. J. Clin. Virol.. 2020;129:104453
- [CrossRef] [Google Scholar]
- Clinical description of human bocavirus viremia in children with LRTI, Eastern Province, Saudi Arabia. Ann. Thorac. Med.. 2015;10:146
- [CrossRef] [Google Scholar]
- TLR9 ligand CpG-ODN applied to the injured mouse cornea elicits retinal inflammation. Am. J. Pathol.. 2012;180(1):209-220.
- [Google Scholar]
- Severe human bocavirus-associated pneumonia in adults at a referral hospital, Seoul, South Korea. Emerg. Infect. Dis.. 2021;27(1):226-228.
- [Google Scholar]
- Codon usage in Kluyveromyces lactis and in yeast cytochrome c-encoding genes. Gene. 1994;139:43-49.
- [CrossRef] [Google Scholar]
- CpG and UpA dinucleotides in both coding and non-coding regions of echovirus 7 inhibit replication initiation post-entry. Elife. 2017;6
- [CrossRef] [Google Scholar]
- Human bocavirus: a novel parvovirus epidemiologically associated with pneumonia requiring hospitalization in Thailand. J. Infect. Dis.. 2007;195(7):1038-1045.
- [Google Scholar]
- Relationship between within-host fitness and virulence in the vesicular stomatitis virus: correlation with partial decoupling. J. Virol.. 2012;86(22):12228-12236.
- [Google Scholar]
- Codon usage in bacteria: correlation with gene expressivity. Nucleic Acids Res.. 1982;10(22):7055-7074.
- [Google Scholar]
- Human metapneumovirus and human bocavirus associated with respiratory infection in Apulian population. Virology. 2011;417(1):64-70.
- [Google Scholar]
- Human bocavirus: Current knowledge and future challenges. World J. Gastroenterol.. 2016;22:8684
- [CrossRef] [Google Scholar]
- A synthetic biology approach for vaccine candidate Design against delta strain of SARS-CoV-2 revealed disruption of favored codon pair as a better strategy over using rare codons. Vaccines. 2023;11:487
- [CrossRef] [Google Scholar]
- Human bocavirus: clinical significance and implications. Curr. Opin. Pediatr.. 2008;20:62-66.
- [CrossRef] [Google Scholar]
- Analysis of nipah virus codon usage and adaptation to hosts. Front. Microbiol.. 2019;10:886
- [CrossRef] [Google Scholar]
- Genes common in primary immunodeficiencies and cancer display overrepresentation of codon CTG and dominant role of selection pressure in shaping codon usage. Biomedicines. 2021;9(8):1001
- [CrossRef] [Google Scholar]
- Codon usage analysis of pro-apoptotic bim gene isoforms. J. Alzheimers. Dis.. 2022;86:1711-1725.
- [CrossRef] [Google Scholar]
- Codon pattern and compositional constraints determination of genes associated with chronic periodontitis. Genes (Basel). 2022;13(11):1934
- [Google Scholar]
- Strong selectional forces fine-tune CpG content in genes involved in neurological disorders as revealed by codon usage patterns. Front. Neurosci.. 2022;16
- [CrossRef] [Google Scholar]
- Revelation of influencing factors in overall codon usage bias of equine influenza viruses. PLoS One. 2016;11:e0154376
- [CrossRef] [Google Scholar]
- “Two out of three”: an alternative method for codon reading. Proc. Natl. Acad. Sci. U. S. A.. 1978;75(4):1759-1762.
- [Google Scholar]
- Human bocavirus infection in adults: clinical features and radiological findings. Korean J. Radiol.. 2019;20:1226
- [CrossRef] [Google Scholar]
- Genetic evolution and codon usage analysis of NKX-2.5 gene governing heart development in some mammals. Genomics. 2020;112:1319-1329.
- [CrossRef] [Google Scholar]
- Intergenic, gene terminal, and intragenic CpG islands in the human genome. BMC Genomics. 2010;11:48
- [CrossRef] [Google Scholar]
- Mycobacterium lepromatosis genome exhibits unusually high CpG dinucleotide content and selection is key force in shaping codon usage. Infect. Genet. Evol.. 2020;84:104399
- [Google Scholar]
- Human Bocavirus infection markers in peripheral blood and stool samples of children with acute gastroenteritis. Viruses. 2018;10(11):639
- [Google Scholar]
- Natural selection plays an important role in shaping the codon usage of structural genes of the viruses belonging to the Coronaviridae family. Viruses 2021. 2020;13:3-13.
- [CrossRef] [Google Scholar]
- Full sequence analysis and characterization of human bocavirus type 2 in South Korea. Jundishapur J. Microbiol.. 2019;2019(124):12
- [CrossRef] [Google Scholar]
- RCDI/eRCDI: a web-server to estimate codon usage deoptimization. BMC Res. Notes. 2010;3:87
- [CrossRef] [Google Scholar]
- Human bocavirus types 1, 2 and 3 in acute gastroenteritis of childhood. Acta Paediatr.. 2012;101:e405
- [Google Scholar]
- PICDI, a simple program for codon bias calculation. Mol. Biotechnol.. 1996;5:191-195.
- [CrossRef] [Google Scholar]
- The codon Adaptation Index–a measure of directional synonymous codon usage bias, and its potential applications. Nucleic Acids Res.. 1987;15:1281-1295.
- [CrossRef] [Google Scholar]
- Frequency and characterization of ancillary chest CT findings in COVID-19 pneumonia. Br. J. Radiol.. 2021;94(1118):20200716
- [Google Scholar]
- Directional mutation pressure and neutral molecular evolution. Proc. Natl. Acad. Sci. U. S. A.. 1988;85(8):2653-2657.
- [Google Scholar]
- Impact of RSV coinfection on human bocavirus in children with acute respiratory infections. J. Trop. Pediatr.. 2019;65:342
- [CrossRef] [Google Scholar]
- Comparison of codon usage measures and their applicability in prediction of microbial gene expressivity. BMC Bioinf.. 2005;6:1-15.
- [CrossRef] [Google Scholar]
- Codon usage pattern of genes involved in central nervous system. Mol. Neurobiol.. 2019;56:1737-1748.
- [CrossRef] [Google Scholar]
Appendix A
Supplementary material
Supplementary data to this article can be found online at https://doi.org/10.1016/j.jksus.2023.102726.
Appendix A
Supplementary material
The following are the Supplementary data to this article:


