

Translate this page into:
Colorimetric detection of anionic surfactant using polydiacetylene/zinc (II)/zinc oxide nanocomposites with unique yellow-to-red color transition
⁎Corresponding author. rakchart.tra@mahidol.ac.th (Rakchart Traiphol),
⁎⁎Corresponding author at: Laboratory of Advanced Chromic Materials, Department of Materials Science, Faculty of Science, Chulalongkorn University, Bangkok 10300, Thailand. Nisanart.T@chula.ac.th (Nisanart Traiphol)
-
Received: ,
Accepted: ,
This article was originally published by Elsevier and was migrated to Scientific Scholar after the change of Publisher.
Abstract
Abstract
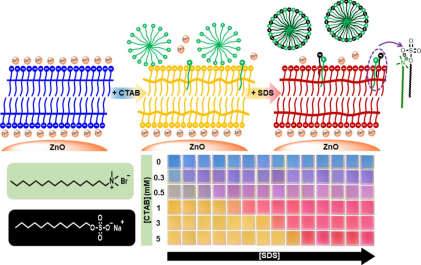
Colorimetric sensors of anionic surfactant using polydiacetylene/Zn2+/ZnO nanocomposites. Cetyltrimethylammonium bromide is incorporated into the nanocomposites to fabricate the sensors. Molecules of cetyltrimethylammonium bromide behave as binding sites for sodium dodecyl sulfate. Varying concentrations of cetyltrimethylammonium bromide allows for tuning the sensitivity of sensors. A simple procedure for colorimetric detection of anionic surfactants is introduced in this contribution.
Abstract
Polydiacetylenes (PDAs) have extensively received attention as colorimetric sensors because of their stimulus-responsive properties. This contribution presents a simple technique to modify polydiacetylene/zinc (II) ion/zinc oxide (PDA/Zn2+/ZnO) nanocomposites for colorimetric detection of an anionic surfactant. Incorporation of cetyltrimethylammonium bromide (CTAB) into the nanocomposite structure is achieved through a simple mixing process in an aqueous medium. Interestingly, the resultant PDA/Zn2+/ZnO-CTAB sensors exhibit a unique yellow-to-red color change in response to the anionic surfactant, sodium dodecyl sulfate (SDS). Furthermore, the colorimetric detection of SDS at different concentrations can be achieved by varying the added CTAB concentrations. The detectable concentration range of SDS in this study extends from 0.3 to 7 mM. Our study offers a simple and low-cost method to fabricate colorimetric sensors for anionic surfactant detection using PDA materials.
Keywords
Polydiacetylene
Colorimetric sensors
Cationic surfactant
Anionic surfactant sensors

1 Introduction
Anionic surfactants are widely utilized in industrial and household products. Once released into environment, their toxicity to aquatic organisms has been reported with lethal concentration fifty (LC50) between 10 and 100 mg/L. Techniques employed to monitor anionic surfactants often require multi-step assays and advanced instrumentation (Jozanović et al., 2021). Colorimetric sensing is the one for detecting anionic surfactants with simplicity and low cost. Development of the colorimetric sensing of anionic surfactants is summarized in Table S1 (supporting information). Selective detection of anionic surfactants based on color changing can be visually observed. Semi-quantitative analysis is also allowed through color intensity correlating with analyte concentration.
Polydiacetylene (PDA) is a class of color-responsive materials (Chae et al., 2016; Park et al., 2018). Applications include thermochromic sensors (Park et al., 2018; Phonchai et al., 2019; Traiphol et al., 2017; Yoon et al., 2009), acid-base sensors (Yimkaew et al., 2022), sensors for detecting volatile organic compounds (Park et al., 2018; Kingchok et al., 2022), milk spoilage detection (Yimkaew et al., 2022; Weston et al., 2020), UV-light sensors (Pankaew et al., 2021), and smart packaging (Nguyen et al., 2019). The capability to tune the PDA color-transition behaviors is necessary to achieve their full potential. Many researches have illustrated that PDA structural modifications and addition of foreign materials to PDAs can present intriguing properties (Chae et al., 2016; Park et al., 2018; Phonchai et al., 2019; Kingchok et al., 2022; Pankaew et al., 2021; Chanakul et al., 2016; Lee et al., 2011; Pankaew et al., 2022; Parambath et al., 2014; Park et al., 2016; Wang et al., 2016). Commercial PDAs with carboxylic headgroups do not show any colorimetric responses to anionic surfactants (Lee et al., 2011; Yimkaew et al., 2024). When the PDAs were modified with amine and/or ammonium moieties (Thongmalai et al., 2011) or synthesized to contain imidazolium headgroups, they showed color- and fluorescent-changing when exposed to anionic surfactants (Chen et al., 2010). These PDAs yielded high selectivity towards targeted molecules; however, complicated and time-consuming steps were involved.
Our research group alternatively manipulate the color-responsive behavior of PDAs by co-assembling with ZnO nanoparticles and Zn2+ ions, forming PDA/Zn2+/ZnO nanocomposites. The nanocomposites exhibit reversible thermochromism and dual colorimetric responses to acids and bases (Phonchai et al., 2019; Traiphol et al., 2017; Yimkaew et al., 2022; Chanakul et al., 2016). They can be formed using either polar or nonpolar solvents, illustrating their high color stability, and promising applications in detection of acids and bases in food products as well as smart paints/inks (Phonchai et al., 2019; Yimkaew et al., 2022). Recently, their applications have expanded as cationic surfactant sensors with tunable sensitivity (Yimkaew et al., 2024).
In this contribution, the colorimetric sensors based on PDA/Zn2+/ZnO nanocomposites are further developed for detecting the anionic surfactant, sodium dodecyl sulfate (SDS) (Fig. 1). The sensors are straightforwardly fabricated through incorporating cetyltrimethylammonium bromide (CTAB) into the PDA/Zn2+/ZnO nanocomposites dispersed in aqueous medium. Interestingly, the PDA/Zn2+/ZnO-CTAB sensors exhibit a unique colorimetric changing from yellow to red upon exposure to SDS. This type of colorimetric response has never been observed in any previous studies. Various CTAB concentrations can fine-tune the sensitivity of sensors.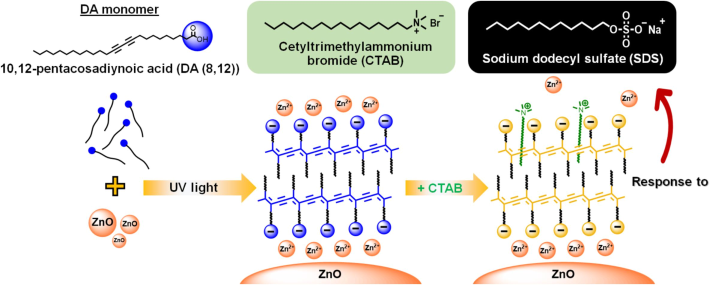
Chemical structures of DA(8,12) monomer, CTAB, and SDS. Illustration outlines preparation of PDA(8,12)/Zn2+/ZnO-CTAB sensors.
2 Experimental
2.1 Materials and sample preparation
The diacetylene (DA) monomer, 10,12-pentacosadiynoic acid (DA(8,12)), was obtained from Aldrich. The ZnO nanoparticles (Nano Materials Technology, Thailand) exhibited an average diameter of 65 nm (Chanakul et al., 2016). Cetyltrimethylammonium bromide (CTAB, AR grade) and sodium dodecyl sulfate (SDS, AR grade), were commercially available at Aldrich.
Conventional thin film hydration method (TFHM) were employing for synthesizing the PDA(8,12)/Zn2+/ZnO nanocomposites in aqueous solution (Traiphol et al., 2011). The concentration of DA(8,12) was 1 mM, while the ratio of ZnO/DA(8,12) was 10 wt%. The CTAB was dissolved in deionized water at concentrations of 0 to 10 mM and added to 10 mL nanocomposites using a micropipette. The mixed suspensions underwent sonication for 3 min, followed by incubation for 24 h at room temperature to facilitate system equilibrium. The SDS was prepared in deionized water at concentrations of 1 to 100 mM to be used as a stimulus. The SDS solution was slowly added to the nanocomposites containing CTAB using a micropipette. Following each addition, the samples were stirred and incubated for 1 min prior to measurements.
2.2 Characterization
The colorimetric responses of PDA(8,12)/Zn2+/ZnO-CTAB to SDS were examined utilizing a digital camera and a UV–vis spectrophotometer, LabTech BlueStar B model. The level of color change from yellow to red was determined by colorimetric response (%CR) calculated as follows: %CR = [(PY0 − PY)/PY0] x 100. The PY values were calculated from A515/(A515 + A540), where A515 and A540 were the absorbances of the yellow (Y) (λ = 515 nm) and red (R) (λ = 540 nm) phases, respectively. The PY0 value was initially assessed prior to being exposed to each stimulus.
The LS spectrometer (LS Instruments, Fribourg, Switzerland), composed of a laser light source (100 mW diode-pumped solid-state (DPSS) laser with a wavelength of 660 nm), a goniometer, and two avalanche photodiode detectors, was used to examine particle size distribution by 3D-dynamic light scattering (3D-DLS). Samples were loaded into cylindrical quartz cuvettes (5 mm diameter and 0.4 mm wall thickness). During the measurements, the cuvettes were immersed in a bath maintained at 25 °C, containing a refractive index-matching solvent (decalin). The particle size distributions were measured at a scattering angle of 90°. Three measurements of 30 s duration were taken. The resulting normalized intensity cross-correlation function g2(q, t) corresponds to the two scattering intensities. Data with outliers and artifacts were removed before further analysis. Here, t is the delay time, and q is the momentum transfer. The momentum transfer is given by
Fourier-transform infrared spectroscopy (FT-IR) (Thermo Scientific, Nicolet 6700) was employed to reveal local interactions. A Raman spectrometer (Horiba XploRA PLUS) with a 785 nm laser was set up with a liquid cell. The measurements in suspension form reveal the conformational changes of alkyl side chain and conjugated backbone of PDA during the color transition. Photographs were also captured to monitor the color transition.
3 Results and discussion
3.1 Colorimetric response to anionic surfactant
It has been known that the pure PDA(8,12) assemblies do not show any colorimetric responses to anionic surfactants due to the electrostatic repulsion between their headgroups (Su et al., 2005). In contrast, the color transition occurs when adding cationic surfactants to PDA(8,12) assemblies (Lee et al., 2011; Parambath et al., 2014; Wang et al., 2016). The headgroup of cationic surfactant binds to the negative-charged carboxylate headgroup, while its alkyl tail penetrates the hydrophobic layer of PDA(8,12) (Wang et al., 2016; Su et al., 2004). These perturbations induce segmental rearrangements, causing a change in conjugation length. In our studies, a simple approach of incorporating the CTAB into the PDA/Zn2+/ZnO nanocomposites was introduced to achieve polymer-responsive sensors in both non-polar and polar solvents (Pankaew et al., 2022; Pankaew et al., 2023). The primary color-transition mechanism relied on the interactions between the polymer functional groups and the CTAB positive-charged headgroups. This study further illustrates that incorporating CTAB into the PDA(8,12)/Zn2+/ZnO nanocomposites creates an anionic surfactant sensor. The positive-charged headgroups of CTAB are hypothesized to serve as binding sites for the negative-charged headgroups of SDS.
The PDA(8,12)/Zn2+/ZnO-CTAB exhibit colorimetric responses when exposed to the SDS, as shown in Fig. 2. For the pristine PDA(8,12)/Zn2+/ZnO and the PDA(8,12)/Zn2+/ZnO with 0.1 mM CTAB, the SDS addition barely affects the pattern of absorption (Fig. S1(a,b), supporting information). The incorporation of 0.3 mM CTAB into the nanocomposites causes the appearance of a new peak with λmax ∼ 515 nm, assigned to a yellow phase (Fig. 2a). This outcome indicates that some CTAB molecules infiltrate the nanocomposite structure, leading to a partial color transition from blue to yellow. The mechanism of CTAB perturbation was discussed in our recent study (Yimkaew et al., 2024). At this condition, however, the nanocomposite suspension still retains a blue appearance. Interestingly, this system exhibits a blue-to-purple color transition upon the addition of ∼ 0.3 mM SDS (Fig. 2d). The result shows the peak shifts from ∼ 515 nm (yellow phase) to ∼ 540 nm (red phase). The blue-phase peak at ∼ 640 nm remains at its original position. This result suggests that only the yellow phase is affected by the added anionic surfactant. The nanocomposites with 0.5 mM CTAB show a bluish-gray color, consistent with the increase of yellow-phase absorbance at ∼ 515 nm (Fig. S1c, supporting information). A transition to purple color is observed at a higher SDS concentration (∼0.5 mM).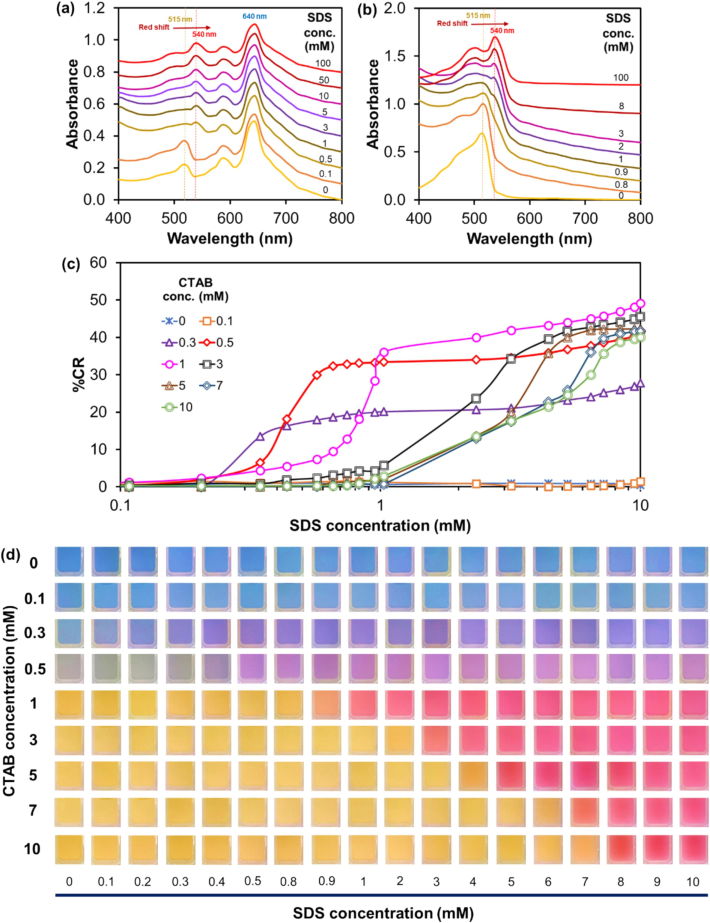
UV − Vis absorption spectra of PDA(8,12)/Zn2+/ZnO aqueous suspensions containing CTAB at (a) 0.3 and (b) 1 mM, measured after SDS addition. (c) Plot of %CR versus SDS concentration. (d) Photographs of PDA(8,12)/Zn2+/ZnO containing various concentrations of CTAB taken after SDS addition.
Incorporating 1 mM CTAB into the nanocomposites induces a complete color transition from blue to yellow. The absorption spectrum constitutes solely the peak of yellow phase (Fig. 2b). In this system, a unique color transition is found upon exposure to SDS. The addition of ∼ 1 mM SDS causes the color transition from yellow to red. The absorption peak shifts from ∼ 515 nm to ∼ 540 nm. To further investigate this phenomenon, the concentrations of CTAB are further increased to 3, 5, 7, and 10 mM. Although all these systems appear yellow, they change color at different SDS concentrations (Fig. 2d and Fig. S1, supporting information). The %CR of each system is plotted as a function of SDS concentration (Fig. 2c). Our findings demonstrate that the CTAB plays a significant role in regulating the color changing of PDA(8,12)/Zn2+/ZnO nanocomposites when exposed to the SDS. This tunable sensitivity could be employed for semi-quantitative analysis.
Interestingly, the colorimetric responses to SDS of the nanocomposite-CTAB sensors occur at approximately the same 1:1 (CTAB:SDS) mole ratios. In other words, the sensors with 0.3, 0.5, 1, 3, 5 and 7 mM CTAB illustrate the color transition at ∼0.3, 0.5, 1, 3, 5 and 7 mM SDS, respectively (Fig. 2d). For the nanocomposites containing 10 mM CTAB, the yellow-to-red transition occurs at ∼8 mM SDS. It has been known that CTAB and SDS can interact through an electrostatic interaction between the positively and negatively charged headgroups, which promotes the formation of hydrophobic tail structures (Alam et al., 2016; Cui et al., 2010). The different mole ratios of mixed surfactants in an aqueous medium can lead to different formations, including clear, translucent, turbid, and precipitates composed of mixed micelles, vesicles, and crystals (Mal et al., 2018; Tah et al., 2011). At a mole ratio of 1:1 (CTAB:SDS), stable vesicles and NaBr salt are formed (Rosen and Zhou, 2001). Hence, mixed (CTAB:SDS) surfactants can promote the existence of synergistic effects, leading to a possible explanation for how the nanocomposites change color. In this study, the CTAB molecules inserted within the nanocomposite structure are believed to serve as binding sites for the SDS. The color transition of the nanocomposite-CTAB sensors may arise from the CTAB-SDS interactions, leading to the rearrangement of PDA conjugated backbones. The color-transition mechanism is further investigated through various techniques in the following discussion.
3.2 Size distribution
Samples for conventional DLS measurements are often diluted to low particle concentrations to reduce non-negligible contributions from multiple scattering (Stetefeld et al., 2016). The decrease in concentration may inevitably affect the material structure. Using 3D-DLS, the samples in this study were directly measured in liquid phase without dilution to avoid a change in the micellization form of surfactants (Fig. 3a,b). The instrument is equipped with cross-correlation technology, which efficiently suppresses multiple scattered light sources and provides an advantage for measuring samples with high concentrations (Block and Scheffold, 2010). The Rh values measured as a function of CTAB and SDS concentrations are summarized in Table S2 (supporting information). The plots of the average Rh values versus CTAB and SDS concentrations are given in Fig. 3(c,d), respectively. The Rh value of pristine PDA(8,12)/Zn2+/ZnO nanocomposites is 165 ± 2 nm. The addition of 0.1 mM CTAB induces a slight increase of the Rh value to 192 ± 2 nm, suggesting that CTAB molecules swell and/or interact with the nanocomposites. However, in this condition, the absorption spectrum remains unchanged. The increase of CTAB concentration to 0.5 mM causes a drastic increase of the Rh value to 333 ± 4 nm. This value is approximately 2 times larger than that of the pristine nanocomposites. This result suggests the swelling and/or bridging of the nanocomposites. At this stage, a large fraction of the nanocomposites changes to a yellow phase. An increase in CTAB concentration to 1 mM results in a complete color transition to the yellow phase. The Rh value significantly increases to 454 ± 7 nm, indicating that a larger fraction of the nanocomposites form bridged structures.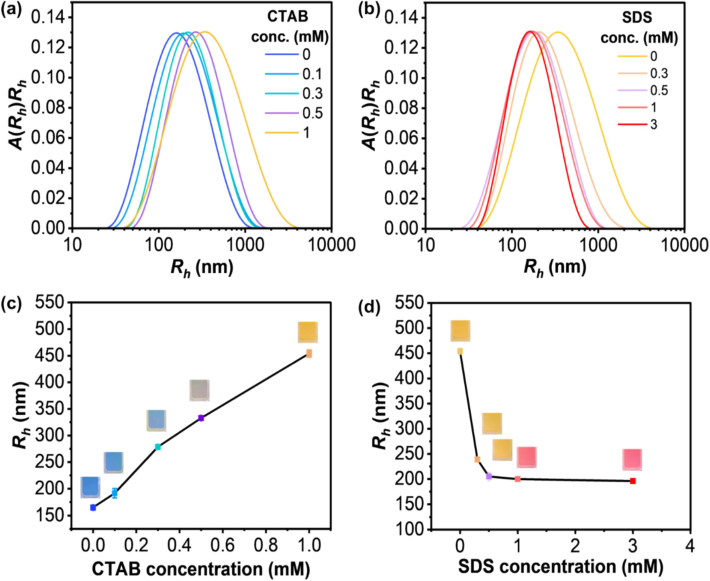
Particle size distributions of (a) PDA(8,12)/Zn2+/ZnO measured upon CTAB addition and (b) PDA(8,12)/Zn2+/ZnO with 1 mM CTAB measured upon an increase in SDS concentration. Plots of hydrodynamic radii (Rh) values as a function of (c) CTAB and (d) SDS concentration. Photographs of each condition are included.
For the PDA(8,12)/Zn2+/ZnO-1 mM CTAB sensor (Fig. 3b,d), the addition of 0.5 mM SDS results in the decrease of Rh value from 454 ± 7 nm to 205 ± 9 nm. At this condition, it is believed that some SDS and CTAB molecules bind, breaking the bridges between the nanocomposites. However, the nanocomposite-CTAB sensor remains yellow. Increasing the SDS concentration to 1 mM causes a complete yellow-to-red transition. The Rh value slightly decreases to 200 ± 1 nm. The SDS molecules are thought to bind with the CTAB inserted within the nanocomposites, resulting in conjugated backbone rearrangement (i.e., color transition).
3.3 Local interactions and conformational changes
The local interactions in the PDA(8,12)/Zn2+/ZnO nanocomposites are examined after adding CTAB (yellow-phase) and SDS (red-phase), respectively. As illustrated in Fig. 4 and Fig. S2 (supporting information), the FT-IR spectrum of pristine nanocomposites illustrates the frequencies of vibration in alkyl segments, νas(CH3), νas(CH2), and νs(CH2), at 2958, 2919, and 2849 cm−1, respectively. The scissoring vibrations of δ(CH2), methylene, are found at approximately 1470 to 1420 cm−1. The Zn2+-coordinated carboxylate headgroups exhibit stretching vibrations of antisymmetric (νas(–COO-)) and symmetric (νs(–COO-)) modes as sharp peaks at 1540 and 1398 cm−1, respectively (Phonchai et al., 2019; Traiphol et al., 2017; Yimkaew et al., 2022). Fig. S2 (supporting information) displays the FT-IR spectra of pure CTAB and PDA(8,12)/Zn2+/ZnO containing 1 mM CTAB. The CTAB spectrum comprises the peaks at 3016, 2918, and 2848 cm−1, which correspond to the C–H stretching vibrations of methyl and methylene groups. The peaks at approximate 1500 to 1400 cm−1, are attributed to the bending vibration of C–H groups (Gökce and Bahçeli, 2013). Upon adding 1 mM CTAB to the nanocomposites, a yellow phase is observed. The 1540 cm−1 peak disappears. This result indicates that the coordination between the carboxylate headgroups of PDA and Zn2+ ions is disrupted by the presence of CTAB, leading to the rearrangement of segments in the nanocomposites.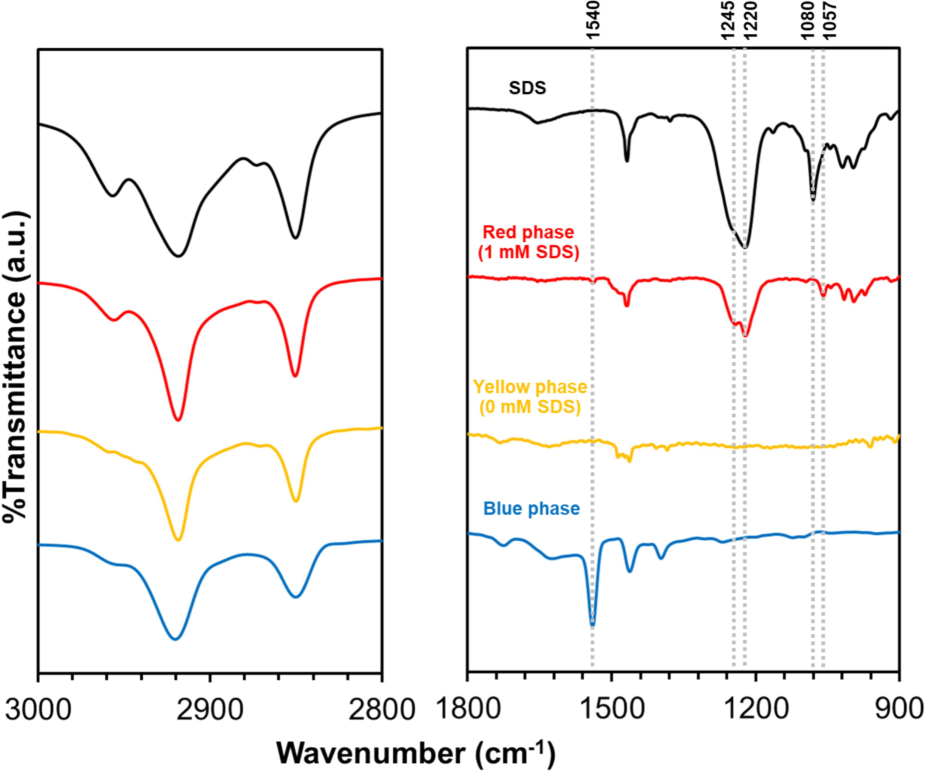
FT-IR spectra (bottom to top) of blue-phase PDA(8,12)/Zn2+/ZnO nanocomposites, yellow-phase PDA(8,12)/Zn2+/ZnO-1 mM CTAB, red-phase PDA(8,12)/Zn2+/ZnO-1 mM CTAB with addition of 1 mM SDS, and pure SDS. (For interpretation of the references to color in this figure legend, the reader is referred to the web version of this article.)
The local interactions of PDA(8,12)/Zn2+/ZnO-CTAB are further examined after adding SDS (Fig. 4). The FT-IR spectrum of SDS demonstrates the peaks at 1220 and 1080 cm−1, which are characteristic of S–O stretching vibrations from the sulfate group and SO3 stretching, respectively. The peaks at 2959, 2916, 2849, and 1469 cm−1 indicate methyl and methylene groups, corresponding to the C–H stretching vibrations. The νas(CH2) of the C–H bending is observed at ∼1000-500 cm−1 (Muhamad et al., 2015). Adding 1 mM SDS to the PDA(8,12)/Zn2+/ZnO-CTAB results in a color transition from yellow to red. The sulfate peak shows the split of a shoulder peak at 1245 cm−1 and a red shift in vibrational wavenumber from 1080 to 1057 cm−1. This FT-IR result suggests the interactions between headgroups of CTAB and SDS, causing the segmental rearrangement of PDA structure. Furthermore, the growth of a small peak at 1540 cm−1 is detected. The pairing between SDS and CTAB may allow some Zn2+-coordinated carboxylate headgroups to reform in the nanocomposites.
Raman spectra of the PDA(8,12)/Zn2+/ZnO suspensions obtained after adding CTAB and SDS are shown in Fig. 5 and Fig. 6, respectively. The blue-phase PDAs exhibit C≡C and C = C bond stretching in the conjugated backbone, with peaks around ∼2080 and ∼1450 cm−1, respectively (Park et al., 2016; Potai et al., 2018). The sharp characteristic peaks, ranging from 1150 to 1000 cm−1, also correspond to the all-trans conformation of alkyl side chains. (Phonchai et al., 2019; Park et al., 2016). The Raman spectrum of pristine PDA(8,12)/Zn2+/ZnO shows strong peaks at 2069 and 1442 cm−1, corresponding to the C≡C and C = C stretching modes of PDA conjugated backbone, respectively. The addition of 1 mM CTAB to the nanocomposites causes a blue-to-yellow transition. A growth of small peaks at 2111 and 1509 cm−1 is detected (Fig. 5a), reflecting the rearrangement of some C≡C and C = C bonds to new local environments. The spectral deconvolution of Raman peaks is also performed using the Lorentz function (Fig. 5b and Fig. S3 (supporting information)). The peak intensity ratios at 2111/2069 and 1509/1442 cm−1 are plotted as a function of CTAB concentrations (Fig. 5c and 5d). Increasing the concentration of CTAB from 1 to 10 mM causes a systematic increase of peak ratios, indicating an increase in the magnitude of backbone rearrangement. It is noted that these samples are yellow. However, the peaks originally at ∼ 2069 and ∼ 1442 cm−1 are the most dominant. Therefore, a large fraction of the PDA conjugated backbone remains in their original state.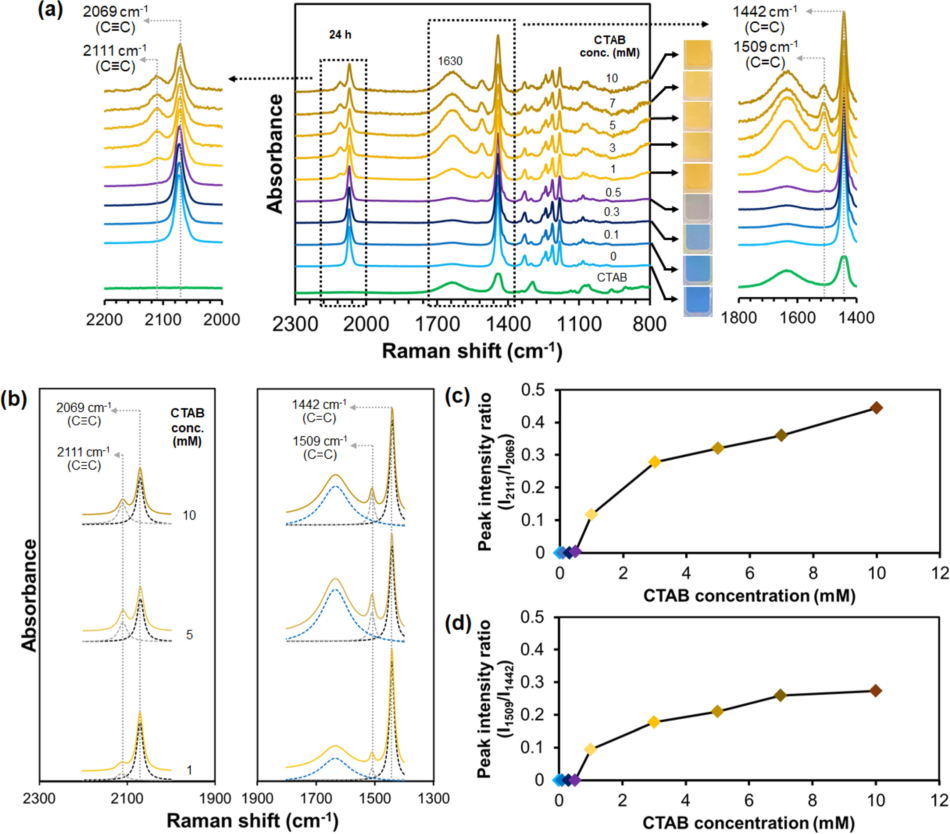
(a) Raman spectra of PDA(8,12)/Zn2+/ZnO measured upon increasing CTAB concentrations. (right) Expanded 1800–1400 cm−1 and (left) 2200–2000 cm−1 regions. CTAB spectrum is included for comparison. Photographs of suspensions for each condition are included. A broad peak at ∼ 1630 cm−1 is attributed to scattering of water molecules. (b) Lorentz deconvolution function bands of expanded regions of the Raman spectra upon addition of 1, 5, and 10 mM CTAB. Plots of peak intensity ratios at (c) 2111/2069 and (d) 1509/1442 cm−1 versus CTAB concentration.
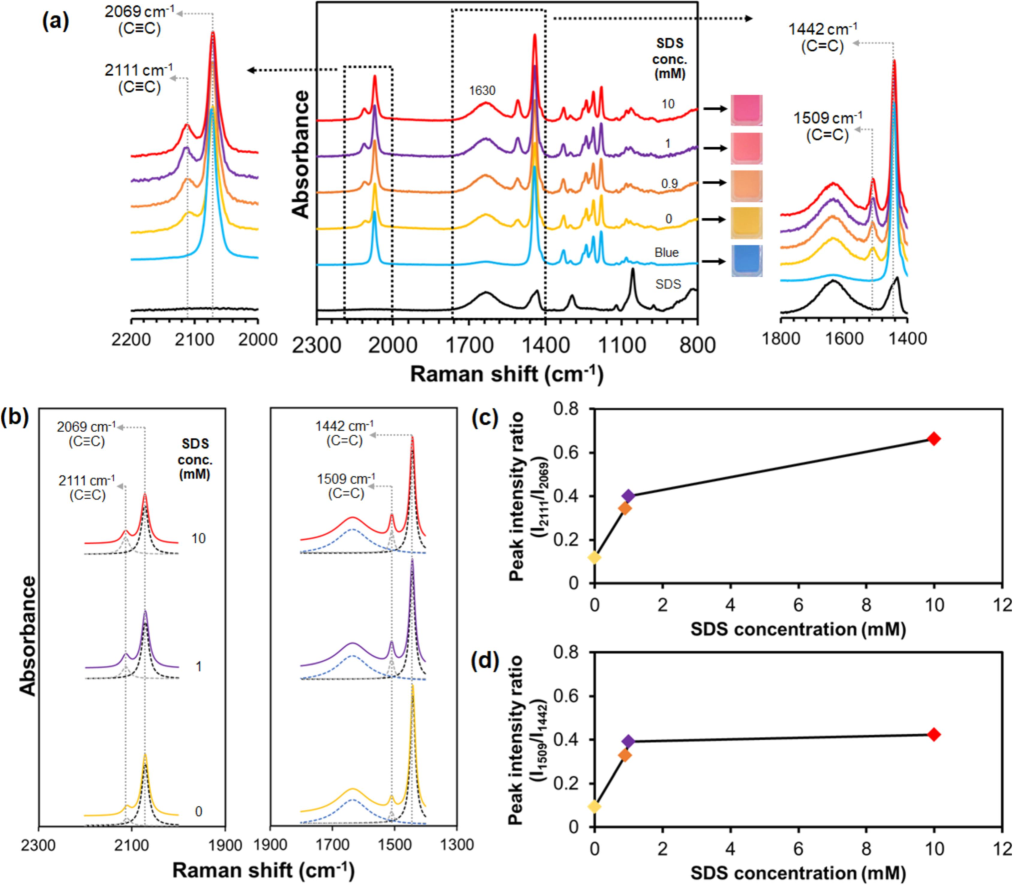
(a) Raman spectra of PDA(8,12)/Zn2+/ZnO-1 mM CTAB measured upon increasing SDS concentrations. (right) Expanded 1800–1400 cm−1 and (left) 2200–2000 cm−1 regions. SDS spectrum is included for comparison. Photographs of suspensions for each condition are included. A broad peak at ∼ 1630 cm−1 is attributed to scattering of water molecules. (b) Lorentz deconvolution function bands of expanded regions of the Raman spectra upon addition 0, 1, and 10 mM SDS. Plots of peak intensity ratios at (c) 2111/2069 and (d) 1509/1442 cm−1 versus SDS concentration.
The SDS addition to PDA(8,12)/Zn2+/ZnO-CTAB induces a yellow-to-red transition. Although the red phase is formed, no new peaks are detected in the Raman spectra. Instead, increasing the SDS concentration from 0 to 10 mM leads to the continuing growth of Raman peaks at ∼ 2111 and ∼ 1509 cm−1 (Fig. 6a). The spectral deconvolution shows that these peaks remain at the same position (Fig. 6b and Fig. S4 (supporting information)). The plots of peak intensity ratios at 2111/2069 and 1509/1442 cm−1 versus SDS concentrations (Fig. 6(c,d)) indicate that the addition of SDS to PDA(8,12)/Zn2+/ZnO-CTAB sensor causes an increase in PDA backbone rearrangement.
The color-transition mechanism of a new anionic surfactant sensor, PDA/Zn2+/ZnO-CTAB, is proposed in Fig. 7. As discussed in our previous study, the surface charge interactions and the alkyl tail insertion into the PDA layer cause the color changing of PDA/Zn2+/ZnO from blue to yellow upon adding the CTAB (Yimkaew et al., 2024). These disturbances cause a partial distortion in π-orbitals, resulting in a decrease in the conjugation length of the PDA backbone. The increase in particle size detected by 3D-DLS in the previous section suggests that the nanocomposite particles are possibly linked by the CTAB molecules and/or micelles. The PDA/Zn2+/ZnO-CTAB sensors show a yellow-to-red transition upon exposure to the SDS. Since the particle size drastically decreases prior to the color transition (Fig. 3d), the hypothesis is that the SDS added at an early stage interact with the CTAB, possibly forming the mixed micelles. This process weakens the interactions between the nanocomposites and eventually breaks the CTAB bridges (i.e., decrease in particle size). The equimolar ratio of CTAB:SDS (1:1 mol ratio) in the mixed surfactant system generally consists of vesicles with a minor presence of other assemblies. At a later stage, the added SDS molecules interact with CTAB binding sites in the nanocomposite structure, inducing PDA segmental rearrangement and hence the yellow-to-red color transition. Therefore, a higher concentration of SDS is required to induce the color transition of PDA/Zn2+/ZnO-CTAB sensors with a higher concentration of CTAB. However, further study is necessary to fully understand the origin of this behavior.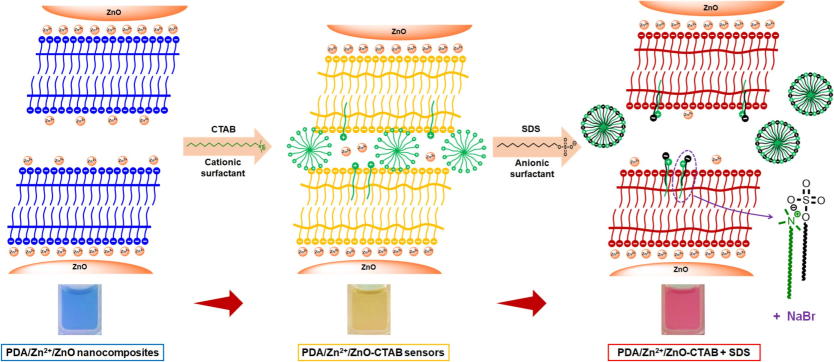
Proposed color transition mechanism of PDA/Zn2+/ZnO-CTAB sensors upon addition of an anionic surfactant, SDS. Schematics illustrate interactions between CTAB and SDS at outer layer of the nanocomposites.
4 Conclusion
Our study presents a simple method to create SDS-responsive sensors by incorporating the molecules of CTAB into PDA(8,12)/Zn2+/ZnO nanocomposites. The CTAB plays a significant role in regulating the color-transition behaviors of PDA materials, facilitating the colorimetric detection of SDS at various concentrations. Our findings demonstrate that the tunable sensitivity of nanocomposites enables semi-quantitative SDS analysis. A key mechanism of the color transition is the perturbations caused by the interaction between CTAB and SDS, which induce segmental rearrangement within the PDA structure. The change in particle size and the disturbance in the outer layer of nanocomposites reveal a possible mechanism for color transition within the nanocomposites. Furthermore, the conjugated backbone within the nanocomposites partially relaxes upon exposure to CTAB and SDS molecules. This study extends the applications of PDA/Zn2+/ZnO nanocomposites in the field of anionic surfactant sensors. The fabrication of these sensors is rather straightforward and cost-effective, which is favorable for production on a large scale.
CRediT authorship contribution statement
Watsapon Yimkaew: Writing – original draft, Visualization, Methodology, Investigation. Johannes Allwang: Methodology. Christine M. Papadakis: Formal analysis. Rakchart Traiphol: Writing – review & editing, Funding acquisition, Formal analysis, Conceptualization. Nisanart Traiphol: Writing – review & editing, Funding acquisition, Formal analysis, Conceptualization.
Acknowledgments
Funding for this study is provided by the Thailand Science Research and Innovation Fund at Chulalongkorn University. W. Yimkaew expresses his gratitude to the Royal Golden Jubilee Ph.D. program for providing support for his Ph.D. scholarship (PHD/0193/2559). Authors appreciate the instrumentation support provided by Mahidol University-Frontier Research Facility (MU-FRF). Authors thank Soft Matter Physics Group, Physics Department, Technical University of Munich, Germany, for their kind assistance in the operation of 3D-DLS.
Declaration of competing interest
The authors declare that they have no known competing financial interests or personal relationships that could have appeared to influence the work reported in this paper.
References
- The self-association and mixed micellization of an anionic surfactant, sodium dodecyl sulfate, and a cationic surfactant, cetyltrimethylammonium bromide: conductometric, dye solubilization, and surface tension studies. J. Dispers. Sci. Technol.. 2016;37(11):1645-1654.
- [CrossRef] [Google Scholar]
- Papadakis, C. M. 2024. Aggregation Behavior and Inner Structure of Nanoparticles from Trypsin and Chondroitin Sulfate in a Wide pH Range–Implications for the Design of Biocompatible Nanocarriers. ACS Appl. Nano Mater. Doi: 10.1021/acsanm.3c03826.
- Modulated 3D cross-correlation light scattering: Improving turbid sample characterization. Rev. Sci. Instrum.. 2010;81(12):123107
- [CrossRef] [Google Scholar]
- Mechanically drawable thermochromic and mechanothermochromic polydiacetylene sensors. Adv. Funct. Mater.. 2016;26(11):1769-1776.
- [CrossRef] [Google Scholar]
- Colorimetric sensing of various organic acids by using polydiacetylene/zinc oxide nanocomposites: Effects of polydiacetylene and acid structures. Colloids Surf. A Physicochem. Eng. Asp.. 2016;489:9-18.
- [CrossRef] [Google Scholar]
- Thin‐film formation of imidazolium‐based conjugated polydiacetylenes and their application for sensing anionic surfactants. Angew. Chem. Int. Ed.. 2010;49(8):1422-1425.
- [CrossRef] [Google Scholar]
- Mechanism of the mixed surfactant micelle formation. J. Phys. Chem. b.. 2010;114(23):7808-7816.
- [CrossRef] [Google Scholar]
- The molecular structures, vibrational spectroscopies (FT-IR and Raman) and quantum chemical calculations of n-alkyltrimethylammonium bromides. Opt. Spectrosc.. 2013;115(5):632-644.
- [CrossRef] [Google Scholar]
- Regularized positive exponential sum (REPES) program-A way of inverting laplace transform data obtained by dynamic light scattering. Collect. Czechoslov. Chem. Commun.. 1995;60(11):1781-1797.
- [CrossRef] [Google Scholar]
- Potentiometric sensors for the determination of anionic surfactants–a review. Crit. Rev. Anal. Chem.. 2021;51(2):115-137.
- [CrossRef] [Google Scholar]
- Polydiacetylene-Na+ Nanoribbons for Naked Eye Detection of Hydrogen Chloride Gas. ACS Appl. Nano Mater.. 2022;5(3):4146-4156.
- [CrossRef] [Google Scholar]
- Micellar Solutions of PMMA-b-PNIPAM in Water/Methanol Mixtures: Effect of Temperature on the Micellar Size, Core–shell Structure, and Interaction. Macromolecules.. 2023;56(21):8980-8992.
- [CrossRef] [Google Scholar]
- Diverse colorimetric changes of polydiacetylenes with cationic surfactants and their mechanistic studies. J. Mater. Chem.. 2011;21(43):17160-17166.
- [CrossRef] [Google Scholar]
- Physicochemistry of CTAB-SDS interacted catanionic micelle-vesicle forming system: An extended exploration. Colloids Surf. A Physicochem. Eng. Asp.. 2018;553:633-644.
- [CrossRef] [Google Scholar]
- Surface modification of SiO2 nanoparticles and its impact on the properties of PES-based hollow fiber membrane. RSC Adv.. 2015;5(72):58644-58654.
- [CrossRef] [Google Scholar]
- Polydiacetylene-based sensors to detect food spoilage at low temperatures. J. Mater. Chem. c.. 2019;7(7):1919-1926.
- [CrossRef] [Google Scholar]
- Tuning the sensitivity of polydiacetylene-based colorimetric sensors to UV light and cationic surfactant by co-assembling with various polymers. Colloids Surf. A Physicochem. Eng. Asp.. 2021;608:125626
- [CrossRef] [Google Scholar]
- Colorimetric detection of poly (methyl methacrylate) using polydiacetylene/zinc (II)/zinc oxide nanocomposites. J. Ind. Eng. Chem.. 2022;111:519-529.
- [CrossRef] [Google Scholar]
- Colorimetric sensors of poly (acrylic acid) and poly (4-styrenesulfonic acid) using polydiacetylene/zinc (II)/zinc oxide nanocomposites. J. Mater. Sci.. 2023;58:10389-10403.
- [CrossRef] [Google Scholar]
- Poly (methyl methacrylate)-supported polydiacetylene films: unique chromatic transitions and molecular sensing. ACS Appl. Mater. Interfaces.. 2014;6(11):8613-8620.
- [CrossRef] [Google Scholar]
- Smartphone-based VOC sensor using colorimetric polydiacetylenes. ACS Appl. Mater. Interfaces.. 2018;10(5):5014-5021.
- [CrossRef] [Google Scholar]
- Low-temperature reversible thermochromic polydiacetylene/zinc (II)/zinc oxide nanocomposites for colorimetric sensing. ACS Appl. Nano Mater.. 2019;2(7):4489-4498.
- [CrossRef] [Google Scholar]
- Controllable thermochromic and phase transition behaviors of polydiacetylene/zinc (II) ion/zinc oxide nanocomposites via photopolymerization: An insight into the molecular level. Colloids Surf. A Physicochem. Eng. Asp.. 2018;555:27-36.
- [CrossRef] [Google Scholar]
- Surfactant− surfactant interactions in mixed monolayer and mixed micelle formation. Langmuir.. 2001;17(12):3532-3537.
- [CrossRef] [Google Scholar]
- Dynamic light scattering: a practical guide and applications in biomedical sciences. Biophys. Rev.. 2016;8:409-427.
- [CrossRef] [Google Scholar]
- Effect of amphiphilic molecules upon chromatic transitions of polydiacetylene vesicles in aqueous solutions. Colloids Surf. b.. 2004;39(3):113-118.
- [CrossRef] [Google Scholar]
- A study on the interactions of surfactants with phospholipid/polydiacetylene vesicles in aqueous solutions. Colloids Surf. A Physicochem. Eng. Asp.. 2005;257:25-30.
- [CrossRef] [Google Scholar]
- Aggregation behavior of SDS/CTAB catanionic surfactant mixture in aqueous solution and at the air/water interface. J. Phys. Chem. b.. 2011;115(26):8493-8499.
- [CrossRef] [Google Scholar]
- Polydiacetylenes carrying amino groups for colorimetric detection and identification of anionic surfactants. J. Mater. Chem.. 2011;21(41):16391-16397.
- [CrossRef] [Google Scholar]
- Stable polydiacetylene/ZnO nanocomposites with two-steps reversible and irreversible thermochromism: The influence of strong surface anchoring. J. Colloid Interface Sci.. 2011;356(2):481-489.
- [CrossRef] [Google Scholar]
- Role of Zn2+ ion on the formation of reversible thermochromic polydiacetylene/zinc oxide nanocomposites. Thin Solid Films.. 2017;622:122-129.
- [CrossRef] [Google Scholar]
- Wang, E., D., Zhao, L., Yuan, M. S., Chen, S. W., Li, T., Wang, J. 2016. Fabrication of polydiacetylene liposome chemosensor with enhanced fluorescent self-amplification and its application for selective detection of cationic surfactants. ACS Appl. Mater. Interfaces. 8(41), 28231-28240. Doi: 10.1021/acsami.6b10794.
- Polydiacetylene for the Detection of α-Hemolysin in Milk toward the Diagnosis of Bovine Mastitis. ACS Appl. Polym. Mater.. 2020;2(11):5238-5248.
- [CrossRef] [Google Scholar]
- Colorimetric detection of acid-base in organic solvents, water, and food products using polydiacetylene/Zn2+/ZnO nanocomposites with tunable sensitivity. Colloids Surf. A Physicochem. Eng. Asp.. 2022;652:129856
- [CrossRef] [Google Scholar]
- Polydiacetylene/Zn2+/ZnO nanocomposites for colorimetric detection of cationic surfactants: Effects of ZnO ratios, solvents, and stimuli structures. J. Ind. Eng. Chem.. 2024;129:531-543.
- [CrossRef] [Google Scholar]
- Recent conceptual and technological advances in polydiacetylene-based supramolecular chemosensors. Chem. Soc. Rev.. 2009;38(7):1958-1968.
- [CrossRef] [Google Scholar]
Appendix A
Supplementary data
Supplementary data to this article can be found online at https://doi.org/10.1016/j.jksus.2024.103557.
Appendix A
Supplementary data
The following are the Supplementary data to this article:


