

An integrated hydrological and hydraulic modelling approach for flash flood hazard assessment in eastern Makkah city, Saudi Arabia
⁎Corresponding author at: Department of Environmental Engineering, Umm Al-Qura University, Makkah, Saudi Arabia. agothman@uqu.edu.sa (Abdullah Othman)
-
Received: ,
Accepted: ,
This article was originally published by Elsevier and was migrated to Scientific Scholar after the change of Publisher.
Peer review under responsibility of King Saud University.
Abstract
Flash floods are among the most destructive natural disasters with associated adverse impacts on society and the environment. The present study assesses the adverse impacts of flash floods within the Wadi Mehassar basin on the holy sites (i.e., Al Mashaaer Al Muqaddassa) and urban areas, east of Makkah city, which are highly vulnerable to flash floods especially during short duration high intensity rainfall. The difficulty associated with assessing the flash flood hazards in the study area is attributed to the rapid alterations in topography with accelerated urban development and the lack of hydrometric stations to gauge the surface runoff. Thus, in order to achieve the goals of the study, The ArcGIS 10.4, ERDAS Imagine 2015, and the Watershed Modelling System WMS 11.0 were used to process geological and hydrological data and prepare the modelling inputs such as geological, metrological and hydrological groups of the drainage basins under examination. Moreover, a mathematical hydrologic model (HEC-1), was applied to produce the hydrograph curves of the Wadi Mehassar basin, based on the synthetic unit hydrograph of the Soil Conservation Service (SCS-UH). The two-dimensional hydraulic modelling (HEC-RAS 5.0.7) software was employed, to calculate and simulate the water surface elevations, flow velocities, flow depths and spread of the flash flood, in order to develop the hazard rating map of flash flood inundation. The model results identified 44% of total area as liable to flash floods, and out of which 5.4% indicated high risk, 13.3% showed medium risk and the remaining 81.3% area fell under low risk of flash flooding.
Keywords
Geoinformatics
Hydrology
Hydraulic model
Flash Flood
Geohazard
Makkah

1 Introduction
The urban encroachment on the natural cover of land and the anthropogenic-induced land use and land cover changes result in significant modifications of the hydrological behavior of basins and lead to a substantial increase in the total amount of runoff and its maximum flow (Dewan and Yamaguchi, 2009; Rawat et al., 2013; El-Saadawy et al., 2020; El Bastawesy et al., 2021). Therefore, it is necessary to proceed with developing updated flash flood management strategies (Zheng and Qi, 2011), which is a prerequisite for any sustainable planning in any area (Rawat et al., 2013; Attwa et al., 2021). The significant changes in the original landscape and landcover during the past few decades, as well as their impact on the hydrological behavior on the basin scale, have motivated more scientific research to examine and quantify the relationship between landcover/land-use changes, with particular emphasis on urban expansion, and natural hazards such as rockfalls (Othman et al., 2021), groundwater pollution (Khalil et al., 2021), land subsidence (Rateb and Abotalib, 2020; AlJammaz et al., 2021), development of urban heat islands (Mohamed et al., 2021) and flash flood hazards (Chen et al., 2009; Fox et al., 2012).
Numerous studies applied geomatic applications to estimate the impacts of flash flood hazards on urban areas with regard to land-use changes (Mason et al., 2009; Shaaban et al., 2021). Others have studied the flash flood risk assessment using remote sensing and GIS techniques with the help of the morphometrical and hydrological characteristics, statistical and multi-criteria decision analysis (Siddayao et al., 2014). The integration of geomatics and mathematical hydrological and hydraulic modelling provides an exceptional tool for identifying and spatially analyzing the vulnerability of urban areas to flash flood risk and mitigating potential damages of flash flood events (Marco et al., 2019).
We applied an integrated approach that incorporates geomatics with mathematical hydrological and hydraulic modelling. This approach combines different datasets and modelling including satellite data, watershed modelling system (WMS), hydrological modelling (HEC-1), and River Analysis System (HEC-RAS) in a GIS environment to predict and simulate the surface runoff process in Wadi Mehassar basin and produce spatially distributed information that involves water surface elevations, velocity, depths and spread of the flash flood, in all areas that are exposed to flash flooding.
The study assesses the potential flash flood hazards in Wadi Mehassar basin in the urban areas and their impacts on the holy sites. Which is located east of the city of Makkah. It covers a total surface area of 86 km2, with elevations ranging between 218 and 913 m (amsl). The geographic location extends between 39° 50′ to 39° 56′ E and 21° 18′ to 21° 27′ N (Fig. 1). It is considered one of the upper sub-basins and tributaries to Wadi Uranah watershed, where they meet in the Hussayniah area in the south to cover the majority of the central region of Makkah (Fig. 2-a). Wadi Mehassar has three sub-drainage basins; Wadi Mehassar, Wadi Al-Azyziah, and Wadi Mina. These sub-basins are fed from highly elevated mountains ranges from 757 to 974 m (Fig. 3-a).
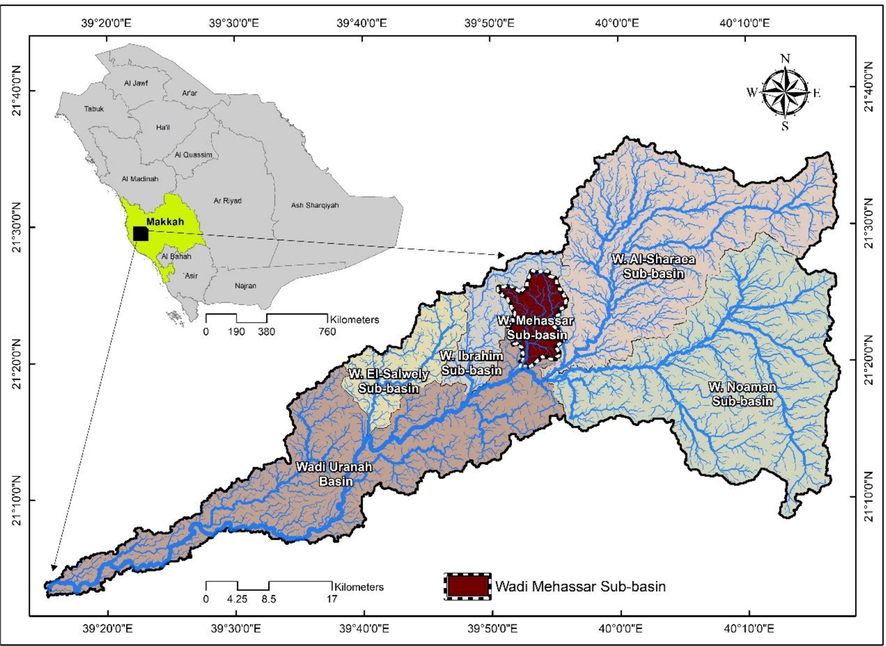
- Location of Wadi Mehassar, one of the five-main upstream sub-basins of Wadi Uranah crosses Makkah central region.
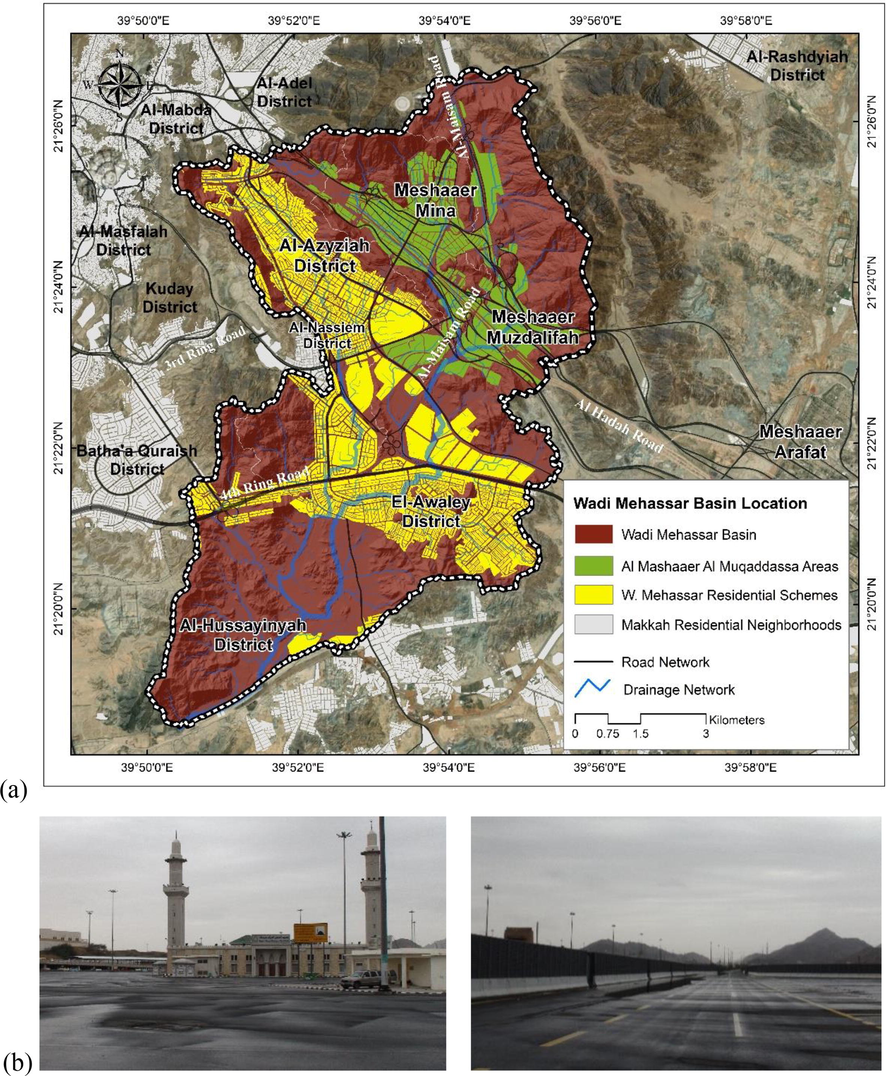
- (a) Location of Wadi Mehassar drainage basin within Makkah city, show the residential schemes within their boundary, (b) Changes in the original landscape and landcover along Al Mashaaer Al Muqaddassa regions, the natural landscape is replaced by roads, buildings, housing developments, and parking lots.
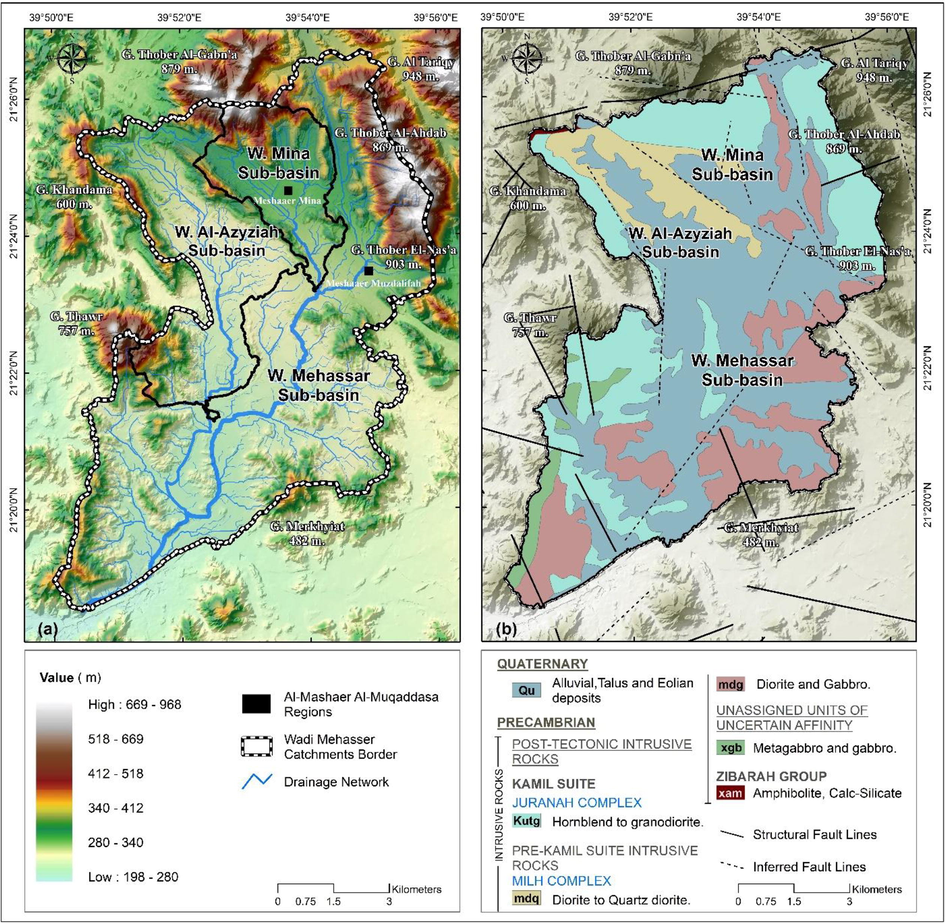
- (a) The Digital Elevation Model (DEM) map of the study area showing the drainage pattern of Wadi Mehassar basin, (b) A simplified geological map of Wadi Mehassar drainage basin within Makkah city, shows the main rock units and the complex alluvial patterns.
The study area has witnessed a major development renaissance over the past few years, where the accelerated process of construction and development of new urban complexes currently encroaches on the main courses of the wadis. This development has been accompanied by the expansion of the areas of impervious surfaces and consequently decreasing the permeability of the land surface. Therefore, the runoff resulting from moderate-intensity storms has become noticeable destructive due to the change in the coefficients of surface runoff, which requires accurate calculations of the hydrological parameters of the basin (Fig. 2-b).
Geologically, the study area is located in the west-central section of the Arabian Shield, which wide range of igneous, metamorphic and sedimentary rocks (Greenwood et al. 1976; Othman et al., 2021). The Proterozoic rocks are intruded by younger igneous intrusive rocks, such as metagabbro, gabbro and amphibolite, which are reffered to as Milh and Ju’ranah complexes (Fig. 3-b). The Quaternary deposits occur mainly in the main streams of the wadis and can be classified into alluvial and aeolian deposits. The alluvial sediments are composed of silt, sand, gravel, and pebbles, which represent the foundation bed of the majority of the newly developed residential neighbourhoods in the investigated area (Morsy, and Othman, 2021). Structurally, at the study area includes three fault orientations of northwest-southeast (NW-SE), northeast-southwest (NE-SW), and north–south (N-S) trends which are related to the Oligo-Miocene rifting of the Red Sea (Al-Shanti, 1966; Elhebiry et al., 2020). The rainfall patterns in the study areas are extreme and highly variable and characterized by short duration and high intensities events, the amount of rain exceeded 200 and 250 mm in several years (1968–1969 − 1992–1996), causing severe flash floods that devastate the populated areas (Habeebullah and Salama, 2011).
2 Methodology and data processing
To achieve the goals of the present study, different datasets were used including: (1) topographic map (1:50,000 scale), for nomenclature of different landforms and wadi names, (2) geologic map (1:250,000 scale) to identify different geologic units and soil hydrological groups, (3) a digital elevation model (DEM) data with a spatial resolution of 2.8 m was used for flash flood modelling, (4) high resolution (SPOT-5) satellite image with a spatial resolution of 2.5 m used to extract land use/land cover (LULC) map using the maximum likelihood classifier function within the remote sensing environment, they derived from the King Abdulaziz City for Science and Technology (KACST), and (5) historical rainfall records for the available meteorological stations. All data were georeferenced using the UTM coordinate system, zone 37 within ArcGIS environment.
Fig. 4 shows the methodology flow chart adopted in this study, which involved five main steps as follows: (1) a statistical analysis of the maximum daily rainfall values recorded at basin-affecting metrological stations, using HYFRAN-PLUS software Hyfran (1998), to estimate the probability of the maximum rainfall intensities for a given return period; (2) delineation of the boundaries of the drainage basins and computing their hydrological characteristics using WMS program, (3) the HEC-1, with their high capability to transform rainfall data into flow at the basins outlets to estimate the hydrologic inflow volumes and peak discharge values for each basin for the different return periods, (4) a hydraulic model (HEC-RAS) to simulate the behavior of drainage in a watershed area, which depends on the inflow rates predicted from HEC-1, and (5) the geomatic (GIS and RS) techniques was used, with their high capacity for data processing, preparation of inputs and post-processing of the output from the two HEC models to delineate the inundation flash flood zones and determine the most exposed areas.
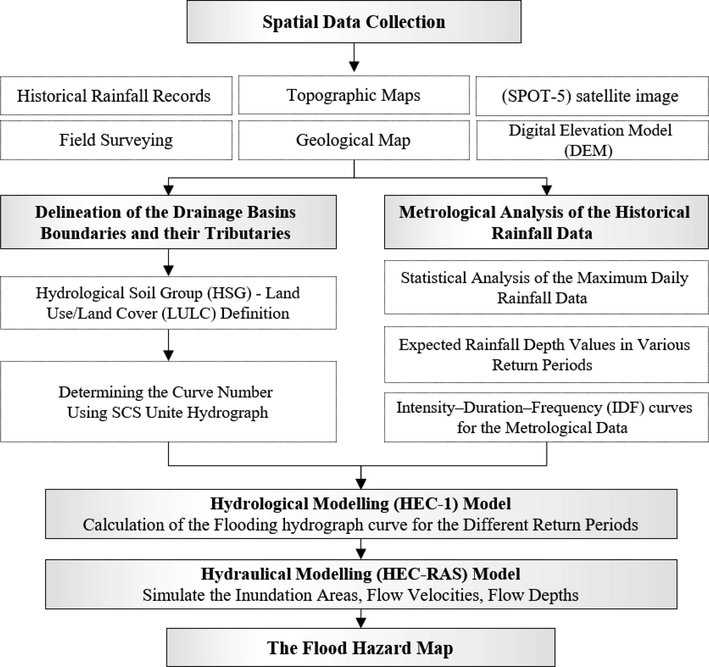
- Flowchart showing the methodology adopted in the current work.
2.1 The metrological analysis of the historical rainfall data
The meteorological analysis, including the amount of rainfall falling over the watershed area to estimate maximum precipitation quantities, reptation and distribution represent a critical input that aid in the accurate calculation of the volume of the flash floods and reflects the expected frequent flash floods. The study conducted a statistical analysis using various statistical distribution methods of historical rainfall data records of three meteorological stations, namely: Makkah Al-Mukaramah Station (J114), Al-Sharae'a Station and Al-Farrain Station (J113), which cover periods of 29 years, 48 years and 38 years, in order to estimate the depth of rainfall and the expected intensity during various return periods (2, 3, 5, 10, 20, 25, 50 and 100) (Subyani and Al-Amri, 2015). These data have been obtained from the General Presidency of Meteorology and Environmental Protection and Ministry of Environment, Water & Agriculture (Supple. Table 1) (Suppl. Fig. 1).
| # | CN | Area (km2) | % | Potential Maximum Retention (S) mm | initial abstractions (Ia) mm |
|---|---|---|---|---|---|
| 1 | 58 | 1.67 | 1.95 | 183.9 | 36.78 |
| 2 | 78 | 0.42 | 0.5 | 71.6 | 14.32 |
| 3 | 79 | 1.41 | 1.73 | 67.5 | 13.5 |
| 4 | 80 | 1.26 | 1.45 | 63.5 | 12.7 |
| 5 | 85 | 13.18 | 15.22 | 44.8 | 8.96 |
| 6 | 86 | 8.72 | 10.11 | 41.3 | 8.26 |
| 7 | 89 | 1.12 | 1.29 | 31.4 | 6.28 |
| 8 | 91 | 6.82 | 7.88 | 25.1 | 5.02 |
| 9 | 92 | 9.88 | 11.41 | 22 | 4.4 |
| 10 | 93 | 0.59 | 0.7 | 19.1 | 3.82 |
| 11 | 94 | 20.52 | 23.7 | 16.2 | 3.24 |
| 12 | 98 | 20.8 | 24.1 | 5.2 | 1.04 |
| Total | 86.3 | 100 % | Ave. 49.3 mm | Ave. 10 mm | |
2.2 The hydrological analysis
The hydrological analysis was done using the (HEC-1) model to calculate the properties of the hydrological drainage basin and producing the required hydrograph curves of Wadi Mehassar basin, based on the synthetic unit hydrograph of the Soil Conservation Service (SCS-UH) to calculate the characteristics of the surface runoff for different return periods.
It was necessary to use the basic formulas of the SCS-CN model of runoff to estimate the rainfall losses and peak discharge through the relationship between runoff behavior to the total rainfall (Yousif et al., 2020; USDA, 1972), which are required to calculate the surface runoff in the watershed drainage basins, as illustrated in (Suppl. Table 2). The depth of surface runoff in the basin was estimated based on the water balance equations (1 and 3); The amount of initial water loss (i.e., before runoff begins) including the water retained in depressions, as well as water intercepted by vegetation, evapotranspiration, and transmission losses were calculated using equation (2) (Gitika and Saikia, 2014). The variable S, which typically varies with antecedent soil moisture and other variables, was estimated using equation (4), where CN is a dimensionless catchment number with a value ranging from 0 − 100, and can be obtained from standard tables developed by the Soil Conservation Administration (SCS) for different combinations of land cover/land use and the hydrological soil groups and Antecedent soil Moisture Condition (AMC) in the catchment area, with three levels of AMC were used that include: AMC-I for dry, AMC-II for normal, and AMC-III for wet conditions (Mishra et al., 2006). For such a catchment with sub-basins that have different land use/land cover data and soil types, a composite curve number CNS was determined by weighting the CN values for the different sub-basins using equation (5) (McCuen, 1982); To estimate the required hydrographs for the drainage basins affecting the project area, both the peak time and peak discharge of the synthetic unit hydrograph of SCS-UH were computed using equations (6) (NRCS, 1997); The time between the occurrence of a unit of rainfall and the occurrence of a unit of surface runoff was calculate using equations (7) (NRCS, 1997); The time needed for the rainfall on the far point of a basin surface until it reaches its outlet was calculated using Kirpich equation (8); The maximum flash flood inflow or peak discharge (m3/s) of the Wadi Mehassar outlet and their sub-drainage basins was calculated for different return periods using equation (9) (NRCS, 1997); and the flash flood inflow volume (m3) of the unit hydrograph were computed using equation (10). All of the mentioned equations are illustrated in (Suppl. Table 2).
| Sub-drainage basins Name | Return Periods (Years) | Flood Characteristics Description | ||
|---|---|---|---|---|
| Peak discharge (m3/s) | Time of peak (min) | Flood volume (m3) | ||
| Wadi Mehassar Sub-basin | 100 Year | 288.66 | 840 | 4,892,650.2 |
| 50 Year | 232.43 | 840 | 3,953,238.3 | |
| 25 Year | 180.95 | 855 | 3,097,267.2 | |
| 20 Year | 165.09 | 855 | 2,831,961.6 | |
| 10 Year | 118.1 | 855 | 2,049,876.9 | |
| 5 Year | 74.53 | 855 | 1,328,653.8 | |
| Wadi Mina Sub-basin | 100 Year | 147.58 | 750 | 1,074.062.7 |
| 50 Year | 122.69 | 750 | 887,953.5 | |
| 25 Year | 99.46 | 750 | 716,456.7 | |
| 20 Year | 92.23 | 750 | 663,646.5 | |
| 10 Year | 70.17 | 750 | 503,834.4 | |
| 5 Year | 48.84 | 750 | 351,905.4 | |
| Wadi Al-Azyziah Sub-basin | 100 Year | 150.06 | 795 | 1,863,216.0 |
| 50 Year | 121.44 | 795 | 1,510,293.6 | |
| 25 Year | 95.17 | 795 | 1,189,161.9 | |
| 20 Year | 87.17 | 795 | 1,091,853.9 | |
| 10 Year | 63.02 | 795 | 799,890.3 | |
| 5 Year | 40.6 | 795 | 530,213.4 | |
| Main Wadi Mehassar Basin Outlet | 100 Year | 449.86 | 810 | 7,829,930.7 |
| 50 Year | 363.41 | 810 | 6,351,484.5 | |
| 25 Year | 284.11 | 810 | 5,002,882.2 | |
| 20 Year | 259.65 | 825 | 4,587,447.6 | |
| 10 Year | 187.24 | 825 | 3,353,595.3 | |
| 5 Year | 120 | 825 | 2,210,881.7 | |
2.3 The flash flood hazard analysis
The two-dimensional hydraulic modelling (HEC-RAS) software, from the Center for Hydrological Engineers, is among the most commonly used model in the scientific and engineering communities for flash flood risk assessment, especially in urban areas (Meghan et al., 2011). This model used the manning empirical formula to calculate and simulate the water surface elevations, flow velocities, flow depths and spread of the flash flood events based on the standard step method (Fan et al., 2009). Numerous studies indicated that these models yield accurate and effective results for assessing the impact of flash floods (Anderson et al., 2002; Siddiqui et al., 2011), a widely used, empirically derived method for assessing the flash flood hazard rating based on testing various empirical formulae (Abt et al.,1989; Karvonen et al., 2000; Cox et al., 2010; Ramsbottom et al., 2006). These studies proposed an empirical formula, which assesses the flash flood hazard as follow:
3 Results and discussion
3.1 The metrological characteristics of the historical rainfall data
The results of the metrological analysis showed that the potential distributions methods “Lognormal”, “3 parameter- Lognormal” and “Exponential” is the most suitable and the best-fitting curves for Makkah Al-Mukaramah (J114), Al-Sharae'a (TA104) and Al-Farrain (J113) stations respectively (Fig. 5). The purpose of fitting data to statistical distributions patterns is to be prepared to estimate the probability of the maximum rainfall intensities for a given return period, the rainfall depth values were calculated for different return periods, the results are shown in (Suppl. Table 3). The expected depth of rainfall in Makkah Al-Mukaramah station ranged from 33.0 mm/day in 2 years to 116 mm/day in 100 years, and between 35.4 mm/day in 2 years to 139 mm/day in 100 years in Al-Sharae'a station, while in the Al-Farrain station, the expected maximum rainfall amounts ranged between 33 mm/day in 2 years to 116 mm/day in 100 years. The rainfall intensity–duration–frequency (IDF) curves for different return periods were also established for selected three rainfall stations using annual maximums of 24-h rainfall.
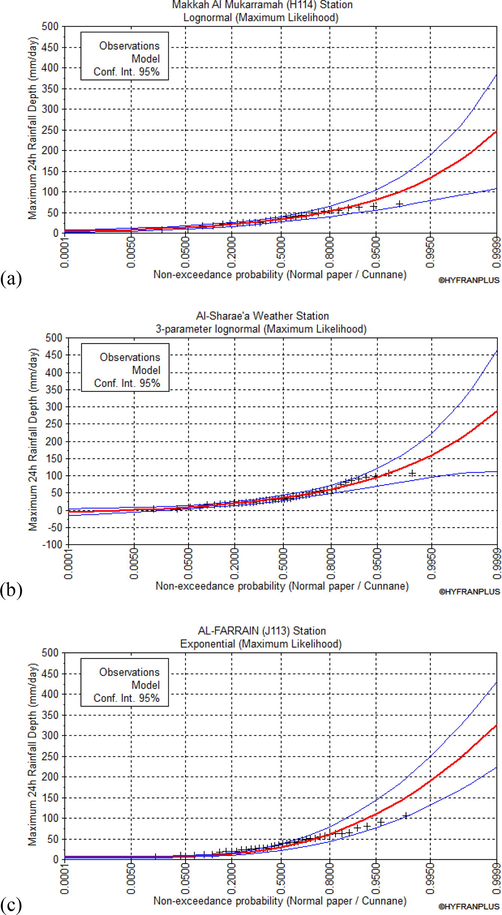
- The probability distribution curves of the metrological stations affecting Wadi Mehassar catchment using various statistical distribution methods (a) Makkah Al-Mukaramah station (J114) using the Log normal distribution method, (b) Al-Sharae'a ((TA104)) station using the Lognormal 3- Parameter distribution method, and (c) Al-Farrain station (J113) using the Exponential distribution method.
3.2 Definition of the hydrological soil group (HSG) and LULC maps of the Wadi Mehassar Basin
The SCS method identified four hydrological soil groups according to the rate of water transfer through them and their ability to generate runoff that is related to the soil texture (USDA-TR55, 1986). The results show that, the group (D) represents the dominant one and ranks first with an area of 48.37 km2, accounting for about 55.25% of the total area of the studied drainage basin, and it includes deposits of post-tectonic eruptions, Juranah and Milh Complex, which are characterized by very low permeability rates allowing most runoff to occur in the region. On the other hand, group (B) includes alluvium deposits, which occur in the steppe areas between mountain and represents an area of 39.16 km2 about 44.74% of the total basin area. It consists of rough to medium texture with medium depths and has medium to high permeability rates and relatively low runoff generation capacity (Suppl. Fig. 2-b).
The LULC map of Wadi Mehassar region was developed through the classification of high resolution (SPOT-5) satellite imagery and classify the study area into 7 main categories of LULC, each of which reflects the type of land cover and the uses of the earth's surface in the Wadi Mehassar basin (Suppl. Fig. 2-a), Suppl. Table 4 shows the estimated area for every LULC classes, which influence the infiltration rate of the land cover.
3.3 Determining the curve number of the Wadi Mehassar Basin:
Table 1 shows the values of the curve numbers (CN) obtained in the Wadi Mehassar basin, which ranged from (58) for high permeability rates areas and low runoff potential to (98) for areas with low permeability rates and high runoff generation capacity. As for the distribution values of the curve numbers of the Wadi Mehassar basin, the (98) values of curve number came first in terms of area 20.8 km2 by 24.1% of the total area of the basin, followed by (94) came second in terms of area by about 20.52 km2 by 23.7%, then the value of the curve number (85) came in third terms of area by about 13.18 km2 15.22%, then (92) curve number value ranked fourth at 9.88 km2, accounting for 11.41% of the total area of the basin. In which, the values of the high curve numbers that exceed the value 91 in the Wadi Mehassar basin reach about 58.61 km2 by 68%, which means that more than half of the basin area is expressed as impervious surfaces that does not allow water to leak into the soil and are responsible for the generation surface runoff in the parts of the total basin, Figs. 6-a shows the spatial distribution of curve numbers values for Wadi Mehassar basin.
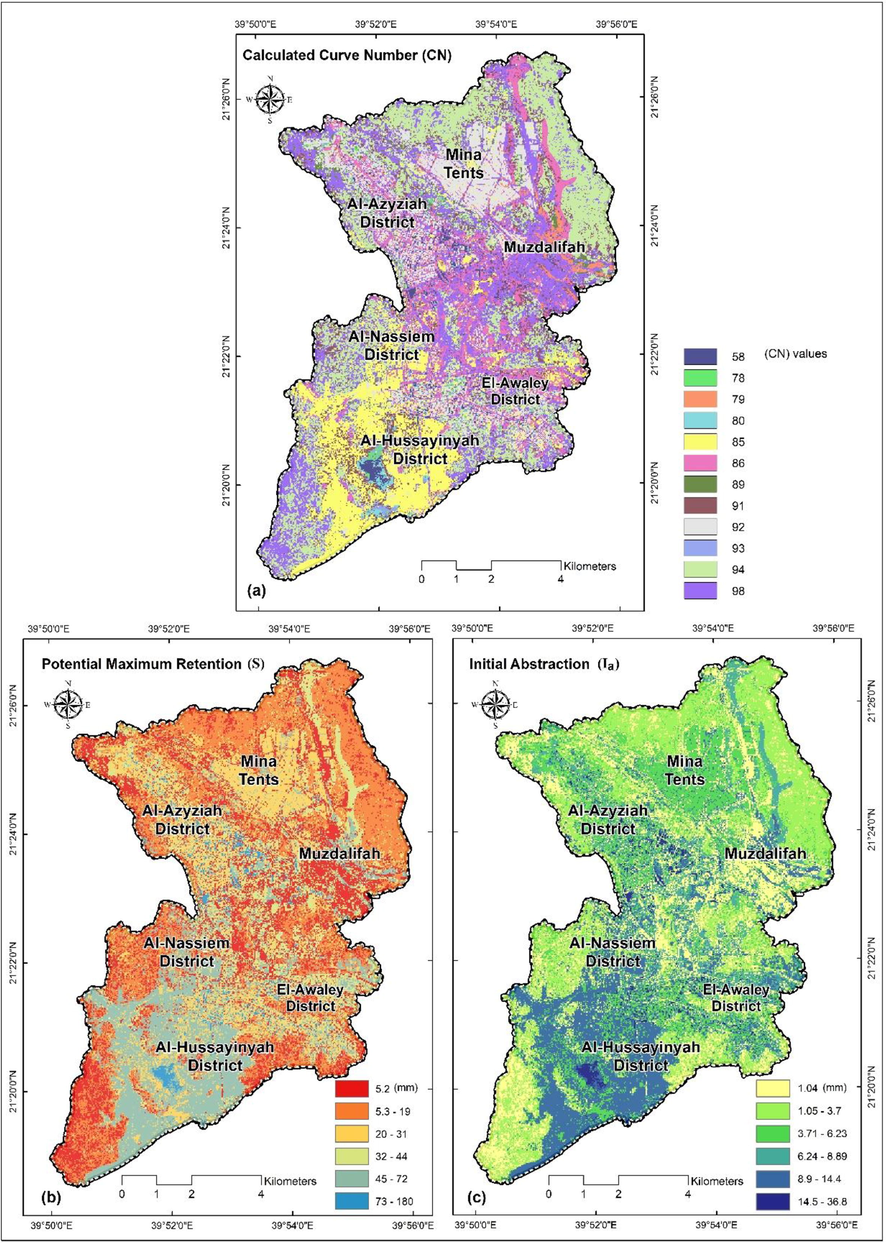
- Spatial distribution of (a) The curve number (CN) values, (b) The potential maximum retention (S) values, (c) the initial abstraction (Ia) values for each cell of the Wadi Mehassar basin.
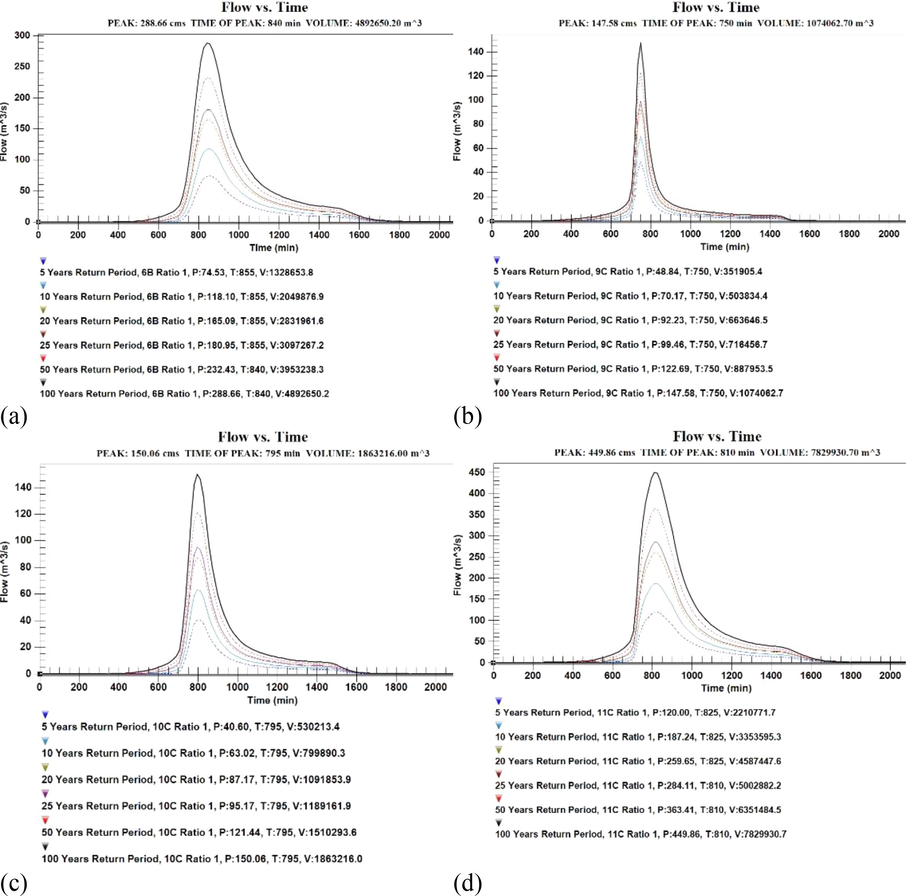
- The flood inflow hydrographs of (a) Wadi Mehassar sub-basin, (b) Wadi Mina sub-basin, (c) Wadi Al-Azyziah sub-basin, (d) The main Wadi Mehassar outlet created by HEC-1 for the different return periods (5, 10, 20, 25, 50, and 100 years).
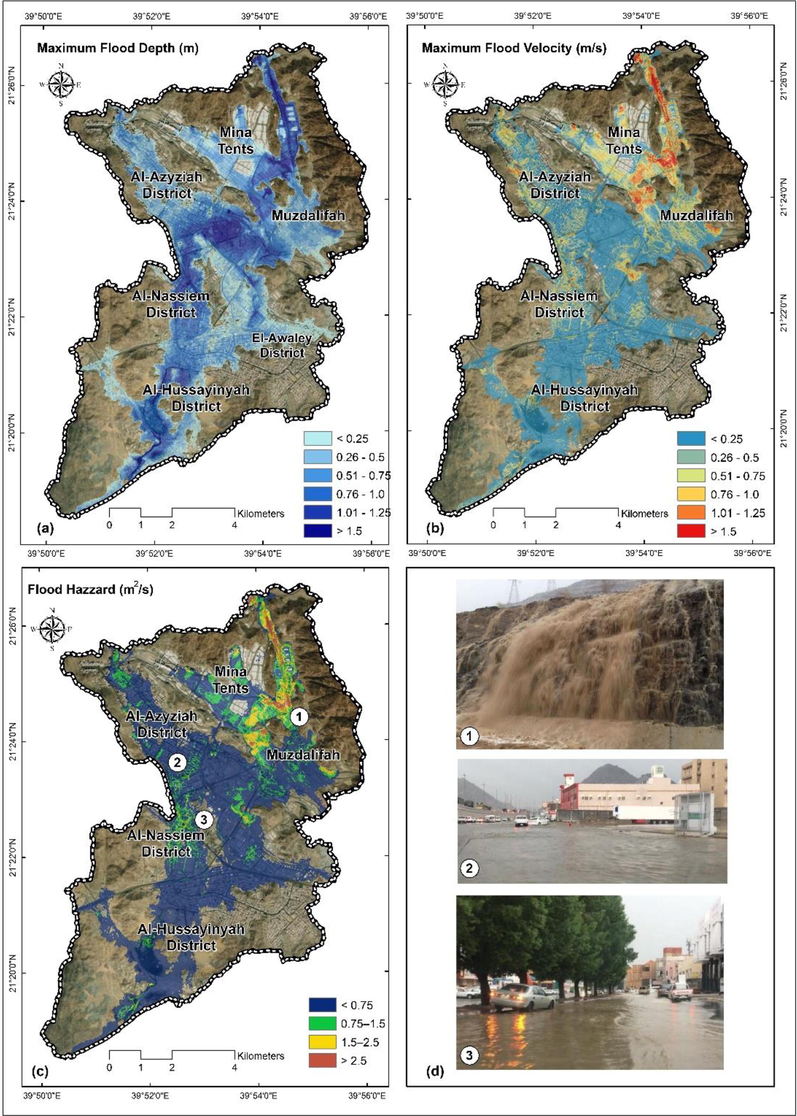
- The spatial change in (a) The maximum flood depth (m), (b) maximum flood velocity (m/s), and (c) The spatial change of flood hazard model severity (m3/s) over the Wadi Mehassar watershed area for 100-year floodplain storm (simulated by HEC-RAS), and (d) Photographs of the most recent floods occurred on 8 April 2021, showing the rainfall rushes from the mountains surrounding the Al Mashaaer Al Muqaddassa, drowning of several urban settlements and roads, as well as destruction of many infrastructures in urban areas within the study basin.
The potential maximum retention (S) was calculated for each cell of the Wadi Mehassar basin, using equations (5) (Table 1), its value ranged from 5.2 to 183.9 mm and increases with the CN value decreases, and vice versa. Figs. 6-b shows the spatial distribution of (S) values, in which the high values represent the most permeable parts to the south, central, and southeast of the basin. While the low values denote the areas that are less able to retention of water, and thus high ability of the soil to generate surface runoff. Therefore, the areas with high vulnerability to flash flooding include: the northeastern regions where Meshaaer Muzdalifah is located, the northern and northwestern regions where the Meshaaer Mina is located. On the other hand, the initial abstraction (Ia) was calculated using equation (2). Table 1 provides the calculated (Ia) values for Wadi Mehassar basin, it reveal that, its value ranged from (1.04 mm) for the lowest value in built-up, paved parking and roads areas to (36.78 mm) as the highest value in bare soils, Alluvial deposits and Agricultural lands within the studied basin (Fig. 6-c).
3.4 The hydrological characteristics of the Wadi Mehassar basin
The summary results of the flash flood frequency hydrograph analysis for the Wadi Mehassar outlet and their sub-drainage basins are shown in (Table 2) and (Fig. 7). The results show the variance in inflow volumes and peak discharge values from one discharging basin to another. In general, the peak discharge of the main Wadi Mehassar outlet for different return periods were estimated as 120 – 187 – 259 – 284–363 and 449 m3/s; the inflow volume are 2.210.771–3.353.595–4.587.447–5.00.288–6.351.148 and 7.829.930 m3; and the estimated time to reach its peak value ranged between (810 to 825) min for 5, 10, 20, 25, 50 and 100 years, respectively.
With regard to the sub-basins, the Wadi Mehassar sub-basin attained the maximum flash flood inflow for a 100-year return period of approximately 288.66 m3/s, followed by the Wadi Al-Azyziah sub-basin of approximately 150.06 m3/s; and Wadi Mina sub-basin came last in terms of the maximum flash flood inflow, which reached approximately 147.58 m3/s. The Wadi Mehassar sub-basin came first in terms of the inflow volume during a return period of 100 years, which reached about 4,892,650.2 m3. It was followed by the Wadi Al-Azyziah sub-basin, whose inflow volume reached 1,863,216.0 m3, and Wadi Mina sub-basin yielded the lowest inflow volume, which reached 1,074,062.7 m3 (Table 2). Based on Kirpich's equation (12), the time of concentration (Tc) at the outlet for each discharging basins were estimated. Its value ranged between 0.53 h in the Wadi Mina sub-basin as a shortest time, followed by 1.70 h for the Wadi Al- Azyziah sub-basin, then 3.49 h for the Wadi Mehassar sub-basin as a longest Tc value. In addition, the delay time (TLAG) was estimated using equation (7), the results showed that its value ranged between 0.59 h in the Wadi Mina sub-basin as a shortest delay time, followed by 1.36 h for the Wadi Al- Azyziah sub-basin, then 2.09 h for the Wadi Mehassar sub-basin to representing the longest delay time value.
3.5 The flash flood hazard assessment and inundation area Mapping:
The HEC-RAS model was developed based on the maximum inflow discharges estimated by the hydrological analysis for each sub-basin, to delineate the inundation areas, water depth and water velocity level along the floodplain of the watershed areas for the 100-year rainfall event. The modelling process started with drawing the 2D flow area polygon of the studied drainage system schematically, which reveal the centrelines of the drainage channels and any depressions in the land surface that facilitate the flow of flash flood water, this was done by using the button of Geometric Data editor - SA/2D Area BC Lines drawing of the HEC-RAS tools bar. All this geometric data were added manually to the detailed terrain data based on the 2.8 m DEM to build a 2D Mesh over the terrain data to helps the model to perform computations and determine where the water goes depend on the terrain discretization.
Supplementary Table 5 illustrates the various flash flood hazard classifications to people proposed by (Ramsbottom et al., 2006) based on the HEC-RAS program as a suitable method for urban areas. Fig. 8-d shows the most recent flash floods occurred on 8 April 2021, causing the drowning of several urban settlements and roads, as well as destruction of many infrastructures in Al Mashaaer Al Muqaddassa and urban areas, east of Makkah. The delineation of flooded areas reveals that many surrounding areas would suffer from the 100-return period storm. The analysis showed that; The floodplain depth threshold, taken as 0.25 m, is beyond which the water depth can be life-threatening (Naeem et al., 2021). Fig. 8-a shows the maximum depth category (>1.5 m) within the main Wadi Mehassar channel, which represents about 4.36% of the total area and covers about 1.64 km2 that is concentrated at the upstream part of the studied area to the north. This area is not highly urbanized, but has the animal slaughter building on a high slope area. Additionally, the maximum depth was noticed in Muzdalifah bus station yard in the central part of wadi Mehassar, as well as along the western parts of the Al-Nassiem, El-Awaley and Al-Hussayinyah districts urban communities.
Furthermore, a maximum flash flood velocity map was simulated to highlight the most prone areas to high flash flood velocity. The flash flood water velocity of 1.25 to 1.5 m/s can cause instability for an adult (Chen et al., 2018). In this context, Fig. 8-b illustrates the maximum velocity within the studied area, which shows that many areas are above the instability threshold, resulting in a hazardous condition. These areas cover about 1.57 km2 and represented about 4.15% of the total area, they concentrated at the upstream part northeast of the studied basin, particularly in the southern Mina tents communities; as well as at the foot of some locations of high slope mountain in the eastern and western parts of Wadi Mehassar. Overall, the low values of depth and velocities were observed in the floodplain to the south may be associated with a low slope topography with a relatively high land compared to the natural surface level in the floodplain, as well as a high infiltration rate of the soil.
Fig. 8-c shows the flash flood hazard map classifications, which denotes the boundary zones of the flash flood hazard in the study area, the data extracted from the flash flood hazard maps indicated that the extreme flash flood hazards (2.5 m3/s upwards) and represent about 5.39 % and cover about 2.04 km2 of the areas exposed to the flooding of Wadi Mehassar. These areas are concentrated in the northeast part of studied area, particularly along Al-Maisam Road. Furthermore, several spots within the floodplain were found to be extremely dangerous to life within the neighborhoods in the northwest part of study area, which make the active floodplain uninhabitable, particularly close to neighborhoods Al-Azyziah, Al-Naseem urban areas and Muzdalifah bus station yard.
4 Conclusions
The Wadi Mehassar basin, east of the city of Makkah has witnessed a major urban development to accommodate the residents and millions of Hajj pilgrims. This study assesses the impact of flash floods in Wadi Mehassar basin through the integration between spatial geomatics and mathematical hydrological and hydraulic modelling. The results showed that the holy places (i.e., Al-Mashaer Al-Muqaddasa regions) and many modern urban complexes east of Makkah City are frequently exposed to flash floods whose drainage apex approximately reached 449.86 m3/s, with volumes reaching up to 7.829.930 m3 and 810 min to reach its peak value during a return period of 100 years. The maximum floodplain depth category (>1.5 m) dominates up to 4.36%, constituting about 1.64 km2 of the areas prone to the Wadi Mehassar flooding, which are concentrated at the upstream parts to the north, Muzdalifah bus station yard in the central part, as well as along the western parts of the Al-Nassiem, El-Awaley and Al-Hussayinyah districts urban communities. The maximum floodwater velocity category (1.25 – 1.5) m/s represented about 4.15%, constituting about 1.57 km2 of the areas prone to the Wadi Mehassar, which are concentrated in the northeast part of Wadi Mehassar, particularly in the southern Mina tents communities; as well as at the foot of some locations of high slope mountain in the eastern and western parts. The extreme flash flood hazards (2.5 m3/s upwards) represented about 2.04%, constituting about 5.39 km2 of the areas exposed to the flooding of Wadi Mehassar. Furthermore, several spots within the floodplain were found to be extremely dangerous to live within the neighbourhoods in the northwest part of study area, which make the active floodplain uninhabitable, particularly close to neighbourhoods Al-Azyziah, Al-Naseem urban areas and Muzdalifah bus station.
The study showed that underestimating the role of stream pathways in collecting flash flood water in urban planning is increasing the surface area of impervious surfaces as a byproduct of the development plans significantly intensifying the flash flood hazards. Thus, a better collaboration and integration between urban development and planning authorities should be implemented. Moreover, it would be recommended to develop an early warning system to be installed in the hydrometric stations to alarm for flash flood hazards.
Acknowledgements
The authors would like to thank and acknowledge Umm Al-Qura University that provides all facilities to carry out the field survey.
Declaration of Competing Interest
The authors declare that they have no known competing financial interests or personal relationships that could have appeared to influence the work reported in this paper.
References
- Land Subsidence Induced by Rapid Urbanization in Arid Environments: A Remote Sensing-Based Investigation. Remote Sensing. 2021;13(6):1109.
- [Google Scholar]
- Human Stability in a High Flood Hazard Zone. J. Am. Water Resour. Assoc.. 1989;25(4):881-890.
- [Google Scholar]
- Coupling HEC-HMS with atmospheric models for prediction of watershed runoff. J. Hydrol. Eng.. 2002;7(4):312-318.
- [Google Scholar]
- Toward an integrated and sustainable water resources management in structurally-controlled watersheds in desert environments using geophysical and remote sensing methods. Sustainability. 2021;13(7):4004.
- [Google Scholar]
- Further Improvement in A Criterion for Human Stability in Floodwaters. J. Flood Risk Manage.. 2018;12(3):e12486.
- [Google Scholar]
- Impacts of land use change scenarios on storm-runoff generation in Xitiaoxi Basin. China. J. Quat. Internat.. 2009;208(1–2):121-128.
- [Google Scholar]
- Cox, R., Shand, T., and Blacka, M., 2010. Revision Project 10: Appropriate Safety Criteria for People. Stage 1 Report. Australian Rainfall and Runoff. Water Research Laboratory, The University of New South Wales. https://arr.ga.gov.au/arr-guideline/revision-projects/project-list/projects/project-10.
- Land use and land cover change in greater dhaka, bangladesh: using remote sensing to promote sustainable urbanization. J. Appl. Geogr.. 2009;29(3):390-401.
- [Google Scholar]
- Examining the impact of different DEM sources and geomorphology on flash flood analysis in hyper-arid deserts. ISPRS Int. J. Geo-Inf.. 2021;10(7):431.
- [Google Scholar]
- Paleozoic glaciation in NE Africa: Field and remote sensing-based evidence from the south eastern desert of Egypt. Int. Geol. Rev.. 2020;62(9):1187-1204.
- [Google Scholar]
- Modeling flash floods and induced recharge into alluvial aquifers using multi-temporal remote sensing and electrical resistivity imaging. MDPI, J. Sustainability.. 2020;12(23):10204.
- [Google Scholar]
- An Innovative Modeling Approach Using Qual2K and HEC-RAS Integration to Assess the Impact of Tidal Effect on River Water Quality Simulation. J. Environ. Manage.. 2009;90(5):1824-1832.
- [Google Scholar]
- A case study of land-cover change (1950–2003) and runoff in a Mediterranean catchment. J. Appl. Geogr.. 2012;32(2):810-821.
- [Google Scholar]
- Estimation of surface runoff using NRCS curve number procedure in Buriganga Watershed, Assam, India-A geospatial approach. Internat. Res. J. Earth Sci.. 2014;2(5):1-7.
- [Google Scholar]
- Greenwood, W.R., Hadley, D.G., Anderson, R.F., Fleck, R.J., and Schmidt, D.L., 1976. Late Proterozoic Cratonization in Southwestern Saudi Arabia. Philosophical Transactions for the Royal Society of London. Series A, Mathematical and Physical Sciences. 280 (1298), 517–527.
- T.M. Habeebullah M. Salama Monitoring of Climate in Makkah and the Holy Places. The final report. The Custodian of the Two Holy Mosques Institute for Hajj and Umrah Research 2011 Makkah, Saudi Arabia. (Unpunished Report).
- M. Hyfran Developed by INRS-Eau with Collaboration of Hydro-Québec Hydraulic Service (Department Hydrology), in the Framework of Hydro-Québec/CRSNG Statistical Hydrology Chair Located at INRS-Eau https://www.wrpllc.com/books/HyfranPlus/indexhyfranplus3.html 1998 Available online: accessed on 10 August 2021.
- Groundwater mixing in shallow aquifers stressed by land cover/land use changes under hyper-arid conditions. J. Hydrol.. 2021;598
- [Google Scholar]
- The Use of Physical Models in Dam-Break Flood Analysis, Development of Rescue Actions Based on Dam-Break Flood Analysis (RESCDAM) In: Final Report of Helsinki University of Technology. Finland: Finnish Environment Institute; 2000. p. :56.
- [Google Scholar]
- Flood risk evaluation in urban spaces: The study case of Tormes River (Salamanca, Spain) Int. J. Environ. Res. Public Health. 2019;16(1):5.
- [Google Scholar]
- Calibration of uncertain flood inundation models using remotely sensed water levels. J. Hydrol.. 2009;368(1–4):224-236.
- [Google Scholar]
- A Guide to Hydrologic Analysis Using SCS Methods. Englewood Cliffs, N.J., USA: Prentice-Hall, Inc.; 1982. p. :145.
- A. Meghan V. Christophe hazel, F., and Sally, P., Flood Hazard Research Center, Flood Risk Management Consortium Methods for Creating a Flood Risk Assessment Tool 2011 Middlesex University; London, United Kingdom.
- SCS-CN-based modeling of sediment yield. J. Hydrol.. 2006;324(1–4):301-322.
- [CrossRef] [Google Scholar]
- Urban heat island effects on megacities in desert environments using spatial network analysis and remote sensing data: A case study from western Saudi Arabia. Remote Sensing. 2021;13(10):1941.
- [Google Scholar]
- Delineation of shallow groundwater potential zones using integrated hydrogeophysical and topographic analyses, western Saudi Arabia. J. King Saud Univ.-Sci.. 2021;33(7)
- [Google Scholar]
- B. Naeem M. Azmat H. Tao S. Ahmad M. Khattak S. Haider S. Ahmad Z. Khero C. Goodell Flood Hazard Assessment for the Tori Levee Breach of the Indus River Basin, Pakistan Water 13 5 604.
- Nrcs Ponds-Planning, Design, Construction Agriculture Handbook No. 590; United States Department of Agriculture, Natural Resources Conservation Service, US Government Printing Office 1997 Washington, DC, USA.
- Hazard assessment of rockfalls in mountainous urban areas, western saudi arabia. Arab. J. Sci. Eng.. 2021;46(6):5717-5731.
- [Google Scholar]
- Ramsbottom, D., Wade, S., Bain, V., Hassan, M., Penning-Rowsell, E., Wilson, T., Fernandez, A., House, M., and Floyd, P., 2006. Flood Risks to People: Phase 2. R&D Technical Report FD2321/IR2, Department for the Environment, Food and Rural Affairs (DEFRA), UK Environment Agency.
- Inferencing the land subsidence in the Nile Delta using Sentinel-1 satellites and GPS between 2015 and 2019. Sci. Total Environ.. 2020;729:138868
- [Google Scholar]
- Changes in land use/cover using geospatial techniques: A case study of Ramnagar Town Area, District Nainital, Uttarkhand, India. Egypt. J. Remote Sens. Space Sci.. 2013;16:111-117.
- [Google Scholar]
- An integrated GPR and geoinformatics approach for assessing potential risks of flash floods on high-voltage towers, Makkah, Saudi Arabia. Environ. Earth Sci.. 2021;80(5):1-15.
- [Google Scholar]
- Analytic hierarchy process (AHP) in spatial modeling for floodplain risk assessment. Internat. J. Machine Learn. Comput.. 2014;4(5):450-457.
- [Google Scholar]
- Flood Inundation Modeling for A Watershed in the Pothowar Region of Pakistan. Arab. J. Sci. Eng.. 2011;36(7):1203-1220.
- [Google Scholar]
- IDF curves and daily rainfall generation for Al-Madinah City, Western Saudi Arabia. Arab. J. Geosci.. 2015;8(50):11107-11119.
- [Google Scholar]
- National Engineering Handbook, Section 4. Washington, DC, USA: United States Department of Agriculture, Soil Conservation Service, US Government Printing Office; 1972.
- USDA-TR55, 1986. Urban Hydrology for Small Watersheds, Technical Release (TR-55); United States Department of Agriculture, Soil Conservation Service, US Government Printing Office: Washington, DC, USA. pp. 2–6. https://www.nrcs.usda.gov/Internet/FSE_DOCUMENTS/stelprdb1044171.pdf
- The respective roles of modern and paleo recharge to alluvium aquifers in continental rift basins: A case study from El Qaa plain, Sinai, Egypt. Sci. Total Environ.. 2020;739:139927
- [Google Scholar]
- Potential flood hazard due to urban expansion in the Karst mountainous region of North China. Regional Environmental Change.. 2011;11:439-440.
- [Google Scholar]
Appendix A
Supplementary data
Supplementary data to this article can be found online at https://doi.org/10.1016/j.jksus.2022.102045.
Appendix A
Supplementary data
The following are the Supplementary data to this article:


