

Translate this page into:
Identification of novel biomarker RPS21 using microarray-based whole-gene expression profiling of breast cancer in Saudi women
*Corresponding author: E-mail address: mmolla@uvm.edu (M.H. Rahman Molla)
-
Received: ,
Accepted: ,
Abstract
Breast cancer (BC) is the most common malignancy worldwide, including in Saudi Arabia. Because of its heterogeneous nature, existing diagnostic and prognostic biomarkers are not relevant for all cases. There is a need to discover novel biomarkers for early diagnosis and prognosis to reduce mortality. Herein, we utilized an integrative bioinformatics approach to identify potential biomarkers for BC. Gene expression profiling of 45 BC and five normal samples from KAUH, Jeddah was done with the GeneChip Human Genome 1.0 ST Array. Data was analyzed by LIMMA package of R and differentially expressed genes (DEGs) detected in Saudi Arabian patients were compared with American and Asian datasets. Ingenuity pathway analysis tool and gene ontology enrichment analysis were conducted to find aberrant pathways associated with BC. Survival analysis was done by Kaplan -Meier plotter to establish prognostic importance of identified genes followed by validation using qPCR. The association between RPS21 gene expression and systematic therapeutic response in BC was checked using statistical methods. Our results revealed 870, 658 and 567 DEGs in Saudi Arabian (GSE36295) American (GSE166044) and Asian (GSE15852) patients, respectively. The genes RPS21, CXCL2, TNMD, TOP2A, HMMR, and RRM2 were common in all groups. Pathway analysis revealed cell cycle checkpoints and BC regulation by stathmin1 as the most inhibited and activated pathways, respectively. Gene ontology and protein-protein interaction (PPI) network analysis of DEGs showed the role of ribosome-related genes and pathways in BC. Survival analysis predicted RPS21 to be a potential novel prognostic biomarker. Our findings highlight RPS21 as a good prognostic biomarker candidate for BC in Saudi patients. It could be used globally after validation on bigger cohorts. Functional enrichment and pathway analysis predicted alteration in cell cycle, cancer regulation, and ribosome-related pathways associated with BC and provided critical insights into the molecular mechanisms driving breast tumorigenesis.
Keywords
Biomarker
Breast cancer
Gene expression profiling
Pathways
Prognosis
RPS21

1. Introduction
Breast cancer (BC) is one of the most frequent malignancies in females worldwide, followed by lung cancer (Sung et al. 2021). The incidence of new BC cases reached 2.3 million (11.7%) in 2020, and 685,000 of those cases resulted in death (Arnold et al. 2022; WHO 2023). In Saudi Arabia, 14.2% (3954) of all cancer cases in 2020 were breast cancer, of which 1095 died, making it the second most common cause of cancer-related deaths (Ferlay J 2024).
The heterogeneous nature of BC, involving hundreds of genes and different molecular mechanisms in its pathogenesis, leads to diverse clinical behaviors (Ferrari et al. 2022). Therefore, the diagnosis and prognosis of BC are severely affected by multiple subtypes and phenotypic diversity (Eswaran et al. 2012). The known risk factors for BC are older age, obesity, smoking, and genetic predisposition, including BRCA1, BRCA2, p53, PTEN, and STK11 gene mutations (Song et al. 2014). Guided surgical tumor removal is the most effective treatment strategy unless metastasis has occurred. Targeted therapy with drugs such as tamoxifen and trastuzumab for ER+/PR+, and HER2+ tumors is also effective (Paik et al. 2004). Targeted radiation and chemotherapy by cyclophosphamide, paclitaxel, and doxorubicin are the last options depending on the stage of cancer (Mirza et al. 2023; Okuma et al. 2016; Romond et al. 2005). Early diagnosis of BC can greatly reduce mortality, improve risk prediction, and help determinine the treatment response for BC management (Li et al. 2020). Hence, it is essential to find biomarkers for early BC screening and diagnosis, prognosis, and treatment response.
The advent of high-throughput technologies such as microarray and transcriptomic studies has identified several distinct intrinsic BC subtypes like luminal A, luminal B, HER2-enriched, and basal-like, depending on the expression patterns of hundreds of differentially expressed genes (DEGs) including ER, PR, HER2, cytokines, GATA3, and cyclin E1 (Carey et al. 2006; Liao et al. 2015). DNA microarray is the ultimate tool for performing massive and simultaneous analysis of transcriptomes and leads to the identification of key genes as probable biomarkers for early diagnosis and therapeutic response prediction of BC (Karim et al. 2016; Lacroix et al. 2002; Liu et al. 2008; Merdad et al. 2014; Merdad et al. 2015; Mirza et al. 2023). However, despite the direct role in BC pathogenesis, DEGs have also shown their involvement through many important signaling pathways. Activation or inhibition of pathways alters or transmits the routine differentiation to proliferation, invasion, metastasis, and response to treatment (Schramm et al. 2010). However, the interaction of interconnected complex pathways within a cellular network remains to be completely deciphered.
Herein, we conducted expression profiling of BC samples. We also elucidated DEGs significantly associated with BC, conducted pathway and network analysis, compared the transcriptomic and pathway results with American and Asian ethnic groups, validated the novel DEGs by qPCR, and investigated their prognostic importance in Saudi patients with BC. Consequently, this study’s findings can offer more mechanistic details and an understanding of signaling pathways involved in BC in comparison to other gene expression studies. To the best of our knowledge, we herein report RPS21 as a prognostic BC biomarker for the first time.
2. Material and methods
2.1 Subjects
The study was conducted after receiving ethical approval (16-CEGMR-Bioeth-2022) from the CEGMR Ethical Review Committee at King Abdulaziz University in October 2022. Subjects were recruited from King Abdulaziz University Hospital, KSA. The collected samples comprised 45 surgical resected tumors at different stages from BC cases aged 40–70 years, and five non-tumor healthy breast tissue. Collected BC tumor and normal breast tissues were either processed instantly for RNA isolation or preserved in RNAlater (Qiagen Inc) at −20°C till RNA extraction.
2.2 RNA isolation
Total RNA was extracted from human flesh and tumor breast tissues by means of RNeasy® Plus Mini Kit (Qiagen), as instructed by the manufacturer and kept at −80°C. For evaluating RNA yield and quality, A260/A280 RNA ratios were examined with the Experion automated electrophoresis system (BioRad). RNA concentrations were calculated using Nanodrop.
2.3 Gene expression profiling
Gene expression profiling of 45 BC and five control samples was performed with the GeneChip Human Genome 1.0 ST Array (Affymetrix Inc.) representing 55,000+ transcripts. At least 100 ng of total RNA was amplified, labeled, fragmented, and hybridized by GeneChip 3′ IVT Express Kit according to the manufacturer’s protocol. GeneChip Fluidics Station 450 was used for washing and staining before scanning the arrays using GeneChip Scanner 3000 7G. Affymetrix GCC software version 3.2 was used to convert scanned images to ‘.CEL’ files. We deposited our expression results of 50 Saudi BC cases at GEO (Accession No. GSE36295, platform GPL6244). For comparative analysis, we retrieved two BC datasets from GEO/NCBI: GSE166044 (n=30, platform GPL18573) from Indiana University School of Medicine, USA, and GSE15852 (n=86, platform GPL96) from Institute for Medical Research, Malaysia.
2.4 Identification of differentially expressed genes
The batch effect correction of the GSE datasets was done utilizing the “Sva” (version 3.29.1) package of R language (version 3.5.1). Linear Models for Microarray Data package (LIMMA, version 3.37.4) was used to compare gene expression values and identify DEGs associated with BC (Diboun et al. 2006). Statistically significant DEGs between BC and healthy breast tissues were filtered using Benjamini Hochberg method, a cutoff of adjusted P-values < 0.05, to evade false-positive results. To determine up- or down-regulation patterns, a cut-off value of log2 fold change ≥ ±1 was accepted as significant. Later, multiple probes in lieu of single gene expression were averaged to retain exclusive genes and remove duplicate probes. Visualization of intersected DEGs from three datasets was done by Venn diagrams (http://bioinformatics.psb.ugent.be/webtools/Venn/).
2.5 Gene ontology and pathway enrichment analysis
Pathway and network enrichment analyses of DEGs were performed using IPA (Ingenuity Pathway Analysis, Version-101138820). Additionally, Gene ontology annotation analyses were done to investigate their biofunctions. PPI network of validated DEGs was built with STRING version 12.0 (https://string-db.org/) (Szklarczyk et al. 2021). The cut-off of the interaction score was set as 0.4. A PPI network with edges indicating both functional and physical protein associations was visualized.
2.6 Survival analysis
Survival analysis was done to compare the survival time difference. Kaplan-Meier plotter (www.kmplot.com) helped to plot the overall survival for BC patients for each potential gene and identified candidate genes showing a strong association with survival (Lacny et al. 2018). A graph was created and shown with the hazard ratio (HR) and log-rank P values along with a 95% confidence interval. The Benjamini–Hochberg method was used to calculate the false-discovery rate (FDR) in order to consider multiple hypothesis testing. Every test was two-sided, and an adjusted P<0.05 defined a statistically significant difference.
2.7 Response to therapy
We utilized robust statistical techniques, specifically receiver operating characteristics (ROC) analysis, and Mann-Whitney tests, to rigorously find correlation between gene expression and therapy response. The ROC plotter online tool (https://www.rocplot.com/) was employed to confirm the association between RPS21 expression and the efficacy of numerous therapies commonly utilized in BC treatment, together with endocrine drugs (such as aromatase inhibitors and tamoxifen), anti-HER2 therapy drugs (like lapatinib and trastuzumab), as well as chemotherapies (including anthracycline, taxane, ixabepilone, etc).
2.8 Analysis of receiver operating characteristics (ROC) and area under the curve (AUC)
The ROC curve plots true vs negative-positive rate for each threshold setting, while the AUC assesses the test’s ability to differentiate between the two groups. A larger area under the ROC curve indicates higher accuracy in prediction of treatment response. AUC values exceeding 0.6 are deemed acceptable, those falling between 0.6 and 0.7 suggest a potential biomarker with clinical significance, values within the range of 0.7 to 0.8 indicate a good quality biomarker, and values surpassing 0.8 are indicative of a blockbuster cancer biomarker.
2.9 Real-time qPCR assay
We validated the expression of RPS21 gene by RTqPCR experiment at StepOnePlus RT-PCR system (ThermoFisher Scientific, USA). PowerUp™ SYBR™ Green Master Mix was used for quantification while GAPDH gene was used as reference and following primers were used for expression analysis: RPS21 (forward) 5ʹ-CAGGCTGTCCCATTGTGGAG-3ʹ and RPS21 (reverse) 5ʹ-CCAATGCGCACGGTAAAGTC-3ʹ, and GAPDH (forward) 5ʹ-TGAGGCTCCCACCTTTCTCA-3ʹ and (reverse) 5ʹ-GGCCATCCACAGTCTTCTGG-3ʹ. For expression analysis DataAssist™ Software was used to calculate initial Ct values and ΔΔCt method was used for relative and quantitative expression. Expression pattern of RPS21 was confirmed with RNA-seq results of bigger cohort in TCGA dataset using UALCAN portal (https://ualcan.path.uab.edu/index.html) (Chandrashekar et al. 2022).
2.10 Statistical analysis
SPSS version 24 was used to conduct statistical analyses. Student’s t-tests and ANOVA were employed to identify significant differential expression between BC and control. Prediction of prognostic importance of candidate genes were analyzed by the KM method. Additionally, the Mann-Whitney U test was used to assess response to therapy. Box-and-whisker plot was used for visualization, and significance was determined with a threshold of p < 0.05 (Fekete and Győrffy 2019).
3. Results
3.1 Identification of DEGs in breast cancer
We identified 870 significantly associated DEGs comprising 451 upregulated and 419 downregulated genes in Saudi BC patients after normalization of median value of each sample and significantly up and downregulated DEGs were shown in volcano plot and a HeatMap was generated by unsupervised hierarchical clustering (Fig. 1). LIMMA package of R was used for identification of DEGs having adjusted P value < 0.05 and log2FC >±1. Similarly, we identified 356 (151-up and 205-downregulated) and 338 (212-up and 126-downregulated) DEGs in American and Asian BC patients, respectively.
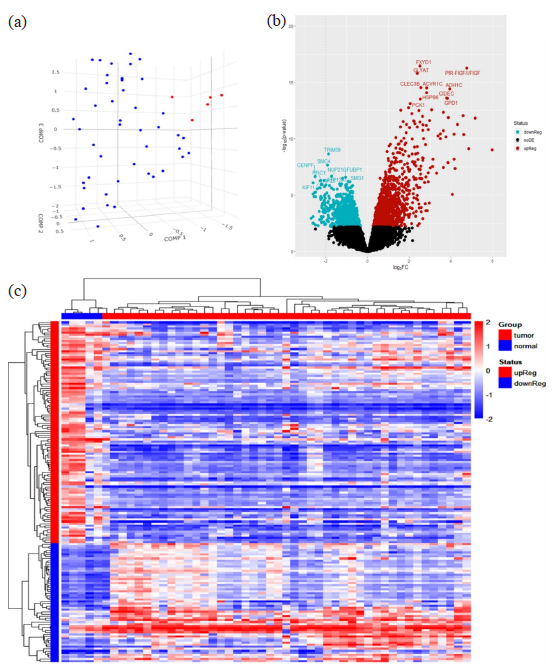
- Differentially expressed genes: (a) Principal Component Analysis (PCA) showing three-dimensional scatter plot grouping of samples according to overall similarity of microarray expression data of 45 breast cancer and five normal cases in blue and red color respectively, (b) Volcano Plot showing the up- and downregulated DEGs in red and blue color respectively, (c) Heatmap depicts the expression of genes across different samples in the microarray dataset where rows corresponds to genes and columns represent samples. Each cell’s color intensity reflects the normalized expression values, with darker shades signifying higher expression. Heatmap includes color bars alongside each column, that provide textual data about the samples, like tissue origin or experimental treatment.
3.2 Functional enrichment and ingenuity pathway analysis
To further conduct enrichment of the DEGs, IPA based pathway analysis was conducted to detect canonical pathways for three populations as well as merged datasets to find common pathways associated with BC. Interestingly, despite the difference in DEGs pattern in three datasets, we found hundreds of common pathways. Most inhibited pathways were associated with alteration of the cell cycle such as cell cycle checkpoints, mitotic metaphase and anaphase, mitotic prometaphase, mitotic G1 phase and G1/S transition and kinetochore metaphase signaling pathway. Prediction analysis showed the activation of molecular mechanisms of cancer, BC regulation by stathmin1, oxytocin signaling, G-Protein coupled receptor signaling and FAK signaling pathways to be strongly associated with BC (Table 1). To identify more significant canonical pathways associated with BC, we overlapped all predicted pathways and found three closely linked super-pathways including peptide chain elongation, cell cycle and molecular mechanism of cancer. Gene ontology and functional categorization of DEGs with over-representation analysis results revealed biological regulation, metabolic processes, and response to stimulus processes as top biological processes; protein binding, ion binding, and hydrolase activity as top molecular functions, and membrane and nucleus were enriched as the top cellular components.
| Ingenuity canonical pathways | -log(p-value) | z-score* | Associated genes |
|---|---|---|---|
| Cell Cycle Checkpoints | 19 | -7.181 | BIRC5, BLM, BRIP1, BUB1, BUB1B, BUB3,, KIF18A, KIF2C, KNL1, KNTC1, MAD2L1, MCM10CCNA2, CCNB1, CCNB2, CCNE2, CDC25C, CDC45, CDC6, CDCA8, CDK1, CDK2, CENPA, CENPE, CENPF, CENPI, CENPK, CENPO, CENPU, CHEK1, CLSPN, DNA2, EXO1, H2BC11, H2BC12, H2BC14, H2BC21, H2BC5, KIF18A, KIF2C, KNL1, KNTC1, MAD2L1, MCM10, MCM2, MCM4, MCM6, MCM8, NDC80, NUF2, NUP43, ORC1, ORC6, PLK1, PPP2R1B, PPP2R5A, PSMA5, PSMB4, PSMB8, PSME4, RFC3, RPS27A, SFN, SKA1, SKA2, SPC25, UBE2C, WEE1, ZWINT |
| Kinetochore Metaphase Signaling Pathway | 12.1 | -3.272 | BIRC5, BUB1, BUB1B, BUB3, CCNB1, CDCA8, CDK1, CENPA, CENPE, CENPK, CENPO, CENPU, ENSA, ESPL1, KIF2C, KNL1, KNTC1, SKA3, SPC25, TTK, ZWINT, MAD2L1, NDC80, NEK2, NUF2, PLK1, PPP1R14A, PPP2R5A, PTTG1, SKA1, SKA2, SKA3, SPC25, TTK, ZWINT |
| Mitotic Metaphase and Anaphase | 10.2 | -5.427 | BIRC5, BUB1, BUB1B, BUB3, CCNB1, CCNB2, CDCA5, CDCA8, CDK1, CENPA, CENPE, CENPF, CENPI, CENPK, CENPO, CENPU, ESPL1, KIF18A, KIF2C, KNL1, KNTC1, LMNB1, MAD2L1, NDC80, NUF2, NUP205, NUP43, PLK1, PPP2R1B, PPP2R5A, PSMA5, PSMB4, PSMB8, PSME4, PTTG1, RPS27A, SKA1, SKA2, SPC25, TMPO, TUBA1C, TUBB2A, UBE2C, ZWINT |
| Mitotic Prometaphase | 11.2 | -4.938 | BIRC5, BUB1, BUB1B, BUB3, CCNB1, CCNB2, CDCA5, CDCA8, CDK1, CENPA, CENPE, CENPF, CENPI, CENPK, CENPO, CENPU, KIF18A, KIF2C, KNL1, KNTC1, MAD2L1, MZT2B, NCAPG, NCAPH, NDC80, NEK2, NEK7, NUF2, NUP43, PLK1, PLK4, PPP2R1B, PPP2R5A, PRKAR2B, SKA1, SKA2, SMC2, SMC4, SPC25, TUBA1C, TUBB2A, ZWINT |
| Mitotic G1 phase and G1/S transition | 8.01 | -3.674 | CCNA2, CCNB1, CCNE2, CDC45, CDC6, CDK1, CDK2, CDKN1C, CDKN2B, CDKN2C, CDT1, E2F3, E2F5, MCM8, MYBL2, MYC, ORC1, ORC6, PCNA, PPP2R1B, PSMA5, PSMB4, PSMB8, RPS27A, RRM2, TOP2A, TYMS, WEE1 |
| Breast Cancer Regulation by Stathmin1 | 6.4 | 3.586 | ACKR1, ACKR3, ADGRA2, ADGRD1, ADGRF1, ADGRF5, ADGRG1, ADGRL4, ADRA1A, ADRA1D, ADRA2A, ARHGEF6, AURKA, CCR6, CCR8, CDK1, CDK2, CELSR1, CNR1, DRD1, E2F3, E2F5, EDNRB, FGF2, FOXM1, FZD1, FZD10, FZD4, GNG11, GNG2, GPR146, GPR156, GPR162, GPR171, GPR176, GPR21, GPR34, GPR4, HCAR3, HRH2, HTR1F, IGF1, JUN, LHCGR, LPAR1, MMP9, MRAS, NPY5R, OXGR1, OXTR, P2RY12, P2RY14, PPP1R14A, PPP2R1B, PPP2R5A, PRKAR2B, PRKCI, PTGER2, PTGER3, PTGFR, RASD1, RRAS2, S1PR1, SUCNR1, TACR1, TGFA, TUBA1C, TUBB2A, VEGFA, VEGFC |
| Molecular Mechanisms of Cancer | 9.06 | 3.483 | ACKR1, ACKR3, ADGRA2, ADGRD1, ADGRF1, ADGRF5, ADGRG1, ADGRL4, ADRA1A, ADRA1D, ADRA2A, ARHGEF6, AURKA, CCNE2, CCR6, CCR8, CDC25C, CDH1, CDK2, CDKN2B, CDKN2C, CELSR1, CHEK1, CNR1, DHH, DRD1, E2F3, E2F5, EDNRB, FANCD2, FGF2, FOS, FOXO1, FZD1, FZD10, FZD4, GAB2, GHR, GNAI1, GNG11, GNG2, GPR146, GPR156, GPR162, GPR171, GPR176, GPR21, GPR34, GPR4, HCAR3, HIPK2, HRH2, HTR1F, IGF1, IL11RA, IL1RL1, IL22RA2, ITGA1, ITGA7, ITGA8, ITGAX, ITGB3, JUN, LEF1, LHCGR, LPAR1, MAPK10, MAPK11, MMP11, MMP13, MMP9, MRAS, MYC, NPY5R, OXGR1, OXTR, P2RY12, P2RY14, PAK3, PRKAR2B, PRKCI, PRKDC, PTGER2, PTGER3, PTGFR, PTPN11, RASD1, RHOJ, RHOQ, RHOU, RND3, RRAS2, S1PR1, SMAD6, STK36, SUCNR1, TACR1, TCF7L2, TGFA, TGFBR2, VEGFA |
| Oxytocin Signaling Pathway | 5.79 | 4.323 | CACNA2D1, CACNB3, CCL5, CD36, EGFR, FOS, GNAI1, GNG11, GNG2, GUCY1A2, HSPB2, HSPB7, IL6, KCNA5, KCNJ8, LEP, LIPE, LPL, MAPK10, MAPK11, MAPK6, MRAS, MYH1, MYH9, MYL9, NOS3, NPR1, NPR3, OXTR, PLA2G2A, PLA2G4A, PNPLA2, PPARG, PPP1R14A, PRKAR2B, PRKCI, PTGFR, RASD1, ROCK2, RRAS2 |
| Focal Adhesion Kinase (FAK) Signaling | 1.9 | 4.146 | ACKR1, ACKR3, ACTR2, ACVR1C, ADGRA2, ADGRD1, ADGRF1, ADGRF5, ADGRG1, ADGRL4, ADRA1A, ADRA1D, ADRA2A, ARHGEF6, CAPN6, CCR6, CCR8, CDH1, CDH5, CELSR1, CNR1, COL10A1, COL1A1, DRD1, ECM1, ECM2, EDNRB, EFNA1, EGFR, FLT1, FOS, FZD1, FZD10, FZD4, GHR, GPR146, GPR156, GPR162, GPR171, GPR176, GPR21, GPR34, GPR4, HCAR3, HRH2, HTR1F, IL11RA, IL1RL1, IL22RA2, IL33, ITGA1, ITGA7, ITGA8, ITGAX, ITGB3, JUN, KIT, LEF1, LHCGR, LPAR1, MAPK10, MAPK11, mir7, MMP9, MRAS, MYC, NPY5R, OXGR1, OXTR, P2RY12, P2RY14, PAK3, PTEN, PTGER2, PTGER3, PTGFR, RASD1, RRAS2, S1PR1, SUCNR1, TACR1, TCF7L2, TGFBR2, TGFBR3 |
| G-Protein Coupled Receptor Signaling | 3.48 | 3.881 | ACKR1, ACKR3, ADGRA2, ADGRD1, ADGRF1, ADGRF5, ADGRG1, ADGRL4, ADRA1A, ADRA1D, ADRA2A, CCR6, CCR8, CELSR1, CNR1, DRD1, DUSP1, EDNRB, FOS, FOXO1, FZD1, FZD10, FZD4, GNAI1, GNG11, GNG2, GPR146, GPR156, GPR162, GPR171, GPR176, GPR21, GPR34, GPR4, GRK3, HCAR3, HRH2, HTR1F, JUN, LHCGR, LPAR1, MAPK10, MAPK11, MRAS, MYL9, NPR3, NPY5R, OXGR1, OXTR, P2RY12, P2RY14, PAK3, PDE1A, PDE2A, PDE3B, PDE7B, PREX2, PRKAR2B, PTGER2, PTGER3, PTGFR, RASD1, RGS2, ROCK2, RRAS2, S1PR1, SUCNR1, TACR1 |
3.3 Comparison analysis of DEGs in Arabian, American and Asian ethnic groups
Only six genes including topoisomerase (DNA) II alpha (TOP2A), ribonucleotide reductase regulatory subunit M2 (RRM2), hyaluronan mediated motility receptor (HMMR), tenomodulin (TNMD), C-X-C motif chemokine ligand 2 (CXCL2), and ribosomal protein S21 (RPS21) were common among Arabian, American and Asian ethnic groups, while 166 genes were present at least in two groups (Table 2, Fig. 2). The diagnostic and prognostic roles of TOP2A, RRM2, CXCL2, TNMD and HMMR in BC have been well reported earlier but that of RPS21 are still under investigation. The Venn diagram clearly indicates unique expression patterns in each population, but pathway analysis showed common BC associated pathways. In IPA study of DEGs, we found that RPS21 plays a key role in activation of EIF2 signaling [-log(p-value) =7.27, z-score = 1.21], mTOR signaling pathway [-log(p-value) = 4.47, z-score = 1.15], inhibition of eukaryotic translation initiation [-log(p-value) = 10.80, z-score = -1.26], eukaryotic translation elongation [-log(p-value) = 14.00, z-score = -1.25], and eukaryotic translation termination [-log(p-value) = 13.3, z-score = -1.09].
| Gene name | Symbol | Saudi Arabian | American | Asian | |||
|---|---|---|---|---|---|---|---|
| P-value | log2FC | P-value | log2FC | P-value | log2FC | ||
| Topoisomerase (DNA) II alpha | TOP2A | 0.0006 | -2.6140 | 0.0092 | -1.8141 | 0.0014 | -1.0335 |
| Ribonucleotide reductase regulatory subunit M2 | RRM2 | 0.00507 | -1.79194 | 0.0135 | -1.70919 | 2.21E-06 | -1.0927 |
| Hyaluronan mediated motility receptor | HMMR | 0.0241 | -1.6885 | 0.0046 | -1.6309 | 0.0019 | -1.0645 |
| Tenomodulin | TNMD | 6.53E-08 | 1.7350 | 0.0456 | 1.1642 | 4.27E-05 | 1.0009 |
| C-X-C motif chemokine ligand 2 | CXCL2 | 0.00157 | 2.3717 | 0.0033 | -4.0615 | 0.0046 | 1.0269 |
| Ribosomal protein S21 | RPS21 | 0.0295 | 1.1228 | 0.0021 | 1.2974 | 0.0062 | 1.2319 |
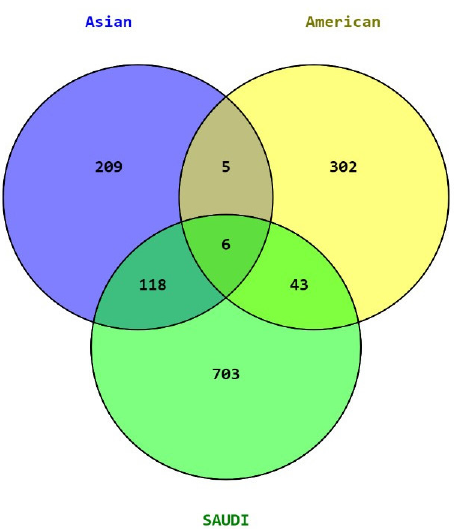
- Venn diagram of DEGs in Saudi Arabian, American, and Asian ethnic groups. DEGs: Differentially expressed genes.
3.4 Protein-Protein Interaction network
Initially selected 234 BC-associated DEGs were used for STRING analysis to get a full overview of their PPI networks and clues to their functions. STRING analysis of RPS21 resulted in 11 nodes and 55 edges in one cluster with PPI enrichment p-value of 8.86e-09 (Fig. 3).
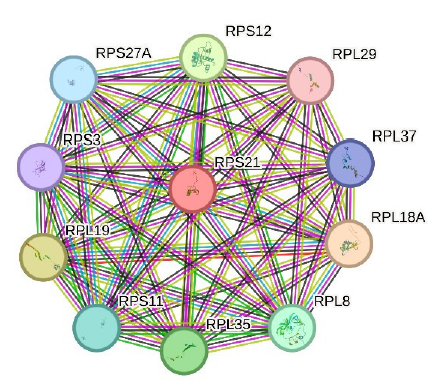
- PPI network of RPS21 shows a single cluster with 11 nodes and 55 edges. PPI: Protein-protein interaction.
3.5 Survival analysis of RPS21 in BC
Survival analysis of RPS21 expression using Kaplan–Meier plotter revealed a significant association with BC without any restriction to subtype using mRNA chip data for both RFS and OS with a median cut-off. We found HR (1.25 and 1.24) with CI (1.13-1.38 and 1.03-1.49) and Log-rank p-value (1.40E-05 and 2.25E-02) indicating RPS21 to be a significant prognostic indicator of BC for RFS and OS respectively (Fig. 4).
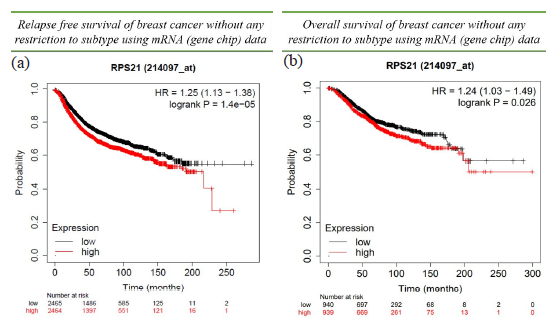
- Survival analysis using Kaplan–Meier plot for RPS21 gene: (a) Relapse-free survival (b) Overall survival of BC patients without any restriction to subtype using mRNA (gene chip) data.
3.6 Treatment response to various therapies
We investigated the correlation in BC amid RPS21 expression and therapeutic response, covering a range of therapies commonly employed in BC treatment, including aromatase inhibitors and tamoxifen for endocrine therapy, lapatinib and trastuzumab for targeted anti-HER2 therapy, and anthracycline, taxane, and ixabepilone for chemotherapy. Our analysis was based on dual robust statistical approaches: ROC analysis in addition to Mann-Whitney tests, with box plots used to visualize the differences between responders and non-responders across all therapies. Key quantitative findings, including the AUC, ROC, and Mann-Whitney test results for RPS21 expression, were logged as treatment response outcomes. In terms of endocrine therapy, specifically tamoxifen, our results showed exceptional efficacy (AUC=0.9, p = 2.3e-03), suggesting the likely utility of the gene as a BC biomarker (Fig. 5). Regarding anti-HER2 therapy, lapatinib exhibited potential clinical significance (AUC=0.67, p < 0.05) according to our analysis. However, for chemotherapy, both taxane (AUC = 0.53, p < 0.05) and anthracycline (AUC = 0.53, p < 0.05) did not show statistically significant treatment efficacy. Furthermore, the Mann-Whitney test results indicated that lapatinib under anti-HER2 therapy and anthracycline under chemotherapy advocate the potential of the RPS21 as a gene biomarker.
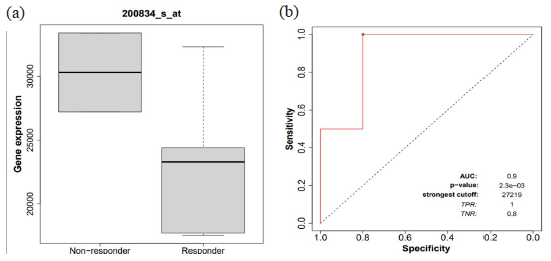
- Receiver operating characteristics (ROC) and area under the curve (AUC): (a) RPS21 gene expression among responders and non-responders of endocrine therapy by tamoxifen. (b) AUC of 0.9 with p-value 2.3e-03 as treatment response.
3.7 Validation of RPS21 expression by real-time qPCR
Quantitative PCR was done for RPS21 on 45 BC patients and five normal samples. We found significant over-expression (Rq or FC = 3.43, Log2FC = 1.78, p-value 0.0352). Thus, qPCR confirmed the RPS21 expression in microarray data (Log2FC = 1.12, p-value 0.029). Moreover, RNA-seq results also established RPS21 expression (transcript per million 2.131 and p value 1.588E-04) on a larger cohort of 1097 primary BC tumors at the TCGA platform (Fig. 6).

- (a) RT-qPCR result showing over-expression of RPS21 in BC, (b) RNA-Seq results from TCGA database at UALCAN portal also displaying RPS21 over-expression in BC. RT-qPCR: Reverse transcription quantitative polymerase chain reaction.
4. Discussion
Breast cancer, a complex disease, is initiated by the genetic, epigenetic, and transcriptomic changes resulting in dysregulation of signaling and regulatory networks. Detecting BC-associated pathways, deciphering these complex networks, and understanding their involvement in pathogenesis can lead to the identification of biomarkers for diagnosis and prognosis (Ciriello et al. 2015; Vishnubalaji et al. 2019; Yu et al. 2020). Although many mRNA expression-based studies have been conducted in several parts of the world to identify BC-related genes, biomarkers, and pathways (Dey et al. 2013; Kittaneh et al. 2013; Reis-Filho and Pusztai 2011), few have focused on the Arabian region (D’Arcy et al. 2015; Karim et al. 2022; Mirza et al. 2023).
Here comparative analysis of transcriptome data from Saudi Arabian, American, and Asian BC patients revealed 870, 658, and 567 DEGs, respectively. Only six genes were common (TOP2A, RRM2, CXCL2, TNMD, HMMR, and RPS21), while 166 genes were expressed in two groups. These mutually exclusive genes attracted attention since they could represent the variations between the three population groups and may potentially uniquely impact BC risk and disease graphs in the Saudi population. Therefore, expression data from each ethnic group was first analyzed individually and later as integrated expression profiles from all. Pathway analysis was used to comprehend BC pathobiology. Surprisingly, despite the difference in gene expression patterns, our IPA results from all groups showed the cell cycle checkpoints pathway to be most significantly altered in BC, followed by eukaryotic translation -initiation, -elongation, and -termination pathways. Additionally, mitotic metaphase and anaphase, mitotic prometaphase, mitotic G1 phase and G1/S transition, and kinetochore metaphase signaling pathway were also inhibited, whereas molecular mechanisms of cancer, BC regulation by stathmin1, oxytocin signaling, FAK signaling, GPCR signaling, molecular mechanisms of cancer, and mTOR signaling pathways were most activated. Our results suggest the importance of dysregulation of these pathways in breast carcinogenesis. Many signaling pathways implicated in BC pathogenesis have been previously reported (Dey et al. 2013; Karim et al. 2016; Kittaneh, Montero, and Glück 2013; Merdad et al. 2014; Merdad et al. 2015; Reis-Filho and Pusztai 2011).
Cell cycle checkpoints pathway: Each step of the cell cycle is strictly controlled by G1/S transition, G2/M transition, and spindle checkpoints to ensure equal division of chromosomes to daughter cells (Molinari 2000). The cell cycle involves prudently orchestrated steps, including prophase (chromosome condensation), metaphase (chromosome center alignment), anaphase (chromosome segregation to an opposite pole), and telophase (cytokinesis) (Lew 2013). It is an evolutionary conserved process essential for accurate genome replication, fair cell division, normal growth, and survival (Schatten 2013). Quiescent G0 state of cells requires stimuli to pass the G1/S transition, but overexpression of checkpoint genes (cyclin, cell division cycle, cyclin dependent kinase) or dysfunction of cell cycle signal drive G0 cells to be independent of stimuli. This can lead to genetic instability and cancerous behavior (Chaturvedi et al. 1999; Hall and Peters 1996; Hanahan and Weinberg 2011; Karlsson et al. 1999). In normal mitosis, kinetochores are required for proper segregation of chromosomes by binding to microtubules of the mitotic spindle (Herman et al. 2015). However, deregulation of the kinetochore metaphase signaling pathway causes chromosomal instability and initiation of cancer (Roschke and Rozenblum 2013; Santaguida and Musacchio 2009; Yoon et al. 2002). Dysfunction of cell-cycle associated genes and pathways is a major hallmark of cancer, and many of these genes/proteins have been identified as therapeutic biomarkers (Dominguez-Brauer et al. 2015).
RPS21 is a pivotal component of the 40s ribosome involved in cellular proliferation, DNA repair, transcription, and RNA processing. Inhibition or knockdown of RPs, including RPS21, have been linked to p53, CDK1, and EGFR and usually induce apoptosis, cell cycle arrest in the S phase, G0/G1 phase, G2-M phase or senescence (Chakraborty et al. 2011; Wang et al. 2019; Zhou et al. 2015). RPS21 was upregulated in several malignancies, including prostate cancer, osteosarcoma, and colorectal cancer (Liang et al. 2019; Wang et al. 2020; Wang et al. 2015). In the present study, we evaluated the RPS21 expression levels in BC to assess its potential clinical relevance, and diagnostic and prognostic value.
Inhibition of translation: Translation of mRNA to protein is another key phenomenon required for structural and regulatory functions via signaling pathways (Liu et al. 2022; Zhou et al. 2021). We observed the inhibition of translational initiation, translational elongation, and translational termination pathways suggesting their involvement in tumorigenesis and progression of BC. Interestingly, the PPI network done by means of STRING also showed ribosome-related genes (RPs27a, RPlp0, RPS21, RPS3a, RPs29, RPS14, Rpl34) binding directly or indirectly to each other, pointing to the fact that ribosomal genes may play an important role in BC (Luo et al. 2023; Szklarczyk et al. 2021).
We observed six common DEGs among three datasets, where TOP2A (An et al. 2018), RRM2 (Shi et al. 2022), HMMR (Shang et al. 2022), and CXCL2 (Boissière-Michot et al. 2020) had been reported as prognostic biomarkers in several studies. However, very few reports are available for RPS21 (Liang et al. 2019) and TNMD (Deng et al. 2019). We, therefore, conducted a survival analysis of RPS21 and TNMD expression, and RPS21 was found significant for both overall survival (2.25E-02) and disease-free survival (1.40E-05). KM plot showed that patients with increased expression of RPS21 gene had a higher propensity for BC, and hence, can be a potential prognostic biomarker. Somatic variants noted in RPS21, namely, E7Q, D28N, K41T, F46C, R60C, D66H, I78F, and K81N had moderate impact on the proteins’ structure and function. Association of these genetic variants with BC needs further investigation.
We are, for the first time, reporting the prognostic importance of RPS21 in BC. This gene codes for the small ribosomal subunit protein eS21, a small ribosomal subunit component that is a part of the large ribonucleoprotein complex responsible for the protein synthesis function (Anger et al. 2013; Behrmann et al. 2015). RPS21 protein is 83 amino acids in length and 9.1 kDa, is cytosolic, and found in ribosomes connected to the rough endoplasmic reticulum. Transcriptomic evidence available in The Human Protein Atlas suggests its presence in the breast myoepithelial and glandular epithelial cells. RPS21 has been recently reported as a diagnostic and prognostic biomarker for prostate cancer (Liang et al. 2019). RNA-binding proteins are recognized as important modulators of tumorigenesis, and RPS21 has been identified as overexpressed in the LumB BC subtype (Santiago et al. 2020). RPS21 can help predict likely disease outcomes (e.g., cancer recurrence, progression, death, and survival); hence, has potential to be used clinically as a prognostic biomarker for BC.
5. Conclusions
RPS21 is a potential prognostic biomarker for BC. Comparative analyses have shown only six DEGs (TOP2A, RRM2, CXCL2, TNMD, HMMR, and RPS21) common in Saudi Arabian, American, and Asian groups out of 870, 658, and 567 DEGs, respectively. However, despite the differences in expression patterns of the three populations, pathway enrichment analysis results showed common canonical pathways such as dysregulation of cell cycle and translation in these independent cohorts. Further investigations using comparative transcriptomic approaches are necessary to explore the molecular mechanisms driving breast tumorigenesis, studying the transcriptomics data of BC from different ethnicities. Hence, the present study unlocks formerly unfamiliar niches, which might aid in an improved understanding of the malignancy besides the development of possible therapeutic interventions.
Acknowledgments
This research work was funded by Institutional Fund Projects under grant no (IFPRC-137-141-2020). Therefore, authors gratefully acknowledge technical and financial support from the Ministry of Education and King Abdulaziz University, Jeddah, Saudi Arabia.
CRediT authorship contribution statement
Sajjad Karim: Concepts, Data Curation, Data Analysis, Experimental Studies, Data Acquisition, Manuscript Editing and Review; Fadwa Aljoud: Data Curation, Data Acquisition, Data Analysis, Literature Search, Manuscript Preparation, Investigation, Methodology; Najla Alburae: Concepts, Data Curation, Manuscript Editing and Review; Mohammed Habibur Rahman Molla: Data Curation, Literature Search; Nofe Alganmi: Concepts, Design, Statistical Analysis, Manuscript Editing and Review; Zeenat Mirza: Data Curation, Literature Search, Experimental Studies, Manuscript Preparation, Manuscript Editing and Review. All authors approved the final version of the manuscript.
Declaration of competing interest
The authors declare that they have no known competing financial interests or personal relationships that could have appeared to influence the work reported in this paper.
Data availability
All the data used in current study is publicly available at Gene Expression Omnibus (https://www.ncbi.nlm.nih.gov/geo/). However, additional information and normalized data can be provided upon request.
Declaration of Generative AI and AI-assisted technologies in the writing process
The authors confirm that there was no use of artificial intelligence (AI)-assisted technology for assisting in the writing or editing of the manuscript and no images were manipulated using AI.
References
- The prognostic significance of topoisomerase II alpha protein in early stage luminal breast cancer. BMC Cancer. 2018;18:331.
- [CrossRef] [PubMed] [PubMed Central] [Google Scholar]
- Structures of the human and drosophila 80S ribosome. Nature. 2013;497:80-85.
- [CrossRef] [PubMed] [Google Scholar]
- Current and future burden of breast cancer: Global statistics for 2020 and 2040. Breast. 2022;66:15-23.
- [CrossRef] [PubMed] [PubMed Central] [Google Scholar]
- Structural snapshots of actively translating human ribosomes. Cell. 2015;161:845-857.
- [CrossRef] [PubMed] [PubMed Central] [Google Scholar]
- Prognostic value of CXCR2 in breast cancer. Cancers (Basel). 2020;12:2076.
- [CrossRef] [PubMed] [PubMed Central] [Google Scholar]
- Race, breast cancer subtypes, and survival in the carolina breast cancer study. JAMA. 2006;295:2492-2502.
- [CrossRef] [PubMed] [Google Scholar]
- Guarding the ‘translation apparatus’: Defective ribosome biogenesis and the p53 signaling pathway. Wiley Interdiscip. Rev. RNA. 2011;2:507-522.
- [CrossRef] [PubMed] [Google Scholar]
- UALCAN: An update to the integrated cancer data analysis platform. Neoplasia. 2022;25:18-27.
- [CrossRef] [PubMed] [PubMed Central] [Google Scholar]
- Mammalian Chk2 is a downstream effector of the ATM-dependent DNA damage checkpoint pathway. Oncogene. 1999;18:4047-4054.
- [CrossRef] [PubMed] [Google Scholar]
- Comprehensive molecular portraits of invasive lobular breast cancer. Cell. 2015;163:506-519.
- [CrossRef] [PubMed] [PubMed Central] [Google Scholar]
- Race-associated biological differences among Luminal A breast tumors. Breast Cancer Res. Treat.. 2015;152:437-448.
- [CrossRef] [PubMed] [PubMed Central] [Google Scholar]
- Identification of potential crucial genes and key pathways in breast cancer using bioinformatic analysis. Front Genet. 2019;10:695.
- [CrossRef] [PubMed] [PubMed Central] [Google Scholar]
- Wnt signaling in triple negative breast cancer is associated with metastasis. BMC Cancer. 2013;13:537.
- [CrossRef] [PubMed] [PubMed Central] [Google Scholar]
- Microarray analysis after RNA amplification can detect pronounced differences in gene expression using limma. BMC Genomics. 2006;7:252.
- [CrossRef] [PubMed] [PubMed Central] [Google Scholar]
- Targeting mitosis in cancer: Emerging strategies. Mol. Cell. 2015;60:524-536.
- [CrossRef] [PubMed] [Google Scholar]
- Transcriptomic landscape of breast cancers through mRNA sequencing. Sci. Rep.. 2012;2:264.
- [CrossRef] [PubMed] [PubMed Central] [Google Scholar]
- ROCplot.org: Validating predictive biomarkers of chemotherapy/hormonal therapy/anti-HER2 therapy using transcriptomic data of 3,104 breast cancer patients. Int. J. Cancer. 2019;145:3140-3151.
- [CrossRef] [PubMed] [Google Scholar]
- Global cancer observatory: Cancer today. Lyon, France: International Agency for Research on Cancer; 2024. [accessed 2024 Jan 1]. Available from: https://gco.iarc.who.int/media/globocan/factsheets/populations/682-saudi-arabia-fact-sheet.pdf
- Molecular mechanisms, biomarkers and emerging therapies for chemotherapy resistant TNBC. Int. J. Mol. Sci.. 2022;23:1665.
- [CrossRef] [PubMed] [PubMed Central] [Google Scholar]
- Genetic alterations of cyclins, cyclin-dependent kinases, and cdk inhibitors in human cancer. Adv. Cancer Res.. 1996;68:67-108.
- [CrossRef] [PubMed] [Google Scholar]
- Hallmarks of cancer: The next generation. Cell. 2011;144:646-674.
- [CrossRef] [PubMed] [Google Scholar]
- Molecular pathways: regulation and targeting of kinetochore-microtubule attachment in cancer. Clin. Cancer Res.. 2015;21:233-239.
- [CrossRef] [PubMed] [PubMed Central] [Google Scholar]
- Low expression of leptin and its association with breast cancer: A transcriptomic study. Oncol. Rep.. 2016;36:43-48.
- [CrossRef] [PubMed] [PubMed Central] [Google Scholar]
- Development of ‘Biosearch system’ for biobank management and storage of disease associated genetic information. Journal of King Saud University - Science. 2022;34:101760.
- [Google Scholar]
- Cdc25B and Cdc25C differ markedly in their properties as initiators of mitosis. J. Cell Biol.. 1999;146:573-584.
- [CrossRef] [PubMed] [PubMed Central] [Google Scholar]
- Molecular profiling for breast cancer: A comprehensive review. Biomark-Cancer. 2013;5:BIC.S9455.
- [Google Scholar]
- Kaplan-Meier survival analysis overestimates cumulative incidence of health-related events in competing risk settings: A meta-analysis. J. Clin. Epidemiol.. 2018;93:25-35.
- [CrossRef] [PubMed] [Google Scholar]
- A low-density DNA microarray for analysis of markers in breast cancer. Int. J. Biol. Markers. 2002;17:5-23.
- [CrossRef] [PubMed] [Google Scholar]
- Cell cycle. In: Maloy S., Hughes K., eds. Brenner’s encyclopedia of genetics (Second Edition). San Diego: Academic Press; 2013.
- [Google Scholar]
- Non-Invasive biomarkers for early detection of breast cancer. Cancers (Basel). 2020;12:2767.
- [CrossRef] [PubMed] [PubMed Central] [Google Scholar]
- Identification of candidate diagnostic and prognostic biomarkers for human prostate cancer: RPL22L1 and RPS21. Med. Oncol.. 2019;36:56.
- [CrossRef] [PubMed] [Google Scholar]
- The molecular landscape of premenopausal breast cancer. Breast Cancer Res.. 2015;17:104.
- [CrossRef] [PubMed] [PubMed Central] [Google Scholar]
- Annotating breast cancer microarray samples using ontologies. AMIA Annu. Symp. Proc.. 2008;2008:414-418.
- [PubMed] [PubMed Central] [Google Scholar]
- Unconventional protein post-translational modifications: The helmsmen in breast cancer. Cell Biosci. 2022;12
- [CrossRef] [PubMed] [PubMed Central] [Google Scholar]
- Multifaceted functions of RPS27a: An unconventional ribosomal protein. J. Cell. Physiol.. 2023;238:485-497.
- [CrossRef] [PubMed] [Google Scholar]
- Expression of matrix metalloproteinases (MMPs) in primary human breast cancer: MMP-9 as a potential biomarker for cancer invasion and metastasis. Anticancer Res.. 2014;34:1355-66.
- [PubMed] [Google Scholar]
- Transcriptomics profiling study of breast cancer from kingdom of saudi arabia revealed altered expression of adiponectin and fatty acid binding Protein4: Is lipid metabolism associated with breast cancer? BMC Genomics 16 Suppl. 2015;1:S11.
- [CrossRef] [Google Scholar]
- Identification of novel diagnostic and prognostic gene signature biomarkers for breast cancer using artificial intelligence and machine learning assisted transcriptomics analysis. Cancers (Basel). 2023;15:3237.
- [CrossRef] [PubMed] [PubMed Central] [Google Scholar]
- Cell cycle checkpoints and their inactivation in human cancer. Cell Prolif.. 2000;33:261-274.
- [CrossRef] [PubMed] [PubMed Central] [Google Scholar]
- Clinical and microarray analysis of breast cancers of all subtypes from two prospective preoperative chemotherapy studies. Br. J. Cancer. 2016;115:411-419.
- [CrossRef] [PubMed] [PubMed Central] [Google Scholar]
- A multigene assay to predict recurrence of tamoxifen-treated, node-negative breast cancer. N. Engl. J. Med.. 2004;351:2817-2826.
- [CrossRef] [PubMed] [Google Scholar]
- Gene expression profiling in breast cancer: Classification, prognostication, and prediction. The Lancet. 2011;378:1812-1823.
- [CrossRef] [Google Scholar]
- Trastuzumab plus adjuvant chemotherapy for operable HER2-positive breast cancer. N. Engl. J. Med.. 2005;353:1673-1684.
- [CrossRef] [PubMed] [Google Scholar]
- Multi-layered cancer chromosomal instability phenotype. Front Oncol. 2013;3:302.
- [CrossRef] [PubMed] [PubMed Central] [Google Scholar]
- The life and miracles of kinetochores. EMBO J.. 2009;28:2511-2531.
- [CrossRef] [PubMed] [PubMed Central] [Google Scholar]
- In silico analyses reveal new putative breast cancer RNA-binding proteins. bioRxiv 2020 2020.01.08.898965
- [Google Scholar]
- Mitosis. In: Maloy S., Hughes K., eds. Brenner’s encyclopedia of genetics (2nd edition). San Diego: Academic Press; 2013.
- [Google Scholar]
- Regulation patterns in signaling networks of cancer. BMC Syst. Biol.. 2010;4:162.
- [CrossRef] [PubMed] [PubMed Central] [Google Scholar]
- HMMR potential as a diagnostic and prognostic biomarker of cancer-speculation based on a pan-cancer analysis. Front Surg. 2023;9:998598.
- [CrossRef] [PubMed] [PubMed Central] [Google Scholar]
- High RRM2 expression has poor prognosis in specific types of breast cancer. PLoS One. 2022;17:e0265195.
- [CrossRef] [PubMed] [PubMed Central] [Google Scholar]
- Pathway-based analysis of breast cancer. Am J Transl Res. 2014;6:302-311.
- [PubMed] [PubMed Central] [Google Scholar]
- Global cancer statistics 2020: GLOBOCAN estimates of incidence and mortality worldwide for 36 cancers in 185 countries. CA. Cancer J. Clin.. 2021;71:209-249.
- [CrossRef] [PubMed] [Google Scholar]
- The STRING database in 2021: Customizable protein-protein networks, and functional characterization of user-uploaded gene/measurement sets. Nucleic Acids Res,. 2021;49:D605-d12.
- [CrossRef] [PubMed] [PubMed Central] [Google Scholar]
- Integrated transcriptome and pathway analyses revealed multiple activated pathways in breast cancer. Front Oncol. 2019;9:910.
- [CrossRef] [PubMed] [PubMed Central] [Google Scholar]
- The ribosomal protein RPLP0 mediates PLAAT4-induced cell cycle arrest and cell apoptosis. Cell Biochem. Biophys.. 2019;77:253-260.
- [CrossRef] [PubMed] [Google Scholar]
- Down-Regulation of ribosomal protein RPS21 inhibits invasive behavior of osteosarcoma cells through the inactivation of MAPK pathway. Cancer Manag Res. 2020;12:4949-4955.
- [CrossRef] [PubMed] [PubMed Central] [Google Scholar]
- RPS24 knockdown inhibits colorectal cancer cell migration and proliferation in vitro. Gene. 2015;571:286-291.
- [CrossRef] [PubMed] [Google Scholar]
- ‘Breast cancer’, [accessed 2024 Feb 7]. Available from: https://www.who.int/news-room/fact-sheets/detail/breast-cancer.
- Variable levels of chromosomal instability and mitotic spindle checkpoint defects in breast cancer. Am. J. Pathol.. 2002;161:391-397.
- [CrossRef] [PubMed] [PubMed Central] [Google Scholar]
- Screening of prognostic factors in early-Onset breast cancer. Technol. Cancer Res. Treat.. 2020;19:1533033819893670.
- [CrossRef] [PubMed] [PubMed Central] [Google Scholar]
- Protein function prediction based on PPI networks: Network reconstruction vs edge enrichment. Front Genet. 2021;12:758131.
- [CrossRef] [PubMed] [PubMed Central] [Google Scholar]
- Ribosomal proteins: Functions beyond the ribosome. J. Mol. Cell. Biol.. 2015;7:92-104.
- [CrossRef] [PubMed] [PubMed Central] [Google Scholar]


