

Translate this page into:
Validation of GAMOS code based on Geant4 Monte Carlo for a 12 MV Saturne43 Linac
⁎Corresponding author at: Radiations and Nuclear Systems Laboratory, Abdelmalek Essaadi University, Faculty of Sciences, Tetouan, Morocco. jalzain@uae.ac.ma (Jamal Al Zain)
-
Received: ,
Accepted: ,
This article was originally published by Elsevier and was migrated to Scientific Scholar after the change of Publisher.
Peer review under responsibility of King Saud University.
Abstract
The Monte Carlo method is considered the most accurate method for dose calculation in radiotherapy. The Linear accelerator (Linac) is currently the most widely used in radiotherapy center machines. This study aims at validating the GAMOS code based on the Geant4 Monte Carlo toolkit. A Saturne43 LINAC of 12 MV photon beam was modeled for configuring a 10 × 10 cm2 radiation field. The electron beam parameters such as spot size and mean energy were tuned by comparing calculated dose distribution within homogenous water phantom with a measured one. The results obtained showed that the depth dose and lateral dose profiles are sensitive to the electron beam parameters studied. The best matching with measured was found when the appropriate mean electron energy and beam width were 11.8 MeV and 2 mm respectively.
Keywords
GAMOS
LINAC
Monte Carlo
Phase space
Dose distribution
FreeWRL

1 Introduction
Accurate calculation of dose distribution in the treatment planning system (TPS) process is the most important step to succeed in radiotherapy. For this purpose, Monte Carlo simulation is a powerful tool and widely used in medical applications for dose calculation (Verhaegen and Seuntjens, 2003), especially after the development of Variance Reduction Techniques (VRTs), which allow in achieving an acceptable accuracy in the simulations, even in geometries as complex as realistic tumor shapes. Currently, four general purpose Monte Carlo systems are in use for radiotherapy dose calculation. These codes are EGS (Kawrakow and Rogers, 2000; Nelson et al., 1985), MCNP (Briesmeister, 2000), PENELOPE (Salvat et al., 2001), and Geant4 (Agostinelli et al., 2003). Two codes, EGS and PENELOPE, simulate the coupled transport of photons and electrons (and positrons), while other particles such as neutrons or protons are not taken into account. The advantage of this is that during the development of these codes all attention was focused on the particles of interest for radiotherapy dose planning. On the other hand, when the energy of photon beams is more than 10 MV, neutrons will be producing from the accelerator head, which may impact the physical dose distribution in the patient, especially in the bone where even alpha particles have a non-negligible contribution (Reynaert, 2006). The other codes, MCNP and Geant4, simulate the transport of photon, electron, neutron, proton, and heavy particles.
For the Geant4 MC Code, many codes were developed for special purposes such as Gate, GAMOS, and so on. In this work, our calculations have been performed using the GAMOS code. The acronym GAMOS stands for “Geant4-based Architecture for Medicine-Oriented Simulations.” It is therefore a Monte Carlo simulation software and is based on the Geant4 toolkit. The objective of GAMOS is to provide a software framework that serves the unexperienced user to simulate his/her project without having to code in C++ and with a minimal knowledge of Geant4. At the same time, it lets an advanced user to add new functionalities and easily integrate it with the rest of the GAMOS functionality (Arce et al., 2008). GAMOS is composed of a core software that covers the main functionality of a Geant4 simulation and a set of applications for specific domains.
In this present work, we used the GAMOS MC Code to model a SATURNE43 Linac of 12 MV photon beam and investigate the influence of electron beam parameters on dose distributions.
2 Materials and method
A GAMOS platform (Arce et al., 2008), which is based on the Geant4 Monte Carlo technique (Agostinelli et al., 2003), was used to model the treatment head of the Sturne43 Linear accelerator for simulating a 12 MV photon beam. The materials and geometrical data considered for the Saturne43 Linac head were provided by the CEA LIST LNHB (Henri Becquerel laboratory). The treatment head components included the target, primary collimator of composite material WNiCu (W, Ni, Cu) and XC10 (C, Mn, Fe) to limit the dose to the maximum usable field size, flattening filter of stainless steel used to generate a beam of uniform intensity, secondary collimator of Pb, monitor unit chamber of Kapton, aluminum plaque, and finally the X and Y jaws that are composite of a mixture of WNiCu, XC 10 and Pb. A 40 × 40 × 40 cm3 water phantom was used to include enough backscatter material from the bottom and walls of the phantom. It was divided into 80 × 80 × 80 voxels (slices) in the x-axis that was in the cross plane direction; the y-axis was in the plan direction and the z-axis was in the beam (depth) direction. The size of the phantom’s voxel (xyz) were defined depending on the required spatial resolution for model commissioning. The voxel dimensions were 0.5 × 0.5 × 0.5 cm3 for both depth and profile calculation. The water phantom was placed at 90 cm from the target and the square field size of 10 × 10 cm2 was considered at 100 cm. IAEA, 2000 (International Atomenergie-Organisation, 2004). The GAMOS Linac head model and the water phantom positioned at 100 cm source to the surface distance (SSD) is presented in Fig. 1.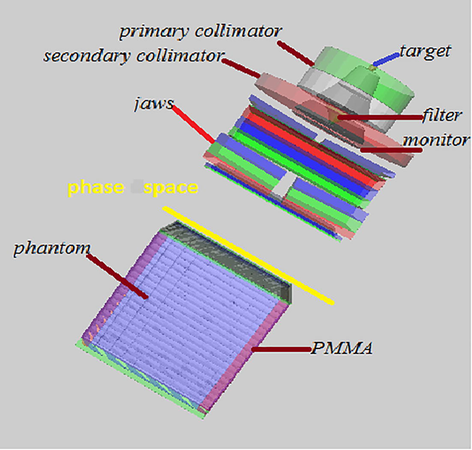
Monte Carlo GAMOS model of SATURNE43 Linac for 12 MV photon beam and water phantom, using FreeWRL.
The simulations of photon beams were carried out in the following two steps: The first one consists of simulating the photon beam to generate phase space files under the treatment head, which will be used later. In the second step, the phase space files generated will be used as virtual sub-sources of particles, which would deliver on the water phantom. The GAMOS model of SATURNE43 with the water phantom is presented in Fig. 1. 3D visualization of the Linac head geometry is processed using the graphics system FreeWRL-3.0.0 (“FreeWRL”).
Simple splitting of bremsstrahlung and ECUT parameters were used to reduce the variance of calculation and the simulation time. Also, the phase space file was set for collection of particles passing through a surface of plane at any point in our transport geometry (phase space at 90 cm), as can be seen in Fig. 1. A phase space file contains full information (charge, energy, position and direction) about the particles crossing the scoring plane as well (Ahmed et al., 2014). Using the Phase space technique can save a lot of time in cases where several calculations share some accelerator parts, and in the case where the accelerator simulation is very slow compared to the dose calculation (Jabbari et al., 2013). We have used the following two simple text formats in the GAMOS code: a comma-separated value (CSV) format, and a simpler text format that contains only the histogram limits and the list of histogram entries, one per column. Nevertheless, GAMOS also provides histograms directly written in ROOT (Antcheva et al., 2011) format, as this is a C++ analyze package, which many Geant4 users are familiar with. In order to present results, we used the program Matlab to extract the data from the file 3ddose.out in this work.
3 Dose calculation
To calculate the delivered dose in the water tank, the cubic phantom was divided into voxels, whose dimensions were 0.5 × 0.5 × 0.5 cm3 and placed at (z = 90 cm). The number of voxels along X axis and Y were 80 voxels from −20 cm to 20 cm, and the number of voxels along Z axis was 80 voxels. The depth dose curves were calculated along the central axis and the beam profiles were calculated at a depth of axis perpendicular to the central axis of the irradiation field of 10 × 10 cm2.
In this present work, the results obtained were normalized to the dose at a depth of 10 cm (D10cm). Then, these curves were compared against measured ones. The difference between them was analyzed using relative error criteria (Low et al., 1998).
4 Results and discussion
The calculated dose by MC GAMOS was associated with statistical uncertainties, which was less than 1% for all depth points, less than 1% inside field, and less than 1.5% out-off field for beam profiles. Depth dose curves were normalized to the dose at 10 cm and beam profiles to the dose at central axes.
5 Determining the energy of the electron beam mono-energetic
The first parameter determined is the energy of the electron beam at uniform distribution. We tested 4 energy values distributed in the range of 11.5–12 MeV and in the step beam width that was set to 1 mm. Each test will be conducted in three steps. In the first step, we construct the phase spaces for these energies. The second step is to calculate the dose in function of the depth in the water phantom, the dose deposited by each phase space for a field size of 10 × 10 cm2, and the SSD of water (90 cm). The third step is to compare the depth dose and the dose profiles calculated to those measured for the Saturne43 accelerator (Mohammed et al., 2018). The results obtained from the four simulations are presented in Fig. 2.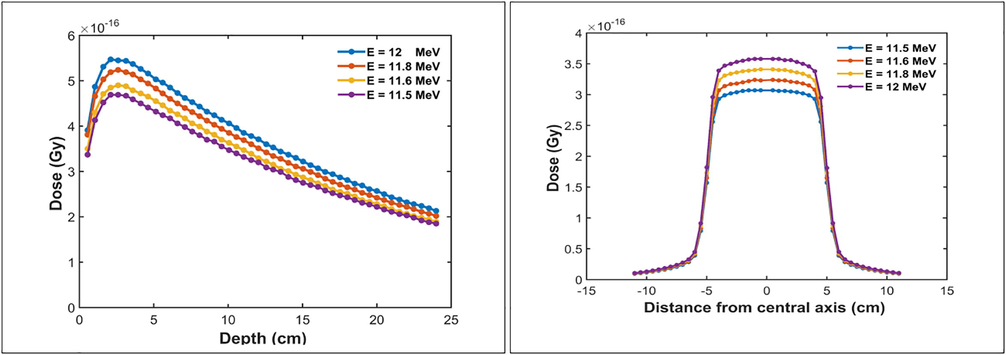
Variation of the absorbed dose with depth and the dose profile with the energies.
Fig. 2 gives the calculated dose depth and the dose profile for different energies of the electron beam respectively. It is clear that the depth dose and beam profiles are affected by electron beam energy. We have just chosen same energy values for the purpose of a readable presentation in these figures, with the aim of studying the evolution of the depth dose and the dose profiles as a function of the energy of the beam. To select the optimum energy value, the normalized dose distributions are compared with the measured date as shown in Fig. 3 and the results obtained are analyzed for the depth dose. We add the following two criteria: the depth of maximum dose Dmax and the quality index by calculating the relative error Δ corresponding to the difference between the quality index calculated and measured with respect to the measured quality index. The summary of the following comparison tests is represented in Table 1: relative error for the PDD and the estimated Dmax depths.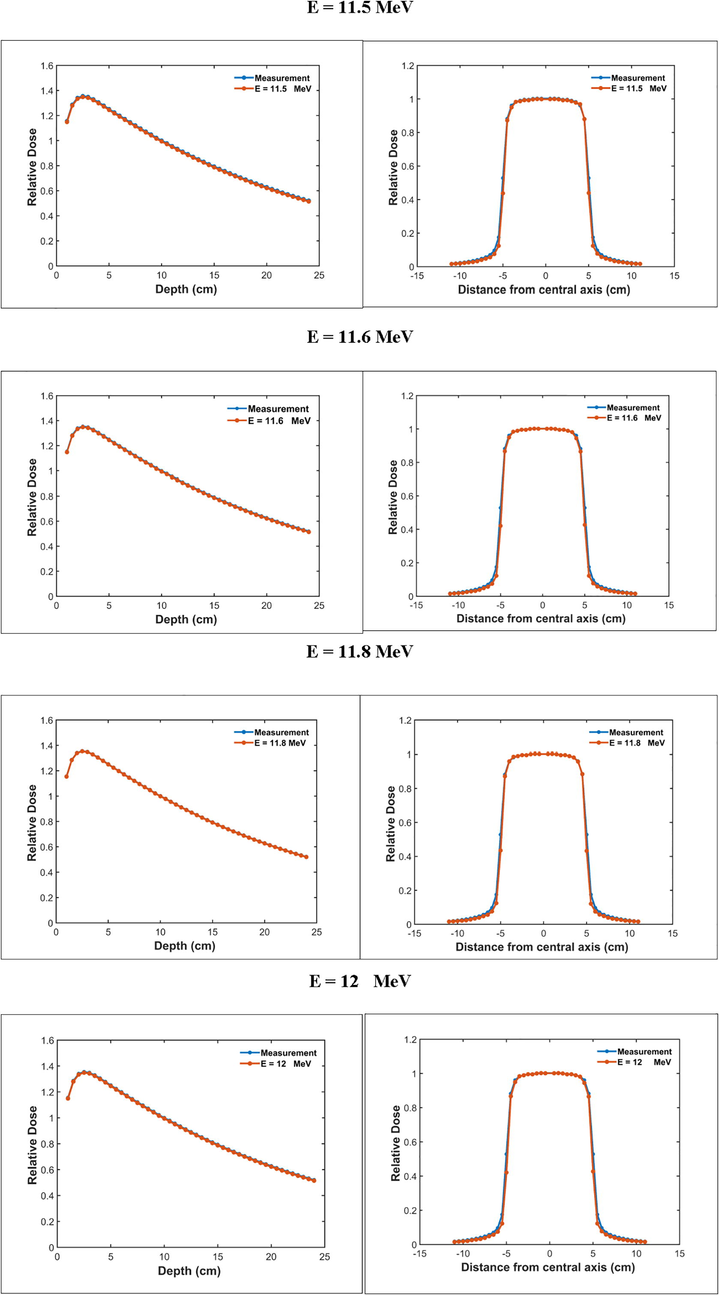
Comparison of relative depth dose and beam profiles calculated by GAMOS code and measured for different energies, filed size 10 × 10 cm2; results are normalized to the dose at the depth of 10 cm.
Compared quantities
Experimental measurements (reference)
Incident mono-energetic of the electron beam (MeV)
11.5
11.6
11.8
12
TPR20/10 relative difference
–
0.0046
0.0054
0.0022
0.0045
Dmax(cm)
2.50
2.50
2.50
2.50
2.50
One has to select the optimal mono-energetic, since the depth dose distribution is more affected by the energy of primary electrons (Mohammed et al., 2018). In Table 1 we notice that the smallest relative difference 0.0022% is obtained for energy 11.8 MeV. So, this energy, considered as the optimal electron beam energy, gives the best agreement with measured data.
6 Determining the beam width distribution (spot size)
To select the optimal width of electron beam, dose distributions were calculated for different FWHM values and the initial energy was set to that obtained in the first step (E = 11.8 MeV). The dose distributions, which are depth dose and lateral dose profile, were calculated for a square field of 10 × 10 cm2 defined at 100 cm from the target. Several beam width values (FWHM), from 2 to 4 mm, were simulated. This is in accordance with the study of (Mohammed et al., 2018). The obtained results are normalized and compared to experimental data, as shown in Fig. 4. Also, relative error and depth of maximum dose are employed to analyze and calculate the difference with measurements. The results obtained from quantities of this analysis show that the best matching with measured data was found when FWHM was 2 mm. On the other hand, we notice that the depth dose curves were less sensitive to beam width variation, whereas beam profiles were sensitive to this parameter variation.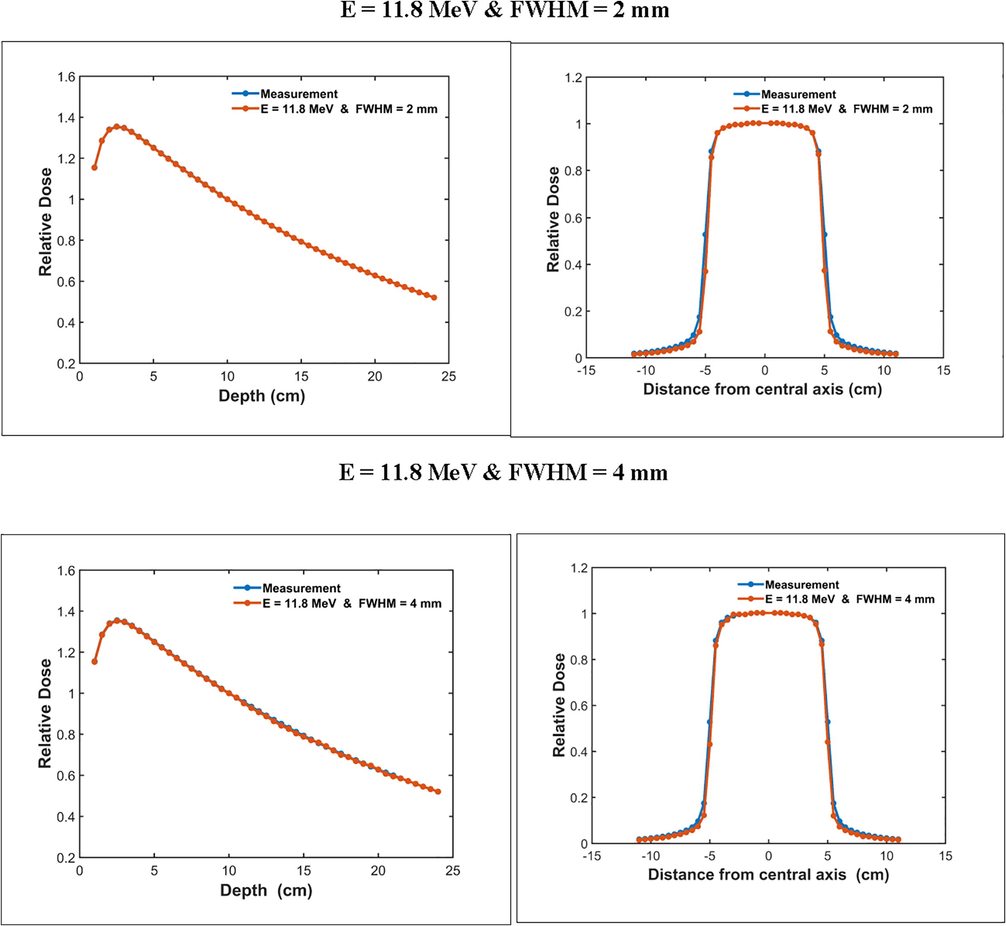
Comparison of calculated and measured relative depth dose and beam profiles for 11.8 MeV electron energy, beam spot radius of 2 and 4 mm, and filed size 10 × 10 cm2; results are normalized to the dose at the depth of 10 cm.
Finally; a full phase space file was simulated and the dose distributions (depth dose and beam profile) have been calculated for a 10 × 10 cm2 field size, when the initial electrons beam parameters are set to the best combination (E = 11.8 MeV, R = 2 mm). Calculated PDDs curves and beam profiles are compared to measured curves as illustrated in Fig. 5.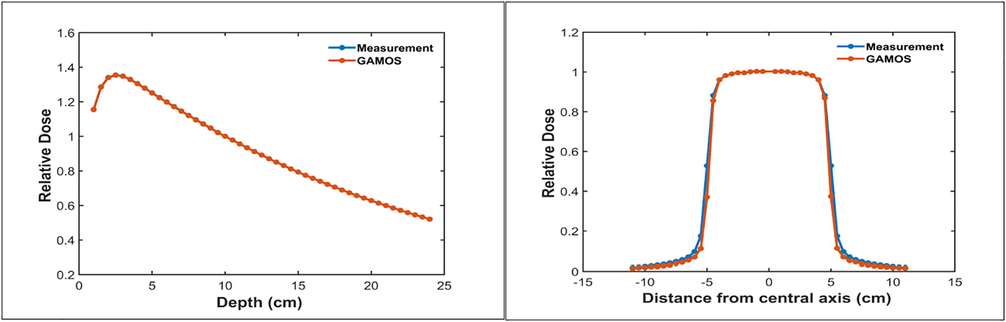
Relative depth dose curves and beam profiles calculated with optimal initial beam parameters compared with measured data.
Fig. 5 shows the simulated and measured profiles and percent depth dose curves of 12 MV photon beam for the square field of 10 × 10 cm2. Unfortunately, the manufacturer did not provide us with the experimental data of other fields to verify whether the results obtained in the 10 × 10 cm2 size field can be circulated to all fields.
7 Photon energy spectra
The MC method is a convenient and accurate tool, allowing the calculation of spectra possessing the essential features of the photon spectra. Photon energy spectra of the Saturne43 treatment head was calculated with GAMOS, using GPS generator. The X-ray energy spectrum was obtained using optimal combination of electron beam parameters, which is E = 11.8 MeV. Fig. 6 shows the photon energy spectra calculated at Z = 90 cm, using Matlab.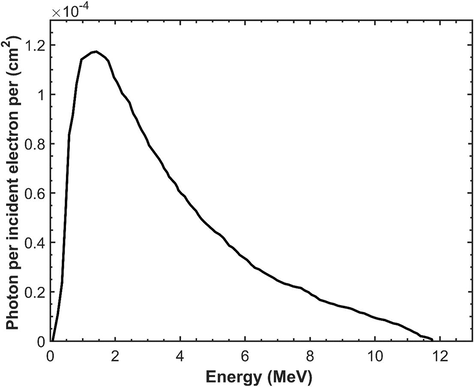
Monte Carlo calculated photon spectrum at SSD of 90 cm for 11.8 MV photon beam.
The energy spectrum P (E) of photon beam is characterized by three parameters: the maximum energy, the most probable energy, and the mean energy. In this study, we focus only on the mean energy value of the spectrum considered as an important quantity in TPS calculations. The calculated photon spectrum has a mean energy of 3.30 MeV inside the identified square field. The results obtained are compared to those found in previous studies realized by different MC codes, and summarized in Table 2.
Code
Mean energy
GAMOS (This work)
3.30
MCNP Zoubair et al. (2013)
3.39
Geant4 El Bakali (2014)
3.34
Penelope Blazy et al. (2006)
3.24
Table 2 shows that our results are close to those obtained by other codes especially with MCNP and Geant4 (Blazy et al., 2006; Zoubair et al., 2013; El Bakali, 2014). So, we can say that GAMOS model of SATURNE43 medical accelerator is accurately simulated and the initial parameters of electron beam were determined precisely.
8 Conclusion
The Monte Carlo simulation of the treatment head of the Saturne43 machine was successfully modeled using the Geant4 based GAMOS code. We validated the GAMOS Monte Carlo model of SATURNE43 Linac for simulating a 12 MV photon beam with a 10 × 10 cm2 field size. The best electron beam parameters were determined accurately. We found that the two dosimetric functions, PDD and beam profiles, were very important in calculating the adjustment of the electron beam parameters. The best matching between MC calculated dose functions and measured ones was found with electron mean energy and beam width of 11.8 MeV and 2 mm respectively.
References
- Geant4—a simulation toolkit. Nucl. Instrum. Methods Phys. Res. Sect. Accel. Spectrometers Detect. Assoc. Equip.. 2003;506:250-303.
- [CrossRef] [Google Scholar]
- Implementation of the EGSnrc/BEAMnrc Monte Carlo code-Application to medical accelerator SATURNE43. Int. J. Innov. Appl. Stud.. 2014;6:635.
- [Google Scholar]
- ROOT — A C++ framework for petabyte data storage, statistical analysis and visualization. Comput. Phys. Commun.. 2011;182:1384-1385.
- [CrossRef] [Google Scholar]
- GAMOS: A Geant4-based easy and flexible framework for nuclear medicine applications. In: 2008 IEEE Nuclear Science Symposium Conference Record. Presented at the 2008 IEEE Nuclear Science Symposium Conference Record; 2008. p. :3162-3168. 10.1109/NSSMIC.2008.4775023
- [Google Scholar]
- Internationale Atomenergie-Organisation, ed. Commissioning and quality assurance of computerized planning systems for radiation treatment of cancer, Technical reports series / International Atomic Energy Agency. Vienna: International Atomic Energy Agency; 2004.
- Comparison of PENELOPE Monte Carlo dose calculations with Fricke dosimeter and ionization chamber measurements in heterogeneous phantoms (18 MeV electron and 12 MV photon beams) Phys. Med. Biol.. 2006;51:5951.
- [CrossRef] [Google Scholar]
- Briesmeister, J.F., 2000. MCNP–A General Monte Carlo N–Particle Transport Code; Version 4C.
- El Bakkali J., 2014. Mise en œuvre de la plate-forme de Monte-Carlo Geant4 Application aux accélérateurs médicaux Linacs (Thesis).
- FreeWRL VRML/X3D browser [WWW Document], n.d.. SourceForge. URL https://sourceforge.net/projects/freewrl/ (accessed 9.10.17).
- IAEA, 2001. Absorbed Dose Determination in External Beam Radiotherapy.
- Monte carlo simulation of siemens oncor linear accelerator with beamnrc and dosxyZnrc code. J. Med. Signals Sens.. 2013;3(3):172.
- [Google Scholar]
- Kawrakow, I., Rogers, D.W.O., 2000. The EGSnrc code system. NRC Rep. PIRS-701 NRC Ott.
- A technique for the quantitative evaluation of dose distributions. Med. Phys.. 1998;25:656-661.
- [Google Scholar]
- Validation of BEAMnrc Monte Carlo model for a 12 MV photon beam. J. King Saud Univ. – Sci.. 2018;30:537-543.
- [CrossRef] [Google Scholar]
- THE EGS4 CODE SYSTEM 1985
- Monte Carlo treatment planning: an introduction. Delft: NCS; 2006.
- a code system for Monte Carlo simulation of electron and photon transport. Issy-les-Moulineaux: OECD Nuclear Energy Agency; 2001.
- Monte Carlo modelling of external radiotherapy photon beams. Phys. Med. Biol.. 2003;48(21):R107.
- [CrossRef] [Google Scholar]
- Computing efficiency improvement in monte carlo simulation of a 12 MV Photon beam medical LINAC. World J. Nucl. Sci. Technol.. 2013;2013
- [CrossRef] [Google Scholar]


