

Translate this page into:
Utilization of salt activated Raphia hookeri seeds as biosorbent for Erythrosine B dye removal: Kinetics and thermodynamics studies
⁎Corresponding author. cc.okoye@unizik.edu.ng (C.C. Okoye)
-
Received: ,
Accepted: ,
This article was originally published by Elsevier and was migrated to Scientific Scholar after the change of Publisher.
Peer review under responsibility of King Saud University.
Abstract
The use of a non-conventional precursor, Raphia hookeri seeds, (RHS) for the production of activated carbon through thermal and salt activation for the adsorption of Erythrosine B (EB) dye in an aqueous solution was investigated. The physicochemical properties of the prepared activated carbon were studied using standard methods. Scanning electron microscopy (SEM) displayed the surface morphology micrograph and Fourier Transform Infrared was used to identify the functional groups of the activated carbon. Adsorptive performance tests at various temperatures were evaluated at optimum results of 75 µm adsorbent particle size, 1 g adsorbent dosage, 100 mg/L adsorbate concentration and pH 4. An equilibration time of 90 minutes is sufficient at 30 °C for 87.78% adsorption of EB on SARHS. Experimental data were fitted into non-linearized pseudo-first order (PFO) and pseudo-second order (PSO) kinetic models. PSO better fitted the experimental data based on SSE (%), RMS and R2 results. Computations from intra-particle diffusion kinetic model reveal that intra-particle diffusion is not the only rate-limiting step governing the adsorptive process. Results from Analysis of Variance (ANOVA) confirmed that there were statistical significant differences between the adsorption efficiencies of salt activated raphia hookeri seeds (SARHS) at different time intervals (P-Value < 0.05). Tukey’s Honest Significant Difference (HSD) post hoc method was employed for the identification of the location of these differences. The values calculated for ΔG°, ΔS° and ΔH° thermodynamic parameters were −29.60 KJ mol−1, 0.089 KJ mol−1 and −0.705 KJ mol−1 respectively confirming that the adsorptive process is feasible, spontaneous and exothermic in nature.
Nomenclature
- ANOVA
-
Analysis of Variance
- EB
-
Erythrosine B
- PFO
-
Pseudo first order
- PSO
-
Pseudo second order
- RHS
-
Raphia hookeri seeds
- SARHS
-
Salt activated Raphia hookeri seed
- SSE
-
Sum of squared errors
- RMS
-
Root mean square
- Б
-
Intra-particle diffusion equation intercept
1 Introduction
Technological advances by humans have resulted in the contamination of water bodies resulting in the presence of toxic pollutants at concentrations well above the limits set by World Health Organization (WHO) and the Environmental protection agency (EPA) (Gupta et al., 2015; Celik and Demirbas, 2005; Ali and Aboul-Enein, 2006; Ali et al., 2009). The major pollution which affects the environment is water pollution (Saravanan et al., 2013a). Dyes are present in the wastewater streams of many industrial sectors such as dyeing, textile, tannery and paint industry (Bayramoglu et al., 2009). It has already been reported that the major organic compounds that constitute the increasing environmental danger are the industrial dyes and textile dyes (Saravanan et al., 2016b; Saravanan et al., 2014; Velmurugan et al., 2011). The immense development of the textile industries has contributed to the significant amount of water pollution, which is mainly due to the disposal of the industrial wastes like various inorganic and organic dyes into the water resources (Saravanan et al., 2013b,c). About 6,34,900 metric tons of dyes are produced worldwide each year and nearly 10–15% of them are discharged as effluent (Jayalakshmi et al., 2013).
Dye-containing effluents are undesirable wastewaters because they contain high level of chemicals, suspended solids, and toxic compounds (Balarak et al., 2015; Zazouli et al., 2014; Diyanati et al., 2013; Vijayakumar et al., 2012). The colour in wastewater is a consequence of inefficient processing both in the dye manufacturing and in the dye-consuming industries. The presence of this colour in very small amounts in water (less than 1 ppm for some dyes) is highly visible and undesirable from an ecological point of view as they block the penetration of the sunlight essential for photosynthesis of aquatic flora (Mittal et al., 2010). These dyes get accumulated in living tissues throughout the food chain which has human at its top (Pankaj and Harleen, 2011). Water contamination has led the major health risks (Saravanan et al., 2016a) round the globe which is growing at a faster rate every year (Saravanan et al., 2015a,b).
Treatment of dye-containing effluents is of immense importance considering their detrimental effects when discharged untreated on the environment. Jayalakshmi et al. (2013) and Theivarasu and Mylsamy (2011) reported that industrial methods employed for treating dye wastewaters include coagulation and flocculation, photodegradation, ultrafiltration, adsorption, reverse osmosis, etc. Among them, adsorption has been found to be superior to other techniques for dye wastewater treatment in terms of cost, simplicity of design, ease of operation and insensitivity to toxic substances (Bayramoglu et al., 2009; Gupta et al., 2012; Gupta et al., 2013; Gupta and Saleh, 2013; Singh et al., 2009). Adsorption is a well-known separation process and has proved to be effective and economically feasible for the removal of various types of pollutants from effluents, especially non-biodegradable solutes (Al-Duri et al., 2005; Ali, 2010, 2012, 2014; Ali and Gupta, 2007; Ali et al., 2012).
Activated carbon adsorption systems, widely used in chemical process industries for several decades, are now playing an important role in the cleaning up of plant effluents and municipal wastewater (Norhafizah et al., 2011; Gupta et al., 1998; Ali et al., 2017, 2016a,b,c,d; Khan et al., 2011). However, commercially available activated carbon is very expensive (Velmurugan et al., 2011). The inexpensiveness of commercially produced activated carbon has encouraged the development of low-cost activated carbon from abundantly available alternatives, primarily agricultural wastes. To this effect, some researchers have reported the production of activated carbon from agricultural waste materials such as: sugar cane bagasse (Pankaj and Harleen, 2011); Meranti sawdust (Ahmad et al., 2009), coffee husks (Oliveira et al., 2008), orange peel, Neem leaves and banana peel (Velmurugan et al., 2011).
Raphia hookeri belongs to family Arecaceae (Palmae). Raphia hookeri is found from Gambia through the Guinea forest zone of West Africa to Cameroon, Gabon and Congo and possibly to DR Congo and Angola (Brink, 2011). Of the eight species of Raphia identified as indigenous to Nigeria, Raphia hookeri is the most dominant tree crop within the coastal fresh water swamp (Ndon, 2003). Raphia palm grows naturally and abundantly in the south-southern states of Nigeria. Raphia hookeri develops in accordance with Tomlinson’s growth model. Sap tapped from the stem when the tree nears the flowering stage ferments rapidly into palm wine, a very popular drink throughout West Africa. The young terminal bud or ‘palm cabbage’ is eaten as a vegetable (Brink and Achigan-Dako, 2012).
Currently, there is scanty or no publication to the best of our knowledge on the usage of RHS as adsorbent for waste water treatment. In many regions of Nigeria, RHS are considered a waste product. Sequel to this and considering its abundance, we made attempts to recycle the waste material and investigate its potentiality as adsorbent. Effect of process parameters, kinetics and thermodynamics of the adsorptive process parameters were studied. In addition, ANOVA statistical tool was applied to determine if there is a practical difference between the adsorption efficiency of SARHS at different time intervals by Tukey’s Honest Significant Difference test. Also the nature of the effects of treatment was also ascertained. Analysis of Variance is a statistical tool used to ascertain the differences between two or more means. Conclusions on means are done by analyzing variance therefore the nomenclature Analysis of variance is preferred to Analysis of Means. Though t-test could be adopted for the analysis, the advantage ANOVA has over t-test is that the post hoc tests of ANOVA allows better control of type 1 error.
2 Materials and methods
2.1 Materials
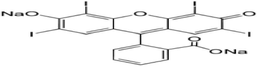
Raphia hookeri seeds were collected from Ugwuoba in Enugu state, Nigeria. Erythrosine B and other chemicals of analytical grades were purchased from a chemical vendor at Head Bridge, Onitsha, Anambra state, Nigeria. The reagents were used without further purification. The physical properties and molecular structure of EB are presented in Table 1.
Properties
Nomenclature
Dye name
Erythrosine B
Dye Colour
Cherry pink
Chemical formula
C20H6I4Na2O5
IUPAC name
2-(6-Hydroxy-2,4,5,7-tetraiodo-3-oxo-xanthen-9-yl)benzoic acid
Molecular weight
879.86 g/mol
λmax
530 nm
Molecular structure
2.2 Methods
The sample (Raphia hookeri seeds) collected was washed with de-ionized water to remove unwanted materials such as sand, dirt, etc., then air dried for 6 h. The sample was further oven dried at temperature of 110 °C for 4 h to ensure complete drying then size reduced to a range between 1 and 3 mm. The size reduced RHS was carbonized in a muffle furnace (SX-2.5-10) at 1173 K for 3 h, the carbonized sample was soaked in 60% by weight sodium chloride salt (NaCl) solution for 24 h at activating agent to carbonized sample ratio of 1:1 weight basis. The resulting carbon was washed with de-ionized water until the pH of the leachate was between 6 and 8, then dried in an oven at a temperature of 105 °C for 5–6 h. The activated carbon (SARHS) was cooled to room temperature in a desiccator, then size reduced to different particle sizes and stored in properly labelled air tight containers.
Stock solution (1000 mg/l) of Erythrosine B (EB) dye was prepared by dissolving 1 g of the dye in 1 L of de-ionized water. Other concentrations of the dye were prepared by serial dilution of the stock solution.
2.3 Physicochemical characterization of SARHS
The methodology for the physicochemical characterization of the activated carbon produced is reported in our earlier published journal (Okoye et al., 2016).
2.3.1 Instrumental characterization
The instrumental characterization of the sample was determined using the scanning electron microscope (model Phonem Prox) and the FTIR spectrophotometer (Shimadzu FTIR 8400). Result from FTIR spectra was used to identify the functional groups present in the activated carbon. The morphology of the activated carbon was displayed by SEM micrograph.
2.4 Adsorption tests
Sorption experiments were conducted to evaluate the adsorptive performance of SARHS at different temperatures (30–60 °C). The experiments were performed at optimum results of 75 µm adsorbent particle size, 1 g adsorbent dosage, 100 mg/L adsorbate concentration, and pH 4 obtained in preliminary experiments. The steps for the sorption experiment are described below:
-
A number of different 250 ml Pyrex beakers containing 100 ml of 100 mg/L concentration of EB dye and specified dosage of SARHS were set at 30 °C, 40 °C, 50 °C, 60 °C respectively.
-
The beakers containing the mixtures were stirred using a magnetic stirrer at speed of 110 rev/min for 150 min.
-
At the elapse of the set time for the treatment, the mixture was filtered using Whatman No. 1 filter paper.
-
The amount of unadsorbed dye in each supernatant solution was tested using a Visible spectrophotometer.
The percentage of dye adsorbed and sorption capacity (mg/g) were calculated from Eqs. (1) and (2):
2.5 Adsorption kinetics
Solute uptake rate is evaluated by adsorptive kinetics study. Various models have been proposed to describe and clarify pollutant adsorption mechanism (Annadurai et al., 2008). As a rule, models based on the apparent reaction order of adsorption (pseudo-first order and pseudo-second order models) are used to describe the kinetics of the sorption of dyes onto sorbents (Janoš et al., 2007). However, because the aforementioned kinetics models cannot give definite mechanism, another simplified model (Intra-particle diffusion kinetic model) is also tested (Kushwaha et al., 2008). Therefore, the experimental data were fitted into non-linearized PFO and PSO; linearized Intra-particle diffusion kinetic model equations.
2.5.1 Pseudo-first order
Lagergren proposed that the rate of adsorption of solute on the adsorbent is based on the adsorption capacity and followed a pseudo-first order equation. The pseudo-first order kinetic model equations can be expressed as follows (Bellir et al., 2010):
Rearranging Eq. (4), the non linear form of the pseudo-first order kinetic equation is stated as:
2.5.2 Pseudo-second order
The non-linear pseudo-second order kinetic model equation is expressed as:
2.5.3 Intra-particle diffusion model
The fractional uptake of the solute on particle, F, in a liquid-solid system will vary with the function (Allen et al., 1989):
Hence there is a linear relationship between F and t0.5 for much of the adsorption process. F can be defined as:
The Intra-particle diffusion parameter, ki, can be defined as the linear gradient of a graph of the amount of dye adsorbed per gram of adsorbent (qt) against the square root of time, t0.5. Hence the diffusion rate parameter, ki, is evaluated from:
Rearranging Eq. (12),
2.6 Kinetic models validity
The best fit between PFO and PSO kinetic models was determined by the sum of squared errors (SSE%), root mean square (RMS) and coefficient of determination (R2):
2.7 Statistical comparative analysis
2.7.1 Analysis of variance
Analysis of Variance is an effective statistical tool for comparing the means of two or more independent groups.
2.7.2 Tukey’s honest significant difference (HSD) test
Tukey’s test calculates a new critical value that can be used to evaluate if differences between any two pairs of means are significant. The critical value is a little different because it involves the mean difference that has to be exceeded to achieve significance. So one simply calculates one critical value and then the difference between all possible pairs of means. Each difference is then compared to the Tukey critical value. If the difference is larger than the Tukey value, the comparison is significant (Newsom, 2013).
2.8 Adsorption thermodynamics
Thermodynamic parameters (standard free energy (ΔG°), standard enthalpy change (ΔH°) and standard entropy change (ΔS°) were evaluated from the following equations (Bayramoglu et al., 2009):
The Gibb’s free energy, enthalpy change and entropy change at constant temperature are related by the following equations:
3 Results and discussion
3.1 Properties of SARHS
Characterization results for the activated carbon (SARHS) were presented in Table 2. The following physical properties were investigated: surface area, ash content, moisture content, pH and bulk density. From Table 2, the high value of surface area obtained shows that SARHS is highly porous while the low value of ash content shows that the produced activated carbon has low inorganic content and high fixed carbon. Any porous material will have the tendency to adsorb moisture. The moisture content of SARHS is comparable with the values also reported by Sivakumar et al. (2012). The pH value reported in Table 2 is in the range of 6.8–7.4. It has been reported by Ekpete and Horsfall (2011) that for most applications, carbon pH 6–8 is acceptable.
Sample
Surface area (m2/g)
Ash content (%)
Moisture content (%)
pH
Bulk density (g/cm−2)
AAAE
181
6.01
8.5
7.4
0.72
3.2 Instrumental characteristics of SARHS
Fig. 1 is a graph of %Transmittance vs wave number for SARHS. The FTIR spectrum identified the functional groups on the activated carbon surface. Peaks 3910.80 cm−1 and 3770.00 cm−1 show the presence of O–H stretch in phenol and alcohols, 3407.37 cm−1 was assigned to O–H stretch, H-bonded, alcohols, phenols, 2934.79 cm−1 (C–H stretching) shows the presence of aliphatic hydrocarbon groups. Peaks 2366.74 cm−1, 1637.62 cm−1 and 1550.82 depict the presence of C≡C bonds, C⚌O bonds, and C⚌C stretching respectively. Other bands detected can be assigned to in-plane C—H bending (1151.54 cm−1) and ⚌C—H out of plane bending (670.29 cm−1).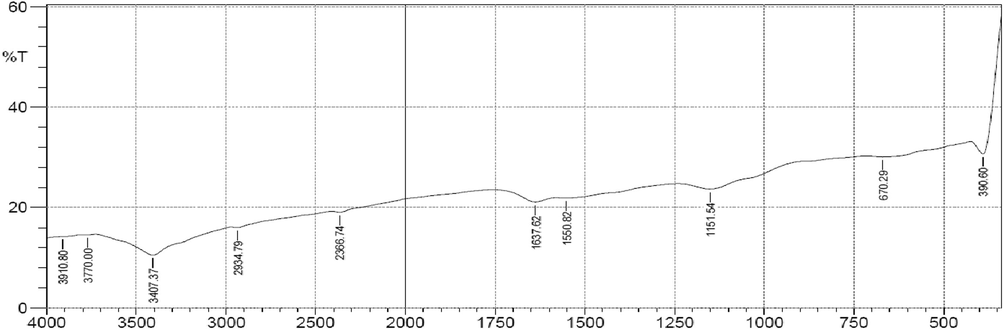
FTIR Spectrum of SARHS.
3.2.1 SEM analysis
The surface morphology of SARHS was investigated by the scanning electron micrograph. Fig. 2 shows a relatively fibrous surface with sponge-like protrusions, pores and cavities of different sizes. The characteristics observed on the external structure of the adsorbent (SARHS) may be as a result of removal of some volatile matters during carbonization and also, evaporation of the impregnating materials which occupied some space on the carbon structure.
SEM micrograph of SARHS.
3.3 Kinetics parameters
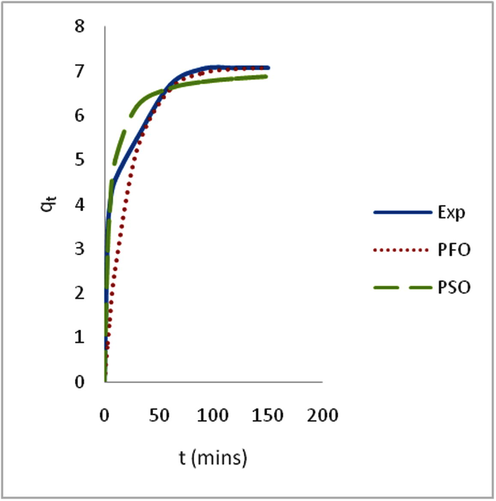
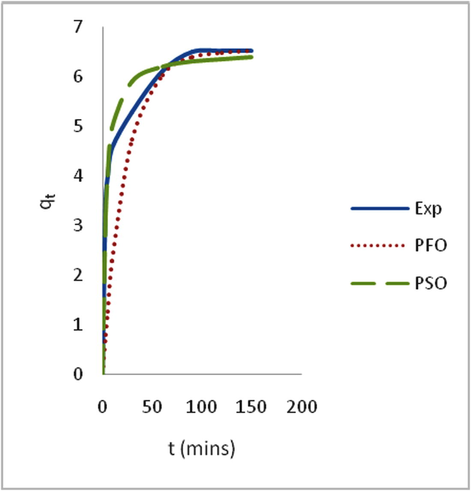
Adsorption is time-dependent process and it is very important to know the rate of adsorption for design and evaluation of the adsorbent in removing the dyes in wastewater (Zawani et al., 2009). In order to examine the controlling mechanism of biosorption process such as mass transfer and chemical reaction, kinetics models were used to test the experimental data (Bayramoglu et al., 2009). The kinetics study for the adsorption of EB on SARHS was investigated using the PFO and PSO kinetic models. Figs. 3–6 show non-linear plots of the models under investigation. The parameters of the kinetic models k1 and k2 presented in Table 3 were estimated from the experimental data by applying the golden search method. It is observed from Figs. 3–6 that the system’s equilibration time is 90 min. The rate of the dye adsorbed diminished after 90 min possibly due to the fact that at start-up of the experiments, all the reaction sites were vacant and hence the extent of removal was high but decreases over time. The values calculated for RMS (Eq. (7)), SSE (Eq. (8)) and coefficient of determination, R2 (Eq. (9)) presented in Table 3 were used for quantitative comparison of the applicability of the models investigated. The histogram plots (Figs. 7 and 8) depicted that irrespective of the temperature under study, PSO had lower values for RMS and SSE. From Table 3, it is also seen that PSO generally has calculated coefficient of determination values (R2) closer to unity hence, PSO better fitted the experimental data obtained for the adsorption of EB dye on SARHS.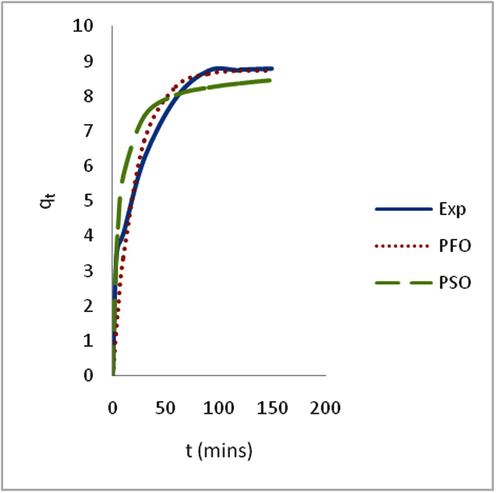
Non linear plots of measured and modeled time profiles for the adsorption of EB dye on SARHS at 30 °C.
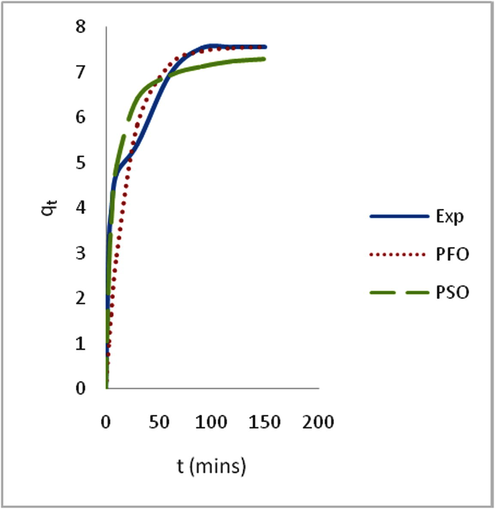
Non linear plots of measured and modeled time profiles for the adsorption of EB dye on SARHS at 40 °C.
Non linear plots of measured and modeled time profiles for the adsorption of EB dye on SARHS at 50 °C.
Non linear plots of measured and modeled time profiles for the adsorption of EB dye on SARHS at 60 °C.
Temp
PFO
PSO
Intra-particle diffusion
K1
R2
RMS
SSE
K2
R2
RMS
SSE
Ki
Б
R2
30
0.0488
0.9012
0.291
1.023
0.0215
0.8621
0.169
0.785
0.9120
4.228
0.7947
40
0.0497
0.8081
0.347
1.330
0.0250
0.9229
0.103
0.485
0.5997
4.536
0.8244
50
0.0444
0.7694
0.382
1.465
0.0337
0.9339
0.080
0.381
0.5086
4.540
0.7969
60
0.0431
0.7172
0.408
1.602
0.0490
0.9341
0.064
0.306
0.3951
4.542
0.8213
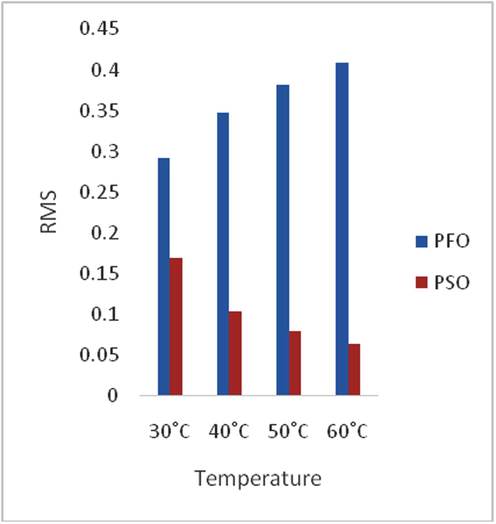
Comparative variation of RMS with temperature for PFO and PSO.
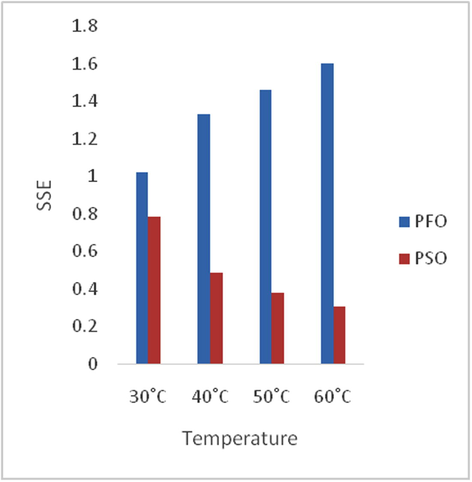
Comparative variation of SSE with temperature for PFO and PSO.
Fig. 9 is a plot of linearized intra-particle diffusion model equation. At varying temperatures under consideration, it is observed that the plots generally follow the same trend and did not pass through the origin. The deviation observed from the point of origin may be as a result of rate of mass transfer difference at the initial and final periods of the adsorptive process. The deviation of the plots from the origin is an indication that intra-particle diffusion does not solely determine the rate-limiting step, possibly both intra-particle diffusion and surface adsorption contribute to the rate determining step. The non-passage of the plots through the origin may also be as a result of some degree of boundary layer control. According to Bayramoglu et al. (2009), the intercept (Б) of the plot of qt versus time0.5 gives an idea about boundary layer thickness, the larger the value of the intercept, the greater the boundary layer diffusion effect is. The two linear portions of the Intra-particle diffusion plot show that the first linear portion of the plot indicates the boundary layer effect on the adsorption and the second linear portion of the plot indicates the intra-particle diffusion (Senthil et al., 2012).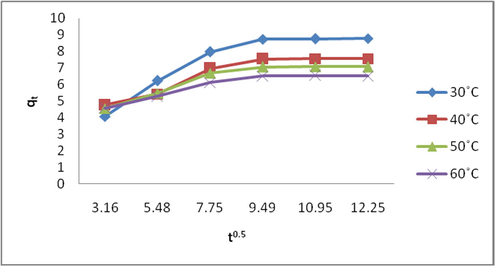
Linearized Intra-particle diffusion plot for the adsorption of EB dye on SARHS.
3.4 Statistical analyses
3.4.1 One-way factorial analyses for the effect of temperature variation
Fig. 10 shows the effect of temperature on the time-based adsorptive performance of EB dye on SARHS. It was recorded that the highest percentage of dye adsorbed at temperatures 30 °C, 40 °C, 50 °C and 60 °C are 87.78%, 75.56%, 70.7% and 65.21% respectively thus there is an inverse proportional relationship between temperature and percentage of EB dye adsorbed on SARHS.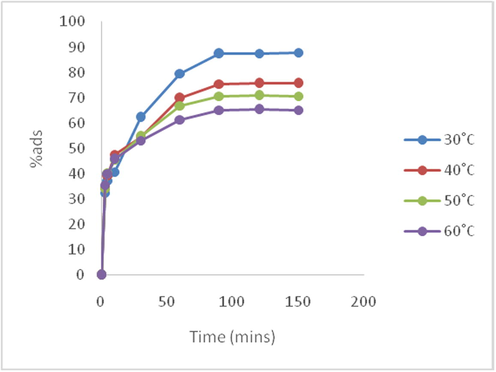
Time lined adsorptive efficiency variation at different temperatures.
Analysis of Variance (ANOVA) was used to ascertain if there was a practical difference between the adsorption efficiency of SARHS at different time intervals. This investigation was carried out to establish that the different adsorptive performance at various time intervals was not by chance. The probability value recorded in Table 4 was lower than the critical value (0.05) thus the null hypothesis was rejected and as such the alternate hypothesis was accepted (there were statistical significant differences at various time intervals among the adsorptive performances of EB dye on SARHS).
Sum of Squares
Df
Mean Square
F
Sig.
Between Groups
8318.077
7
1188.297
26.432
.000
Within Groups
1078.955
24
44.956
Total
9397.031
31
A significant F-value recorded in Table 4 also reveals that there are differences in the means but did not disclose where the differences are. To identify the location of these differences, Tukey’s HSD post hoc method of analysis was adopted.
Table 5 shows Tukey’s HSD post hoc analysis for the effect of varying time on the adsorptive performance of EB on SARHS. P-values for these groups: 3 and 30 min, 60 min, 90 min, 120 min and 150 min, 5 and 30 min, 60 min, 90 min, 120 min and 150 min, 10 and 60 min, 90 min, 120 min and 150 min, 30 and 3 min, 5 min, 90 min, 120 min and 150 min, 60 and 3 min, 5 min and 10 min, 90 and 3 min, 5 min, 10 min and 30 min, 120 and 3 min, 5 min, 10 min and 30 min, 150 and 3 min, 5 min, 10 min and 30 min are less than 0.05 therefore, depict statistical significant difference in their adsorptive performances. Table 5 shows that there is no significant difference (between these compared times: 3 and 5 min, 10 min; 5 and 3 min, 10 min; 10 and 3 min, 5 min; 30 and 10 min, 60 min; 90 and 60 min, 120 min, 150 min; 120 and 60 min, 90 min, 150 min; 150 and 60 min, 90 min, 120 min. However, the P-values for these timings: 3 and 5 min, 5 and 10 min, 60 and 90 min, 120 min and 150 min are very close to unity therefore showing very high level of no statistical significance between the compared time intervals. The equilibrium time for the adsorption of EB on SARHS was established around 90 min. This finding is in line with the observation on Figs. 3 and 4.
(I) Time
(J) Time
Mean Difference (I-J)
Std. Error
Sig.
95% Confidence Interval
Lower Bound
Upper Bound
3.00
5.00
−5.05000
4.74112
.958
−20.7522
10.6522
10.00
−10.85750
4.74112
.339
−26.5597
4.8447
30.00
−22.01000*
4.74112
.002
−37.7122
−6.3078
60.00
−35.33750*
4.74112
.000
−51.0397
−19.6353
90.00
−40.62750*
4.74112
.000
−56.3297
−24.9253
120.00
−40.79750*
4.74112
.000
−56.4997
−25.0953
150.00
−40.79500*
4.74112
.000
−56.4972
−25.0928
5.00
3.00
5.05000
4.74112
.958
−10.6522
20.7522
10.00
−5.80750
4.74112
.916
−21.5097
9.8947
30.00
−16.96000*
4.74112
.028
−32.6622
−1.2578
60.00
−30.28750*
4.74112
.000
−45.9897
−14.5853
90.00
−35.57750*
4.74112
.000
−51.2797
−19.8753
120.00
−35.74750*
4.74112
.000
−51.4497
−20.0453
150.00
−35.74500*
4.74112
.000
−51.4472
−20.0428
10.00
3.00
10.85750
4.74112
.339
−4.8447
26.5597
5.00
5.80750
4.74112
.916
−9.8947
21.5097
30.00
−11.15250
4.74112
.308
−26.8547
4.5497
60.00
−24.48000*
4.74112
.001
−40.1822
−8.7778
90.00
−29.77000*
4.74112
.000
−45.4722
−14.0678
120.00
−29.94000*
4.74112
.000
−45.6422
−14.2378
150.00
−29.93750*
4.74112
.000
−45.6397
−14.2353
30.00
3.00
22.01000*
4.74112
.002
6.3078
37.7122
5.00
16.96000*
4.74112
.028
1.2578
32.6622
10.00
11.15250
4.74112
.308
−4.5497
26.8547
60.00
−13.32750
4.74112
.139
−29.0297
2.3747
90.00
−18.61750*
4.74112
.012
−34.3197
−2.9153
120.00
−18.78750*
4.74112
.011
−34.4897
−3.0853
150.00
−18.78500*
4.74112
.011
−34.4872
−3.0828
60.00
3.00
35.33750*
4.74112
.000
19.6353
51.0397
5.00
30.28750*
4.74112
.000
14.5853
45.9897
10.00
24.48000*
4.74112
.001
8.7778
40.1822
30.00
13.32750
4.74112
.139
−2.3747
29.0297
90.00
−5.29000
4.74112
.947
−20.9922
10.4122
120.00
−5.46000
4.74112
.938
−21.1622
10.2422
150.00
−5.45750
4.74112
.938
−21.1597
10.2447
90.00
3.00
40.62750*
4.74112
.000
24.9253
56.3297
5.00
35.57750*
4.74112
.000
19.8753
51.2797
10.00
29.77000*
4.74112
.000
14.0678
45.4722
30.00
18.61750*
4.74112
.012
2.9153
34.3197
60.00
5.29000
4.74112
.947
−10.4122
20.9922
120.00
−.17000
4.74112
1.000
−15.8722
15.5322
150.00
−.16750
4.74112
1.000
−15.8697
15.5347
120.00
3.00
40.79750*
4.74112
.000
25.0953
56.4997
5.00
35.74750*
4.74112
.000
20.0453
51.4497
10.00
29.94000*
4.74112
.000
14.2378
45.6422
30.00
18.78750*
4.74112
.011
3.0853
34.4897
60.00
5.46000
4.74112
.938
−10.2422
21.1622
90.00
.17000
4.74112
1.000
−15.5322
15.8722
150.00
.00250
4.74112
1.000
−15.6997
15.7047
150.00
3.00
40.79500*
4.74112
.000
25.0928
56.4972
5.00
35.74500*
4.74112
.000
20.0428
51.4472
10.00
29.93750*
4.74112
.000
14.2353
45.6397
30.00
18.78500*
4.74112
.011
3.0828
34.4872
60.00
5.45750
4.74112
.938
−10.2447
21.1597
90.00
.16750
4.74112
1.000
−15.5347
15.8697
120.00
−.00250
4.74112
1.000
−15.7047
15.6997
3.5 Adsorption thermodynamics
Thermodynamic parameters were estimated from van’t Hoff’s plot (Fig. 11). From the slope and intercept of the graph, the values of ΔH° and ΔS° were calculated. The values for change in Gibbs free energy (ΔG°) were calculated from Eq. (15). The calculated values were presented in Table 6. The negative values of ΔG° at all temperature under investigation depict that the process is feasible and spontaneous in nature. A negative value of ΔH° indicates that the adsorption process is exothermic. The positive change in entropy value obtained is an indication of an increased randomness between solid-solution interfaces during the adsorption of EB dye on SARHS (Hossain et al., 2012; Rameshraja et al., 2012).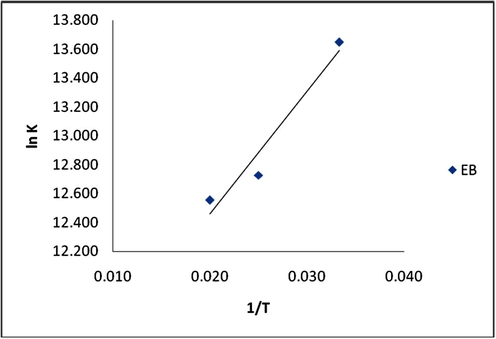
Thermodynamic plot of lnK vs 1/T for adsorption of EB on SARHS.
Adsorbent
Thermodynamics Parameters
T(K)
ΔG° (kJ/mol)
ΔH° (kJ/mol)
ΔS° (kJ/mol.K)
SARHS
303
−27.814
313
−28.709
−0.705
0.089
323
−29.603
4 Conclusion
RHS, a novel precursor, was shown to have strong potential for use as an adsorbent for the treatment of dye based wastewater. The percentage uptake of EB dye on SARHS is temperature dependent. An equilibration time of 90 minutes is sufficient for 87.78% adsorption of EB on SARHS at the experimental condition of 1 g dosage, 30 °C and 100 mg/L adsorbate concentration. The experimental data better fitted the PSO kinetic model. ANOVA calculations reveal that there were statistical significant differences between the adsorption efficiency of SARHS at different time intervals. It can be concluded from the results obtained that the low cost and eco-friendly material (SARHS) can be used as an available alternative adsorbent for dye removal in wastewater treatment.
References
- Scavenging behaviour of meranti sawdust in the removal of methylene blue from aqueous solution. J. Hazard. Mater.. 2009;170:357-365.
- [Google Scholar]
- Modelling of multicomponent equilibrium for the adsorption of basic dyes onto bagasse pith. Inst. Chem. Eng.. 2005;69:246-254.
- [Google Scholar]
- The quest for active carbon adsorbent substitutes: Inexpensive adsorbents for toxic metal ions removal from wastewater. Sep. Purif. Rev.. 2010;39:95-171.
- [Google Scholar]
- Water treatment by adsorption columns: evaluation at ground level. Sep. Purif. Rev.. 2014;43(3):175-205.
- [Google Scholar]
- Instrumental Methods in Metal Ions Speciation: Chromatography, Capillary Electrophoresis and Electrochemistry. New York: Taylor & Francis Ltd; 2006. ISBN: 0-8493-3736-4
- Nano Chromatography and Capillary Electrophoresis: Pharmaceutical and Environmental Analyses. Hoboken, USA: Wiley & Sons; 2009. ISBN: 978-0-470-17851-5
- Low cost adsorbents for removal of organic pollutants from wastewater. J. Environ. Manage.. 2012;113:170-183.
- [Google Scholar]
- Advances in water treatment by adsorption technology. Nat. Protocol. 2007;1:2661-2667.
- [Google Scholar]
- Green synthesis of functionalized iron nano particles and molecular liquid phase adsorption of ametryn from water. J. Mol. Liq.. 2016;221:1168-1174.
- [Google Scholar]
- Synthesis of composite iron nano adsorbent and removal of ibuprofen drug residue from water. J. Mol. Liq.. 2016;219:858-864.
- [Google Scholar]
- Molecular uptake of congo red dye from water on iron composite nano particles. J. Mol. Liq.. 2016;224:171-176.
- [Google Scholar]
- Uptake of pantoprazole drug residue from water using novel synthesized composite iron nano adsorbent. J. Mol. Liq.. 2016;218:465-472.
- [Google Scholar]
- Uptake of propranolol on ionic liquid iron nanocomposite adsorbent: kinetic, thermodynamics and mechanism of adsorption. J. Mol. Liq.. 2017;236:205-213.
- [Google Scholar]
- Intraparticle diffusion of a basic dye during adsorption onto sphagnum peat. Environ. Pollut.. 1989;56:39-50.
- [Google Scholar]
- Adsorption of reactive dye from an aqueous solution by chitosan: isotherm, kinetic and thermodynamic analysis. J. Hazard. Mater.. 2008;152(1):337-346.
- [Google Scholar]
- The use of low-cost adsorbent (Canola residues) for the adsorption of methylene blue from aqueous solution: isotherm, kinetic and thermodynamic studies. Colloids Interface Sci. Commun.. 2015;7:16-19.
- [Google Scholar]
- Adsorption kinetics and thermodynamic parameters of cationic dyes from aqueous solutions by using a new strong cation- exchange resin. Chem. Eng. J.. 2009;152:339-346.
- [Google Scholar]
- Removal of methylene blue from aqueous solutions using acid activated Algerian bentonite: equilibrium and kinetic study. In: International Renewable Energy Congress, Tunisia. Nov 5–7. 2010.
- [Google Scholar]
- Brink, M. (2011). Raphia hookeri PROTA (Plant Resources of Tropical Africa/Resources, Wageningen, Netherlands. Retrieved from http://www.prota4u.org/search.asp, 20/12/13.
- Plant Resources of Tropical Africa. Wageningen: PROTA Foundation; 2012.
- Removal of heavy metal ions from aqueous solutions via adsorption onto modified lignin from pulping wastes. Energy Source. 2005;27:1167-1177.
- [Google Scholar]
- Survey of efficiency agricultural waste in removal of acid orange 7 (AO7) dyes from aqueous solution: kinetic and equilibrium study. Iran. J. Health Sci.. 2013;2:35-40.
- [Google Scholar]
- Preparation and characterization of activated carbon derived from fluted pumpkin stem waste (Telfairia occidentalis Hook F) Res. J. Chem. Sci.. 2011;1(3)
- [Google Scholar]
- Design parameters for fixed bed reactors of activated carbon developed from fertilizer waste for the removal of some heavy metal ions. Waste Manage. (Oxford). 1998;17(8):517-522.
- [Google Scholar]
- Batch and bulk removal of hazardous colouring agent Rose Bengal by adsorption techniques using bottom ash as adsorbent. RSC Adv.. 2012;2:8381-8389.
- [Google Scholar]
- Adsorptive removal of dyes from aqueous solution onto carbon nanotubes: a review. Adv. Colloid Interface Sci. 2013
- [CrossRef] [Google Scholar]
- Bioadsorbents for remediation of heavy metals: current status and their future prospects. Environ. Eng. Res.. 2015;20(1):1-18.
- [Google Scholar]
- Sorption of pollutants by porous carbon, carbon nanotubes and fullerene - an overview. Environ. Sci. Pollut. Res. 2013
- [CrossRef] [Google Scholar]
- Adsorption and desorption of copper(II)ions onto garden grass. Bioresour. Technol.. 2012;121:386-395.
- [Google Scholar]
- Sorption of ionic dyes onto unsaturated low-rank coal-oxihumolite: a kinetic study. Dyes Pigm.. 2007;74:363.
- [Google Scholar]
- Adsorption of acid orange-7 dye onto activated carbon produced from bentonite - a study of equilibrium adsorption isotherm. Chem. Sci. Trans.. 2013;2(S1):S7-S12.
- [Google Scholar]
- Adsorption of Rhodamine B dye from aqueous solution onto acid activated mango (Magnifera indica) leaf powder: equilibrium, kinetic and thermodynamic studies. J. Toxicol. Environ. Health Sci.. 2011;3(10):286-297.
- [Google Scholar]
- Empirical kinetic models for the resinoid extraction from aerial parts of St John’s Wort (Hypericum perforatum L.) J. Biochem. Eng. 2008;41:1-11.
- [Google Scholar]
- Equilibrium, kinetics and thermodynamic studies for adsorption of Hg(II) on palm shell powder. World Acad. Sci. Technol.. 2008;43:600-606.
- [Google Scholar]
- A consideration of the correct calculation of thermodynamic parameters of adsorption. J. Serb. Chem. Soc.. 2007;72(12):1363-1367.
- [Google Scholar]
- Decoloration treatment of a hazardous triarylmethane dye, Light Green SF (Yellowish) by waste material adsorbents. J. Colloid Interface Sci.. 2010;342:518-527.
- [Google Scholar]
- The Raphia Palm. Lagos: Concept Publications Ltd; 2003.
- Post Hoc Tests. Spring: USP 634 Data Analysis I. 2013. p. :1-13.
- Removal of Cu(II) from water by adsorption on papaya seed. Asian Trans. Eng.. 2011;1(5):49-55.
- [Google Scholar]
- Adsorptive removal of Erythrosin B dye onto Terminalia Catappa endocarp prepared activated carbon: kinetics, isotherm and thermodynamics studies. Chem. Process Eng. Res.. 2016;43:26-43.
- [Google Scholar]
- Evaluation of untreated coffee husks as potential biosorbents for treatment of dye contaminated waters. J. Hazard. Mater.. 2008;155:507-512.
- [Google Scholar]
- Sugarcane bagasse for the removal of erythrosine B and methylene blue from aqueous waste. Appl. Water Sci.. 2011;1:135-145.
- [Google Scholar]
- Adsorption isotherms, kinetics, thermodynamics and desorption studies of reactive orange 16 on activated carbon derived from Ananas cosmosus (L.) carbon. ARPN J. Eng. Appl. Sci.. 2011;6(11):15-26.
- [Google Scholar]
- Quinoline adsorption onto granular activated carbon and bagasse fly ash. Chem. Eng. J.. 2012;181–182:343-351.
- [Google Scholar]
- The photocatalytic activity of ZnO prepared by simple thermal decomposition method at various temperatures. J. Mol. Liq.. 2013;177(2013):394-401.
- [Google Scholar]
- Enhanced photocatalytic activity of ZnO/CuO nanocomposite for the degradation of textile dye on visible light illumination. Mater. Sci. Eng., C. 2013;33:91-98.
- [Google Scholar]
- ZnO/Ag nanocomposite: an efficient catalyst for degradation studies of textile effluents under visible light. Mater. Sci. Eng., C. 2013;33:2235-2244.
- [Google Scholar]
- Visible light degradation of textile effluent using novel catalyst ZnO/g-Mn2O3. J. Taiwan Inst. Chem. Eng.. 2014;45:1910-1917.
- [Google Scholar]
- ZnO/Ag/Mn2O3 nanocomposite for visible light induced industrial textile effluent degradation, uric acid and ascorbic acid sensing and antimicrobial activity. RSC Adv.. 2015;2015(5):34645-34651.
- [Google Scholar]
- ZnO/Ag/CdO nanocomposite for visible light-induced photocatalytic degradation of industrial textile effluents. J. Colloid Interface Sci. 2015
- [CrossRef] [Google Scholar]
- Conducting PANI stimulated ZnO system for visible light photocatalytic degradation of coloured dyes. J. Mol. Liq.. 2016;221:1029-1033.
- [Google Scholar]
- Ce3+-ion-induced visible-light photocatalytic degradation and electrochemical activity of ZnO/CeO2 nanocomposite. Sci. Rep.. 2016;6:31641.
- [CrossRef] [Google Scholar]
- Adsorption kinetics, mechanism, isotherm, and thermodynamic analysis of copper ions onto the surface modified agricultural waste. Environ. Prog. Sustainable Energy. 2012;33(1):28-37.
- [Google Scholar]
- Poly(methylmethacrylate) grafted chitosan: an efficient adsorbent for anionic azo dyes. J. Hazard. Mater.. 2009;161:955-966.
- [Google Scholar]
- Preparation and characterization of activated carbon prepared from balsamodendron caudatum wood waste through various activation processes. Raysayan J. Chem.. 2012;5(3):321-327.
- [Google Scholar]
- Comparative adsorption study of acid Red 18 on cocoa (Theobroma cacao) shell and commercial activated carbon. Int. J. Res. Chem. Environ.. 2011;1(2):159-165.
- [Google Scholar]
- Dye removal from aqueous solution using low cost adsorbent. Int. J. Environ. Sci.. 2011;1(7):1492-1503.
- [Google Scholar]
- Adsorption, kinetic, equilibrium and thermodynamic studies on the removal of basic dye rhodamine-B from aqueous solution by the use of natural adsorbent perlite. J. Mater. Environ. Sci.. 2012;3(1):157-170.
- [Google Scholar]
- Equilibrium, kinetics and thermodynamic studies: adsorption of remazol black 5 on the palm kernel shell activated carbon (PKS-AC) Eur. J. Sci. Res.. 2009;37(1):67-76.
- [Google Scholar]
- Application of Canola residuals in absorption of reactive red 198 (RR198) dye from aqueous solutions. J. Neyshabur Univ. Med. Sci.. 2014;2:55-66.
- [Google Scholar]


