

Translate this page into:
Unravelling the beehive air volatiles profile as analysed via solid-phase microextraction (SPME) and chemometrics
⁎Corresponding authors at: Pharmacognosy Department, College of Pharmacy, Cairo University, Kasr el Aini St., P.B. 11562, Cairo, Egypt (M.A. Farag). Pharmacognosy Group, Department of Pharmaceutical Biosciences, Uppsala University, Biomedical Centre, Box 574, 751 23 Uppsala, Sweden (H.R. El-Seedi). Mohamed.farag@pharma.cu.edu.eg (Mohamed A. Farag), hesham.el-seedi@farmbio.uu.se (Hesham R. El-Seedi) elseedi_99@yahoo.com (Hesham R. El-Seedi)
-
Received: ,
Accepted: ,
This article was originally published by Elsevier and was migrated to Scientific Scholar after the change of Publisher.
Peer review under responsibility of King Saud University.
Abstract
Abstract
Objective
Beehive air therapy is recognized as a potential remedy for treating asthma, bronchitis, lung fibrosis, and respiratory tract infections. Developed countries in which beehive air therapy is currently authorized include Germany, Hungary, Slovenia, and Austria. However, scientific proof of its efficacy is lacking which warrants further chemical and biological analyses as a proof of concept. In this study, beehive air volatile profile was determined for the first time along with its individual components (bees, venom, honey, and beeswax).
Methods
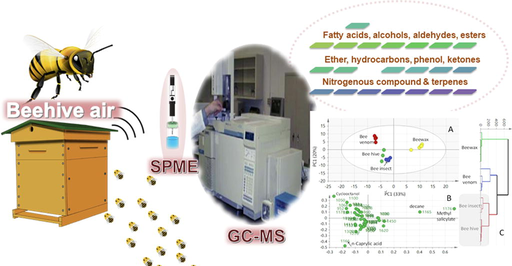
Volatile compounds were collected from beehive air using solid phase micro-extraction (SPME) coupled to gas chromatography-mass spectrometry (GC–MS). Antimicrobial assay of the air released from 4 beehive products was further performed against Staphylococcus aureus, Klebsiella pneumoniae, Acinetobacter baumannii, and multi drug-resistant Staphylococcus aureus (MRSA) using the in vitro agar-well diffusion and microtiter plate assays.
Results and conclusions: A total of 56 volatile compounds were identified from beehive air, venom, bee insect and wax air including 6 fatty acids, 6 alcohols, 10 aldehydes, 5 esters, 1 ether, 9 hydrocarbons, 1 phenol, 7 ketones, 1 nitrogenous compound and 10 terpenes. The most abundant constituents were short-chain fatty acids (26.32%) while the lowest were the nitrogenous compounds (0.82%). The principal component analysis (PCA) scores plot of the UPLC/MS dataset showed the similarity of the beehive air to the insect bee's aroma profile. With regards to antimicrobial assay, beehive air and venom exerted the strongest antimicrobial activity among the examined bee products against S. aureus, K. pneumoniae, A. baumannii, and MRSA in agar-well diffusion assay but failing to exert an effect using microtiter plate assay as in case of bee venom against the aforementioned bacteria.
Keywords
Beehive air
Solid-phase microextraction (SPME)
Principal component analysis
Antimicrobial activity

1 Introduction
Honey bees, Apis mellifera L. (Hymenoptera: Apidae), are well known for their importance in crops pollination and the contribution to primary health care. Apart from honey, bees produce bee pollen, bee bread, royal jelly, propolis (bee glue), bee venom, and beeswax. Bee products (e.g. honey and beeswax) have been utilized and documented since ancient Egyptian and Asian times for their benefits in religious sacrifices, as a cure for bruises and suppurating sores (propolis), as an astringent, to treat cough, fever, and inflammation (honey), and as an sedative tonic (pollen) (Mizrahi and Yaacov, 2013). Since ancient times, honey has also been used to cure coughs and sore throats as part of traditional medicine and is increasingly being adopted by the modern pharmacopeia. Manuka honey has well-documented antimicrobial and antifungal properties and is prescribed by physicians across the world for a wide variety of medical problems, especially those of the respiratory tract (El-Sound, 2012).
Beehive air therapy is currently utilized to treat asthma, bronchitis, lung fibrosis, and respiratory tract infections. This treatment strategy is authorized in developed countries such as Germany, Hungary, Slovenia, and Austria and is based on the inhalation of beehive air, which is saturated with volatile compounds derived from the bee products. Modern science has revealed that each bee product (raw material, crude extract, and purified active compounds) is economically important due to the several potent bioactivities, such as antimicrobial, antiviral, antitumor, and anti-inflammatory potential (Alvarez-Suarez, 2017). A recent study demonstrated the effectiveness of honey for cough relief and sleep quality improvement was efficient in children compared to diphenhydramine. Equally interesting, the herbal preparations containing propolis have been utilized to prevent respiratory tract infections in children (Tilahun et al., 2015). Previous studies have concluded that the bee products exhibit antibacterial activity against Staphylococcus aureus (Silici and Kutluca, 2005), Klebsiella pneumoniae, Acinetobacter baumannii (Morroni et al., 2018), and multi drug-resistant Staphylococcus aureus (MRSA) (Alotibi et al., 2018; Chen et al., 2017). Further, clinical investigations proved the antimicrobial potential against both Gram-positive and Gram-negative bacteria (Basualdo et al., 2007) and suggested the involvement of the volatile components in these effects. The well recognized anti-inflammatory, anti-microbial and dietary applications of bee products and in particular the volatile constituent over the centuries poses a possible promising treatment for microbial diseases.
Given this context, the characterization of the aroma profiles of bee products is thus warranted, and more efforts have increasingly focused on their identification utilizing techniques such as high-performance liquid chromatography (HPLC), mass spectrometry (MS), liquid chromatography–MS/MS (LC-MS/MS), gas chromatography-mass spectrometry (GC–MS), and nuclear magnetic resonance (NMR) (De-melo et al., 2018; Zhao et al., 2017). Headspace solid phase micro-extraction (HS-SPME) followed by GC–MS is one of the most advanced techniques for studying the volatile profiles of the biological samples. HS-SPME-GC–MS is the technique of choice for fingerprinting and quantifying of specific classes of volatile compounds and has been applied for the identification of volatile compounds in bee products (Isidorov et al., 2009; Farag et al., 2017a).
The main objective of this study was to explore the efficiency of beehive air therapy against gram-positive and gram-negative bacteria and to correlate this activity with its volatile composition. Consequently, the study was designed in a way to determine beehive air aroma profile and further to distinguish individual components viz. bee insect, venom, and wax using same platform in order to determine the major aroma contributors to beehive air. Considering the complexity of acquired data and to classify specimens aroma in an untargeted manner, unsupervised viz. principal component analysis (PCA) and hierarchical clustering analysis (HCA) were employed and also to ensure a good analytical rigorousness. This study is the first detailed report of the major aroma contributors of beehive air volatiles using multivariate data analyses.
2 Materials and Methods
2.1 Bee hive material
Samples were collected from a Carniolan hybrid honeybee (Apis mellifera L.) apiary at the Bee Research Department, Plant Protection Research Institute, Agricultural Research Centre, Egypt, in April 2018. The samples investigated in the current study were beehive air, honey, bee insect, venom, propolis, bee bread, and wax. Beehive air is a representative sample consisting of propolis: honey: wax: bee bread: royal jelly: larvae drones: larvae queen: venom (10:10:10:10:10:10:1:1:1:0.2), respectively. The flavor thus is the result of the honey bee products when mixed together.
Three to four biological replicates were analysed for each sample. Samples were immediately analysed after collection.
2.2 Chemicals and materials
SPME fibres of StableFlexTM coated with divinylbenzene/ carboxen/polydimethylsiloxane (DVB/CAR/PDMS, 50/30 µm) or PDMS (polydimethylsiloxane) were purchased from Supelco (Oakville, ON, Canada).
2.3 Volatiles analysis
The HS-SPME volatile analysis was carried out as we described recently with slight modifications (Farag et al., 2017a). Bee hive components (300 mg) were placed in SPME screw cap vials (1.5 mL) and spiked with 2 µg of (Z)-3-hexenyl acetate per vial as an internal standard dissolved in water. An SPME fibre was inserted manually into vial containing samples, placed in an oven, and kept at 50 °C for 30 min. The fibre was subsequently withdrawn into a needle and then injected into the GC–MS port. GC–MS analysis was performed on a Schimadzu GC-17A gas chromatogram equipped with a DB-5 column (30 m × 0.25 mm i.d. × 0.25 µm film thickness; Supelco) and coupled to a Schimadzu QP5050A mass spectrometer. The interface and the injector temperatures were both set at 220 °C. A gradient temperature program was used for volatiles analysis. The oven temperature was initially held at 40 °C for 3 min and then was increased to 180 °C at a rate of 12 °C min−1, held at 180 °C for 5 min, and finally ramped at a rate of 40 °C min−1 to 240 °C and held at this temperature for 5 min. Helium was used as the carrier gas at a total flow rate of 0.9 mL/min. Splitless injection mode was used for analysis considering the lower levels of volatiles in the samples. The SPME fibre was prepared for the next analysis by placing it in the injection port for 2 min at 220 °C to ensure complete elution of volatiles. Blank runs were performed during the samples analyses. The HP quadruple mass spectrometer was operated in EI mode at 70 eV, and the scan range was set at m/z 40–500. Percentile levels were expressed after normalization to the amount of spiked internal standard (Z)-3-hexenyl acetate absent from bee hive aroma and each peak area was then divided by the total areas normalized to 100%.
2.4 GC–MS data processing and multivariate analysis
Volatile components were identified by comparing their retention indices (RI) relative to n-alkanes (C6-C20) and matching to spectra in NIST database and with standards whenever possible. Peaks were first deconvoluted using AMDIS software (www.amdis.net) prior to mass spectral matching to NIST, the WILEY library database, and with standards whenever available. Volatiles abundance data were extracted for multivariate data analysis using MET-IDEA software (Broeckling et al., 2006). The data were then subjected to PCA, HCA, and partial least squares-discriminant analysis (OPLS-DA) using the SIMCA-P version 13.0 software package (Umetrics, Umeå, Sweden). Markers were subsequently identified.
2.5 Antimicrobial assay using agar diffusion
The antibacterial activities of the bee hive products (beehive air, venom, honey, and wax) was assessed against the following bacterial strains: S. aureus ATCC 6538, K. pneumoniae ATCC 13883, A. baumannii ATCC 19606, and MRSA isolated from an intensive care unit patient at Naser Institute Hospital. An inoculum was prepared by culturing the bacteria on brain heart agar (BHA) (Oxoid, UK) and incubating them for 24 h at 36 ± 1 °C. After incubation, the bacterial suspension was diluted with sterile physiological solution and adjusted to be equivalent to the 0·5 McFarland standard (1 × 10 8 CFU/mL). The inoculum suspension was uniformly spread using a sterile cotton swab on 30 mL of a solidified Mueller-Hinton Agar (MHA) and was allowed to dry for 5 min.
The antimicrobial activity of the bee hive samples was screened using the agar-well diffusion method against S. aureus, K. pneumoniae, A. baumannii, and MRSA. For each sample, 100 mg was added to each of the 5 wells (8 mm diameter holes cut in the agar gel) and the plate was allowed to stand on the bench for 1 h for proper diffusion. The following conventional positive controls were used (100 µL): gentamicin (8 μg/mL) for S. aureus and K. pneumoniae, vancomycin (8 μg/ mL) for MRSA, and amikacin (32 μg/mL) for A. baumannii. Tests were performed in triplicate.
The plates were then sealed with parafilm and incubated overnight at 36 ± 1 °C under aerobic conditions. The resulting inhibition zones were measured in millimetres (mm)
2.6 Antimicrobial assay using in microtiter plate
Microtiter plate assay was used to assess venom remote antimicrobial effect against S. aureus, as being the most potent among other bee hive products. An amount equivalent to 100 mg of bee venom was placed in the 1st well of the plate and 100 µL bacterial suspension of S. aureus diluted in nutrient broth and adjusted to be equivalent to the 0·5 McFarland standard (1 × 10 8 CFU/mL) then further diluted in nutrient broth in a ratio of 1:100 and placed in each of the four adjacent wells (2nd, 3rd, 4th wells). Negative control was included by the addition of bacterial suspension in a separate plate without addition of bee hive product. Test was done in duplicate. Plates were then sealed by parafilm and incubated at 37 °C for 14 h.
After incubation, viable count of tested bacterial suspension compared to that of control was determined, where 20 μL of bacterial suspensions of each of the four wells adjacent to the venom was serially diluted in 180 μL physiological saline diluents. Ten microliters from each dilution was spotted on nutrient agar plate and incubated for 24 h. Viable count was expressed as CFU/mL. Viable count was calculated according to the following equation (Viable count (CFU/mL) = count/dilution factor).
3 Results and discussion
The main objective of this study was to explore the chemical composition of beehive air and its different components viz. venom, wax, honey and bees and studied anti-microbial effects to determine it’s as aromatherapy against the microorganisms.
3.1 Volatile compounds
In the current study, GC–MS analysis of beehive air and its individual components viz., insect, venom, honey, propolis, bee bread, royal jelly, and wax collected using headspace static SPME led to the identification of 56 volatile components categorized as fatty acids, alcohols, aldehydes, esters, ether, hydrocarbons, phenol, ketones, nitrogenous compound, and terpenes, as shown in Table 1. It should be noted that initial screening revealed for a weak aroma profile of honey, propolis (see Supplementary Fig. S1 online), royal jelly and bee bread compared to beehive air and its components viz. venom, wax, and insect. Representative GC–MS chromatogram of the identified volatile peaks is displayed in Fig. 1 for the beehive air, venom, insect, and wax, respectively. Among the identified volatiles, a total of 44 are reported from beehive air for the first time in this study. The increase in the identification score is mediated via data processing using the AMDIS program, which facilitates peak deconvolution and enhances the detection of volatiles at lower levels. The most abundant volatile class was the fatty acids (26.3%), whereas nitrogenous compounds had the lowest percentile levels (0.8%) in beehive air.
RT
RI
Compound name
Class
Average
Beehive air
Bee insect
Bee venom
Beeswax
2.43
681
Acetic acida
Acid
–
–
trace
–
11.23
1166
n-Caprylic acid
Acid
14.4 ± 7.8
26.3 ± 18.1
1.3 ± 1.2
–
12.38
1251
Nonanoic acid
Acid
0.4 ± 0.5
4.7 ± 3.4
0.1 ± 0.1
–
13.15
1309
Geranic acid
Acid
10.5 ± 14.7
6.3 ± 4.5
0.6 ± 0.6
–
15.84
1525
Dodecanoic acid
Acid
0.1±±0.1
–
–
–
19.23
1723
Tetradecanoic acid
Acid
1.0 ± 1.3
–
0.1 ± 0.1
–
Total acids
26.3
37.3
2.0
–
3.43
728
Isopropyl alcohol
Alcohol
0.1 ± 0.2
–
–
–
5.99
852
3-Hexenol
Alcohol
2.5 ± 3.5
–
0.1 ± 0.2
2.5 ± 3.8
6.74
889
2-Heptanol
Alcohol
–
–
–
–
9.13
1026
Benzyl alcohola
Alcohol
–
–
2.3 ± 2.1
–
9.48
1050
Cyclooctanol
Alcohol
0.1 ± 0.1
7.1 ± 7.1
17.6 ± 5.6
–
12.26
1241
Dec-2-en-1-ol
Alcohol
0.2 ± 0.3
1.1 ± 0.2
1.6 ± 1.2
–
Total alcohols
2.9
8.2
21.6
2.5
7.89
952
Benzaldehydea
Aldehyde
3.3 ± 2.4
–
9.4 ± 6.9
–
8.38
981
Octanal
Aldehyde
–
–
3.5 ± 3.0
–
9.25
1033
Benzeneacetaldehyde
Aldehyde
5.6 ± 3.7
0.8 ± 0.8
0.6 ± 0.5
–
9.31
1038
(E)-2-Octenal
Aldehyde
–
–
2.5 ± 2.2
–
9.98
1080
Nonanala
Aldehyde
0.6 ± 0.6
–
0.1 ± 0.2
2.0 ± 2.7
10.29
1100
1-Methyl-3-cyclohexene-1-carbaldehyde
Aldehyde
–
–
10.4 ± 7.5
–
11.39
1178
Decanal
Aldehyde
0.4 ± 0.2
3.4 ± 1.2
4.7 ± 1.2
–
12.18
1235
5-Hydroxymethylfurfural
Aldehyde
5.2 ± 7.3
–
–
–
12.18
1236
(Z)-2-Decenal
Aldehyde
0.3 ± 0.2
0.6 ± 0.2
1.1 ± 0.8
–
12.55
1264
(E)-Cinnamaldehydea
Aldehyde
1.1 ± 0.9
–
0.03 ± 0.05
–
Total aldehyde
16.4
4.8
32.4
2.0
6.15
860
Isoamyl acetate
Ester
–
0.5 ± 0.1
0.9 ± 1.2
–
9.18
1029
iso-Amyl iso-butyrate
Ester
–
–
1.6 ± 1.1
–
11.37
1176
Methyl salicylatea
Ester
8.0 ± 3.3
1.0 ± 0.6
1.7 ± 1.2
50.6 ± 12.8
11.68
1198
2-Octyl acetate
Ester
0.04 ± 0.1
0.5 ± 0.5
0.5 ± 0.3
–
13.86
1368
(E)-2-Decenyl acetate
Ester
0.7 ± 0.6
0.4 ± 0.0
0.6 ± 0.5
–
Total ester
8.7
2.4
5.2
50.6
12.57
1265
(E)-Anetholea
Ether
0.2 ± 0.3
0.2 ± 0.2
0.5 ± 0.6
–
Total ethers
0.21
0.2
0.5
–
11.22
1165
Decanea
Hydrocarbon
1.2 ± 0.7
4.9 ± 0.3
0.5 ± 0.6
20.2 ± 9.0
13.75
1357
Tridecane
Hydrocarbon
1.7 ± 0.4
5.3 ± 0.6
0.9 ± 1.0
–
14.86
1450
Unknown hydrocarbon
Hydrocarbon
1.7 ± 0.3
4.3 ± 0.5
0.7 ± 0.8
6.7 ± 6.6
17.71
1620
Hexadecanea
Hydrocarbon
4.8 ± 2.7
6.4 ± 1.3
0.7 ± 0.7
8.7 ± 9.6
20.92
1810
Octadecane
Hydrocarbon
0.3 ± 0.4
3.1 ± 3.1
2.7 ± 2.9
–
20.92
1811
9-Nonadecene
Hydrocarbon
1.2 ± 1.5
–
3.5 ± 2.7
–
21.76
1878
Nonadecanea
Hydrocarbon
–
–
1.3 ± 1.7
–
22.02
1869
Tetracosane
Hydrocarbon
–
–
2.9 ± 2.9
–
22.09
1872
Unknown hydrocarbon
Hydrocarbon
–
–
2.9 ± 2.9
–
Total hydrocarbon
11.0
24.1
16.1
35.6
1.78
649
Acetone
Ketone
–
1.1 ± 0.3
–
–
6.46
875
2-Heptanone
Ketone
–
1.2 ± 1.2
–
–
9.79
1068
2 Nonanone
Ketone
5.7 ± 4.6
15.5 ± 8.6
18.8 ± 26
7.6 ± 3.3
10.88
1141
Pyranone
Ketone
0.6 ± 0.8
–
–
–
12.72
1276
2-Decanone
Ketone
5.1 ± 2.2
1.1 ± 0.3
0.4 ± 0.5
–
13.58
1345
9-Hydroxy-2-nonanone
Ketone
1.7 ± 1.3
0.1 ± 0.1
0.2 ± 0.1
–
14.39
1411
(Z)-Geranylacetone
Ketone
1.3 ± 0.4
4. ± 0.9
1.1 ± 1.1
–
Total ketone
14.4
23.0
20.5
7.6
5.41
825
n-Butyl nitrite
Nitrogenous
0.8 ± 0.9
–
0.5 ± 0.7
–
Total nitrogenous
0.8
–
0.5
–
13.43
1333
Eugenola
Phenol
2.0 ± 0.2
–
–
–
Total phenol
2.2
–
–
–
8.82
1006
Limonenea
Terpene
0.5 ± 0.2
–
0.2 ± 0.2
1.6 ± 1.6
9.91
1076
β-Linaloola
Terpene
4.9 ± 4.0
–
0.5 ± 0.4
–
10.56
1119
Unknown monoterpene
Terpene
–
–
–
–
13.24
1317
α-Cubebene
Terpene
1.5 ± 1.8
–
0.1 ± 0.1
–
13.63
1349
Germacrene D
Terpene
2.7 ± 0.6
–
0.02 ± 0.02
–
13.63
1349
Copaene
Terpene
3.6 ± 0.9
–
0.2 ± 0.1
–
14.17
1392
α-Farnesene
Terpene
0.5 ± 0.0
–
–
–
14.20
1395
β-Caryophyllenea
Terpene
1.8 ± 0.2
–
0.01 ± 0.01
–
14.63
1431
α-Humulenea
Terpene
1.0 ± 0.2
–
0.02 ± 0.03
–
15.32
1467
δ-Cadinene
Terpene
0.6 ± 0.2
–
0.1 ± 0.1
–
Total terpenes
17.1
–
1.1
1.6
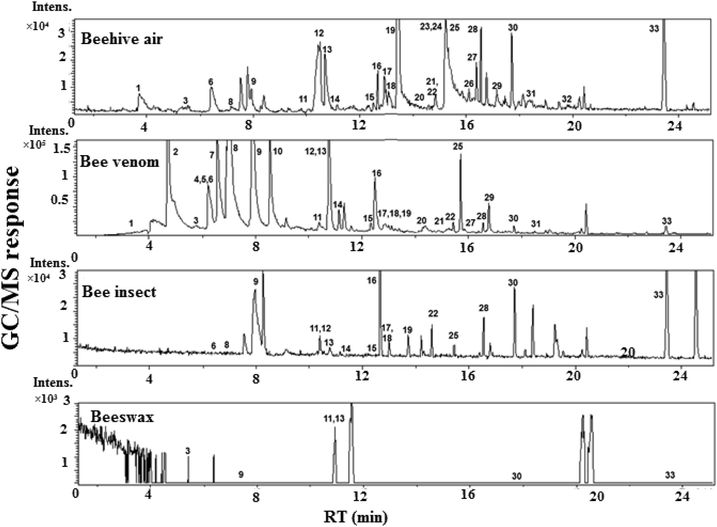
Representative SPME GC–MS chromatograms of beehive air, bee venom, bee insects and beeswax headspace. (1) benzaldehyde, (2) octanal, (3) limonene, (4) benzyl alcohol, (5) iso-amyl iso-butyrate, (6) benzeneacetaldehyde, (7) (e)-2-octenal, (8) cyclooctanol, (9) 2-nonanone, (10) 1-methyl-3-cyclohexene-1-carbaldehyde, (11) decane, (12) n-caprylic acid, (13) methyl salicylate, (14) 2-octyl acetate, (15) 2-decenal, (z)-, (16) dec-2-en-1-ol, (17) nonanoic acid, (18) anethole, (19) 2-decanone, (20) α-cubebene, (21) eugenol, (22) 9-hydroxy-2-nonanone, (23) germacrene D, (24) copaene, (25) tridecane, (26) α-farnesene, (27) caryophyllene, (28) (Z)-geranylacetone; 29) α-humulene, (30) unknown hydrocarbon, (31) δ-cadinene-, (32) dodecanoic acid, (33) hexadecane.
Fatty acids were the dominant volatiles class, accounting for ca. 26.3%, 37.3% and 2.0% of beehive air, insect and venom, respectively. The fatty acids included a total of 6 volatile constituents: acetic acid, n-caprylic acid, nonanoic acid, geranic acid, dodecanoic acid, and tetradecanoic acid. The most abundant fatty acid was n-caprylic in beehive air (14.4%), bees' insects (26.3%), and venom (1.3%). Venom was rich with aldehyde derivatives (ca. 32.4%) compared to beehive air (ca. 16.4%), insect (4.8%), and wax (2.0%). Aldehydes accounted for the largest number of identified volatile constituents (10 compounds) and the most dominant compounds were 1-methyl-3-cyclohexene-1-carbaldehyde (10.4%), benzaldehyde (9.4%), and decanal (4.7%) in venom, benzeneacetaldehyde (5.6%) and 5-hydroxymethylfurfural (HMF)(5.2%) in beehive air, and nonanal (2.0%) in wax. Ketones were major volatile forms, accounting for ca., 14.4%, 23.0%, 20.5%, and 7.6% in beehive air, insect, venom, and wax; respectively. A total of 7 ketones were identified. Predominant ketone was 2-nonanone detected at 5.7%, 15.5%, 18.8%, and 7.6% in beehive air, insect, venom, and wax, respectively. Wax aroma was enriched in hydrocarbons (35.6%) compared with (24.1%) in insect, venom (16.1%), and beehive air (11.0%). Decane was the dominant compound in wax (20.2%). Terpenes, esters, ethers, alcohols, phenol, and nitrogenous compounds were also detected, though at much lower levels as illustrated in Table 1. β-Linalool was the dominant terpene at ca. 4.9%, and 0.5% in beehive air and venom, respectively. (E)-Anethole was identified as an ether in beehive air, insect and venom at levels ranging from 0.2 to 0.5%. Methyl salicylate monoterpenoid ester was detected at the highest level in wax, at 50.6% followed by 8.0% in beehive air. A phenolic ether (eugenol) responsible for clover flower bud aroma was interestingly also detected in beehive air (2.2%). The qualitative and quantitative differences among the examined specimens were mostly observed between beehive air and venom. Beehive air was predominated by the presence of dodecanoic acid, isopropyl alcohol, HMF, pyranone, eugenol, and α-farnesene at low abundance (0.1–5%). While the same compounds were present at very low concentrations or even absent in the bee products (bee bread, honey, and propolis). The existence of these compounds in the beehive air constituents was owned to the synergistic effect of the many bee products.
Venom volatile profile encompassed 9 volatiles that were absent from beehive air viz., benzyl alcohol, octanal, (E)-2-octenal, 1-methyl-3-cyclohexene-1-carbaldehyde, isoamyl acetate, iso-amyl iso-butyrate, nonadecane, tetracosane and unknown compound. Other identified volatiles that were previously reported in venom include isopentyl acetate, n-butyl acetate, iso-pentanol, n-hexyl acetate, n-octyl acetate, 2-nonanol, n-decyl acetate, benzyl acetate benzyl alcohol, and (Z)-11-eicosen-1-ol (Abd El-Wahed et al., 2019). Nonanal, decanal, β-linalool, benzaldehyde and eugenol were identified previously in honey and propolis (Bayraktar and Onoǧur, 2011; Escriche et al., 2012; Falcão et al., 2015; Odeh et al., 2007; Silva et al., 2016). Similarly, (E)-anethole, benzeneacetaldehyde, copaene, and methyl salicylate were previously identified (Falcão et al., 2015; Remirez et al., 1997; Santos et al., 2015; Silici and Kutluca, 2005), while hexadecane, cinnamaldehyde, 2-decanone, and 3-hexenol were isolated from honey (Alissandrakis et al., 2005; Santos et al., 2015; Verzera et al., 2001). Further, geranic acid was identified in the Nassanoff pheromone of the honeybee and 2-nonanone was identified in royal jelly (Pickett et al., 1980; Zhao et al., 2016).
3.2 GC–MS- based multivariate data analysis of beehive air, bee insect, bee venom, and beeswax aroma data
Untargeted multivariate data analyses were further performed in order to reveal for the differences in volatiles compositional embedded within the different bee hive specimens. Beehive air, insect, wax and venom showed the strongest volatiles profiles, as revealed by GC–MS analysis (Fig. 1) and were subjected to unsupervised multivariate data analyses including hierarchical cluster analysis including HCA and PCA. The un-decoded similarities and variabilities among specimens were explained first via HCA using the Ward's algorithm and subsequently evaluated later based on the distances between the clusters (the squared Euclidean distance). The reproducibility of the volatiles and extraction conditions was clearly evidential in the tight clustering of the independent biological triplicates within the same specimen, as shown in Fig. 2-A.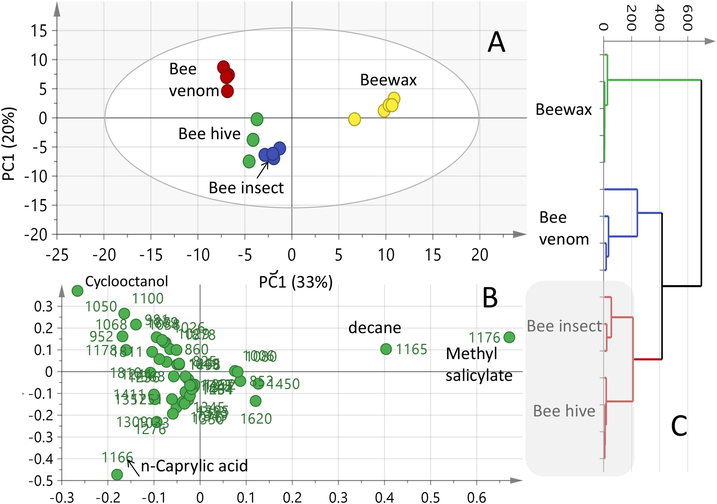
Principal component analyses and clustering analyses of total bee hive air, bee insect, bee venom and beeswax analyzed by SPME-GC–MS (n = 3). Clusters are located at the distinct positions in two-dimensional space described by two vectors of principal component 1 (PC1) = 33% and PC2 = 20%. (A) Score Plot of PC1 vs. PC2 scores, (B) Loading plot for PC1 & PC2 contributing mass peaks and their assignments, with each volatile denoted by its KI values and (C) Hierarchical clustering analysis.
The HCA-driven dendrogram (Fig. 2-C) displayed two clear clusters; cluster “1a”, which was composed of wax specimens and cluster “1b”, in which the rest of the bee volatile specimens were grouped altogether. In addition, the total beehive air and insect specimens were distinctly clustered in one sub-branch in cluster “1b” signifying their volatiles compositional resemblance as highlighted in the grey box. A PCA model (Fig. 2-A & B) was further generated using the same data matrix to discriminate between the bee hive specimens and identify key volatiles mediating for specimen segregation. The established model prescribed by the two orthogonal PCs, accounted for 53% of the total variance that is i.e., PC1, accounted for 33% of the variance versus 20% for PC2. The PC1/PC2 score plot (Fig. 2-A) showed that triplicates of the beewax were positioned on the far-right side of the plot (positive PC1 values), whereas, most of the other specimens namely total beehive air, insect and venom were located on the far left side (negative PC1 values) and in agreement with the HCA analysis. The separation observed in the PCA can be explained in terms of the annotated volatiles from the corresponding loading plot (Fig. 2-B). The MS signals for methyl salicylate, and to lesser extent, the hydrocarbon decane had a positive effect on PC1, contributed the most to specimens discrimination based on their enhancement in wax. The separation of venom samples (Fig. 2-B) along PC2 can be explained in terms of the enrichment of cyclooctanol, which contributes positively to PC2. It should be noted that this PCA model showed the close resemblance of the beehive air and insect aroma profiles being both enriched in caprylic acid ‘’fatty acid’’ and accounting for their segregation together on the left lower quadrant of the PCA plot.
The PCA scores revealed for the closer volatile profiles of beehive air and that of insect showed comparable volatiles profile (Fig. 2A), with 21 common volatiles, indicating that hive aroma is mostly influenced by its live bee released volatiles.
This result suggests that the clinical function of beehive air depends on the inclusion of both insects and the hive in the inhalation setup. The insect aroma was enriched mostly in fatty acids (n-caprylic acid 26.3%), alcohols (cyclooctanol 7.6%), and ketones (2-nonanone 15.5%) compared with beehive air.
3.3 Antimicrobial assay via disc diffusion assay
The antimicrobial activity of different bee products viz., beehive air, venom, honey, and wax was firstly assessed using disc diffusion assay by placing beehive components in agar medium with no solvent dilution step and tested against S. aureus, K. pneumoniae, A. baumannii, and MRSA at a dose of 100 mg per disc well at 37 °C for 24 h. The antimicrobial drugs (positive controls) were included i.e., gentamicin for S. aureus, K. pneumoniae, vancomycin for MRSA and amikacin for A. baumannii (Table 2 & Fig. 3). aGentamycin ; bamikacin;cvancomycin.
Zone diameter inhibition (mm)
Samples
S. aureus
K. pneumonia
A. baumannii
MRSA
Beehive air
14.3
–
–
10.3
Bee venom
19.3
19.3
21.3
21.3
Beeswax
–
–
–
–
Positive control
20a
20a
15b
14.5c
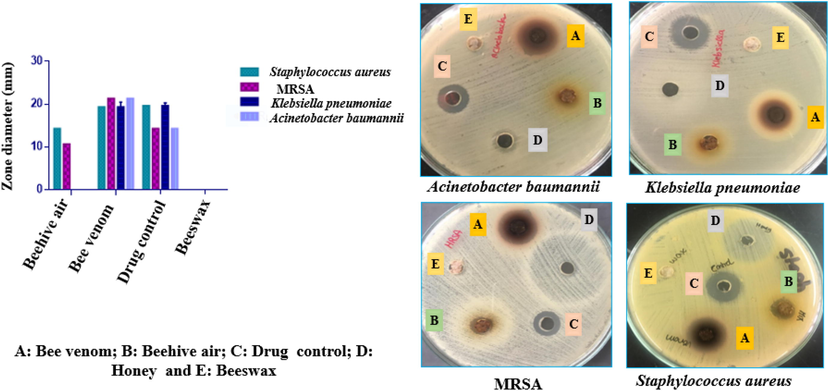
Antimicrobial activity of bee product against the Staphylococcus aureus, Klebsiella pneumoniae, Acinetobacter baumannii, and multi drug resistant Staphylococcus aureus (MRSA) using agar-well diffusion method at the doses100 mg and using drugs control (100 µL; gentamicin (8 μg/mL) for Staphylococcus and Klebsiella, vancomycin (8 μg/mL) for MRSA and amikacin (32 μg/mL) for Acinetobacter. Tests were performed in triplicate.
The antibacterial activity of the samples revealed that both venom and beehive air demonstrated the strongest antimicrobial effect against S. aureus, K. pneumoniae, A. baumannii, and MRSA compared with the positive control, and venom was superior to that of beehive in agar-well diffusion. Venom exhibited the largest inhibition zones of 19.3 mm for S. aureus and K. pneumoniae and of 21.3 mm for A. baumannii and MRSA. Beehive air was active against S. aureus and MRSA with an inhibition growth zone of 14.3 and 10.3 mm, respectively.
The antimicrobial activity of venom and beehive air is likely to be mediated by decanal, nonanoic acid, eugenol, nonanal, β-linalool, and (E)-cinnamaldehyde (Gill and Holley, 2004; Qiu et al., 2010; Yadav et al., 2015; Zhang et al., 2017). A mixture of caprylic acid and monocaprylin exhibits bactericidal action against Streptococcus agalactiae, Streptococcus dysgalactiae, Streptococcus uberis, S. aureus, and Escherichia coli (Nair et al., 2005).
With regards to the antimicrobial effect of honey aroma, it did not show any clear zone of inhibition against any of the tested organism, just a halo zone surrounding the cup is found in case of K. pneumoniae and MRS. This was in agreement with a the weak aroma profile as revealed from GC–MS analysis (data not shown). For S. aureus and A. baumannii, a decrease in the growth density zone and not a complete bacterial inhibition was observed with a diameter of 32 and 13.3 mm, respectively. Although, honey is known to inhibit the growth of S. aureus, A. baumannii, MRSA , and K. pneumoniae bacteria (Alotibi et al., 2018; Qamar et al., 2018), we did not report this impact under the current experimental condition. One explanation is that the honey’s biological activity is closely related to its chemical composition, plant origin, and climate as well as bee species. The high osmotic nature and naturally low pH (3.2–4.5), ability to produce hydrogen peroxide, which plays a key role in the antimicrobial activity of honey and phytochemical factors are attributed honey to have potent bactericidal and bacteriostatic activity against pathogenic bacteria (Tenório et al., 2015; Wasihun and Kasa, 2016; Abdelmegid et al., 2015). The zone formed in case of honey may be explained as a case hetero-resistance, a poorly characterized phenomenon that occurs in Gram-positive and Gram-negative. Heteroresistance is resistance to certain antibiotic expressed by a subset of a microbial population that is generally considered to be susceptible (El-Halfawy and Valvano, 2015; Falagas et al., 2008). Such results discrepancies among the different studies may be due to difference in methodology application between the investigations such as the technique utilized for agar dilution, water content of the honey, the composition of the honey and the honey sources (Ramos et al., 2018).
In summary, this study presents the first insight into the similarities and variations of the volatile profiles of bee products, with a particular emphasis on beehive air.
3.4 Antimicrobial assay via microtiter plate assay
In order to make a clear distinction between the antimicrobial activity of volatile fraction and non-volatile materials of beehive products, antimicrobial activity was further assessed using microtiter plate technique ensuring physical separation between beehive air and targeted microorganism by placing each in a different well following the protocol described in (Farag et al., 2017b). The test was only performed on venom against S. aureus ATCC, as being the most potent among the examined beehive products. 100 mg of bee venom was placed in the 1st well of the plate and 100 µL bacterial suspensions of S. aureus diluted in nutrient broth was placed in each of the four adjacent wells (2nd, 3rd, 4th wells). Negative control was done by the addition of bacterial suspension in a separate plate without addition of beehive product. Post incubation, no difference in viable count of tested bacterial suspension was detected compared to that of negative control (see Supplementary Fig. S2 online).
Beehive components fail to induce an antimicrobial effect to S. aureus and our hypothesis is that the bee volatile compounds exhibit another remote effect via its volatiles composition and not a direct anti-microbial action. Further bioassays are needed to conclude the effectiveness of beehive air as a strategy for apitherapy.
4 Conclusion
In the current study, 56 volatile compounds were identified from beehive air and its individual components and categorized into fatty acids, alcohols, aldehydes, esters, ether, hydrocarbons, phenol, ketones, nitrogenous compounds, and terpenes. The abundance of n-caprylic acid, cinnamaldehyde, geranic acid, decanal, limonene, eugenol, benzaldehyde, nonanoic acid, nonanal, β-linalool, caryophyllene, α-humulene, cinnamaldehyde, limonene, eugenol, and benzaldehyde were closely related to their anti-inflammatory, anti-asthmatic and antimicrobial actions. Taken together, this information could support the validity of beehive air aromatherapy for the treatment of respiratory tract disorders such as asthma, bronchitis, and lung fibrosis, although no direct evidence was found in this study based on employed anti-microbial assay. Further investigations are now needed to examine other biological effects of beehive air remotely and to also determine how these volatiles function mechanistically and their actual role the treatment. Profiling other beehive aroma from other localities or of bees reared on different crops, different climate could provide stronger information on variation in volatiles composition among beehives. Honey, for example, produced more than 600 volatile compounds, including hydrocarbons, aldehydes, alcohols, ketones, acids, esters, terpenes and cyclic compounds. The aroma contents and biological properties of honey are influenced qualitatively and quantitatively by botanical and geographical origin (Ramos et al., 2018).
Acknowledgment
Dr. G. A. M. Mersal thanks Taif University Researchers Supporting Project number (TURSP-2020/14), Taif University, Taif, Saudi Arabia and Dr. M. A. Farag thanks the Alexander von Humboldt Foundation. Authors are very grateful for the financial support from VR, Grant number 2016-05908.
Declaration of Competing Interest
The authors declare that they have no known competing financial interests or personal relationships that could have appeared to influence the work reported in this paper.
References
- Effect of honey and green tea solutions on Streptococcus mutans. J. Clin. Pediatr. Dent.. 2015;39:435-441.
- [CrossRef] [Google Scholar]
- Bee venom composition: From chemistry to biological activity. Studies in Natural Products Chemistry 2019:459-484.
- [CrossRef] [Google Scholar]
- Flavour compounds of Greek cotton honey. J. Sci. Food Agric.. 2005;85:1444-1452.
- [CrossRef] [Google Scholar]
- Floral markers and biological activity of Saudi honey. Saudi J. Biol. Sci.. 2018;25:1369-1374.
- [CrossRef] [Google Scholar]
- Comparison of the antibacterial activity of honey from different provenance against bacteria usually isolated from skin wounds. Vet. Microbiol.. 2007;124:375-381.
- [CrossRef] [Google Scholar]
- Investigation of the aroma impact volatiles in Turkish pine honey samples produced in Marmaris, Datça and Fethiye regions by SPME/GC/MS technique. Int. J. Food Sci. Technol.. 2011;46:1060-1065.
- [CrossRef] [Google Scholar]
- MET-IDEA: Data extraction tool for mass spectrometry-based metabolomics. Anal. Chem.. 2006;78:4334-4341.
- [Google Scholar]
- Antibacterial activity of propolins from Taiwanese green propolis. J. Food Drug Anal.. 2017;26:761-768.
- [CrossRef] [Google Scholar]
- Phenolic profile by HPLC-MS, biological potential, and nutritional value of a promising food: Monofloral bee pollen. J. Food Biochem.. 2018;42(5):e12536.
- [CrossRef] [Google Scholar]
- Antimicrobial heteroresistance: An emerging field in need of clarity. Clin. Microbiol. Rev.. 2015;28:191-207.
- [CrossRef] [Google Scholar]
- Honey between traditional uses and recent medicine. Maced. J. Med. Sci.. 2012;5:205-214.
- [CrossRef] [Google Scholar]
- A potentiometric electronic tongue for the discrimination of honey according to the botanical origin. Comparison with traditional methodologies: Physicochemical parameters and volatile profile. J. Food Eng.. 2012;109:449-456.
- [CrossRef] [Google Scholar]
- Heteroresistance: a concern of increasing clinical significance? Clin. Microbiol. Infect.. 2008;14:101-104.
- [CrossRef] [Google Scholar]
- The volatile composition of Portuguese propolis towards its origin discrimination. Rec. Nat. Prod.. 2015;10:176-188.
- [Google Scholar]
- Farag, Mohamed A., Ali, S.E., Hodaya, R.H., El-Seedi, H.R., Sultani, H.N., Laub, A., Eissa, T.F., Abou-Zaid, F.O.F., Wessjohann, L.A., 2017a. Phytochemical profiles and antimicrobial activities of Allium cepa red cv. and A. sativum subjected to different drying methods: A comparative MS-based metabolomics. Molecules 22, 761–779. doi: 10.3390/molecules22050761.
- Farag, Mohamed A, Song, G.C., Park, Y., Audrain, B., Lee, S., Ghigo, J., Kloepper, J.W., Ryu, C., 2017b. Biological and chemical strategies for exploring inter- and intra-kingdom communication mediated via bacterial volatile signals. Nat. Protoc. 12, 1359–1377. doi: 10.1038/nprot.2017.023.
- Mechanisms of bactericidal action of cinnamaldehyde against Listeria monocytogenes and of eugenol against L. monocytogenes and Lactobacillus sakei. Appl. Environ. Microbiol.. 2004;70:5750-5755.
- [CrossRef] [Google Scholar]
- Gas chromatographic-mass spectrometric investigation of the chemical composition of beebread. Food Chem.. 2009;115:1056-1063.
- [CrossRef] [Google Scholar]
- Bee products, properties, applications, and apitherapay. Springer Science & Business Media 2013
- [CrossRef] [Google Scholar]
- Comparison of the antimicrobial activities of four honeys from three countries (New Zealand, Cuba, and Kenya) Front. Microbiol.. 2018;9:1378-11346.
- [CrossRef] [Google Scholar]
- Antibacterial effect of caprylic acid and monocaprylin on major bacterial mastitis pathogens. J. Dairy Sci.. 2005;88:3488-3495.
- [CrossRef] [Google Scholar]
- A variety of volatile compounds as markers in Palestinian honey from Thymus capitatus, Thymelaea hirsuta, and Tolpis virgata. Food Chem.. 2007;101:1393-1397.
- [CrossRef] [Google Scholar]
- Nasonov pheromone of the honey bee, Apis mellifera L. (Hymenoptera: Apidae) J. Chem. Ecol.. 1980;6:425-434.
- [CrossRef] [Google Scholar]
- In vitro and in vivo activity of Manuka honey against NDM-1-producing Klebsiella pneumoniae ST11. Future Microbiol.. 2018;13:13-26.
- [CrossRef] [Google Scholar]
- Eugenol reduces the expression of virulence-related exoproteins in Staphylococcus aureus. Appl. Environ. Microbiol.. 2010;76:5846-5851.
- [CrossRef] [Google Scholar]
- Effect of botanical and physicochemical composition of Argentinean honeys on the inhibitory action against food pathogens. LWT – Food Sci. Technol.. 2018;87:457-463.
- [CrossRef] [Google Scholar]
- Protective effects of propolis extract on allyl alcohol-induced liver injury in mice. Phytomedicine Int. J. Phyther. Phytopharm.. 1997;4:309-314.
- [CrossRef] [Google Scholar]
- Study of the principal constituents of tropical angico (Anadenanthera sp.) honey from the atlantic forest. Food Chem.. 2015;171:421-425.
- [CrossRef] [Google Scholar]
- Chemical composition and antibacterial activity of propolis collected by three different races of honeybees in the same region. J. Ethnopharmacol.. 2005;99:69-73.
- [CrossRef] [Google Scholar]
- Plant natural products targeting bacterial virulence factors. Chem. Rev.. 2016;116:9162-9236.
- [CrossRef] [Google Scholar]
- Antimicrobial activity of honey of stingless bees, tiúba (Melipona fasciculata) and jandaira (Melipona subnitida) compared to the strains of Staphylococcus aureus, Escherichia coli and Pseudomonas aeruginosa. AIP Conf. Proc.. 2015;1702:10-14.
- [CrossRef] [Google Scholar]
- Nasal colonization and lower respiratory tract infections with methicillin-resistant Staphylococcus aureus. Am. J. Crit. Care. 2015;24:8-13.
- [Google Scholar]
- SPME-GC-MS analysis of honey volatile components for the characterization of different floral origin. Am. Lab.. 2001;33:18-21.
- [Google Scholar]
- Evaluation of antibacterial activity of honey against multidrug resistant bacteria in Ayder Referral and Teaching Hospital. Springer Plus. 2016;5:842-849.
- [CrossRef] [Google Scholar]
- Eugenol: A phyto-compound effective against methicillin-resistant and methicillin-sensitive Staphylococcus aureus clinical strain biofilms. PLoS One. 2015;10:e0119564
- [CrossRef] [Google Scholar]
- Anti-fungal activity, mechanism studies on α-phellandrene and nonanal against Penicillium cyclopium. Bot. Stud.. 2017;58:13-21.
- [CrossRef] [Google Scholar]
- Rapid determination of major compounds in the ethanol extract of geopropolis from Malaysian stingless bees, Heterotrigona itama, by UHPLC-Q-TOF/MS and NMR. Molecules. 2017;22:1935-1949.
- [CrossRef] [Google Scholar]
- Differential volatile organic compounds in royal jelly associated with different nectar plants. J. Integr. Agric.. 2016;15:1157-1165.
- [CrossRef] [Google Scholar]
Appendix A
Supplementary data
Supplementary data to this article can be found online at https://doi.org/10.1016/j.jksus.2021.101449.
Appendix A
Supplementary data
The following are the Supplementary data to this article:


