

Translate this page into:
Transcriptomic insights into skin cancer: A bioinformatics and network biology approach to biomarker identification
⁎Corresponding author. rohini@aimst.edu.my (Karunakaran Rohini)
-
Received: ,
Accepted: ,
This article was originally published by Elsevier and was migrated to Scientific Scholar after the change of Publisher.
Abstract
Skin cancer is a widespread malignancy that primarily affects light-skinned populations globally, categorized into melanoma and non-melanoma skin cancers (NMSCs). Basal cell carcinoma and squamous cell carcinoma are the most common subtypes within NMSCs, with the global incidence of NMSCs projected to reach 2–3 million cases annually across regions like Europe, Canada, the USA, and Australia. Despite this prevalence, the genetic mechanisms behind skin cancer remain poorly understood. This study presents a novel gene discovery approach, leveraging transcriptome data from Next-Generation Sequencing datasets sourced from the European Nucleotide Archive to uncover new genes and pathways linked to skin cancer. The novelty of this research lies in its comprehensive approach that combines differential gene expression analysis with gene network and pathway enrichment analysis to identify actionable therapeutic targets. By utilizing bioinformatics tools such as DESeq2, Gene Set Enrichment Analysis (GSEA), and Cytoscape, we revealed critical gene interactions and pathways that have been underexplored in the context of skin cancer. Following rigorous quality control using FastQC and transcriptome-seq data alignment to the human genome (hg38), we identified 19 differentially expressed genes, including 2 down-regulated and 17 up-regulated. Key genes such as IL6, CCND2, PLAUR, and CD44 were found to be involved in important pathways like IL6_JAK_STAT3_SIGNALING, ANGIOGENESIS, and APICAL_SURFACE. These findings provide valuable insights into skin cancer pathogenesis and offer potential therapeutic targets, laying the groundwork for future research aimed at improving treatment outcomes.
Keywords
DESeq analysis
Transcriptome analysis
Enrichment analysis
GSEA

1 Introduction
The human skin, the largest organ in the body, serves as a protective barrier against harmful environmental agents, chemicals, and pathogens. It consists of various layers, including the epidermis, papillary dermis, reticular dermis, and subcutaneous fat (Cives et al., 2020a). Skin cancer arises from the abnormal proliferation of skin cells, often triggered by genetic instability (Dwivedi et al., 2020). Among the most prevalent types of cancer globally, skin cancer primarily affects light-skinned populations. It is broadly classified into melanoma skin cancers (MSCs) and non-melanoma skin cancers (NMSCs) (D’Orazio et al., 2013; Gordon, 2013). NMSCs, particularly basal cell carcinoma (BCC) and squamous cell carcinoma (SCC), pose a significant threat to fair-skinned individuals worldwide, with an estimated global incidence of 2–3 million cases annually, notably in Europe, Canada, the USA, and Australia (Leiter et al., 2008). In the US, BCC and SCC represent approximately 70 % and 25 % of NMSC cases, respectively (Harris et al., 2021; Stegemann et al., 2007). While BCC typically shows lower malignancy and resembles epidermal basal cells, SCC is associated with a higher risk of recurrence and aggressive proliferation, depending on tumor size (Didona et al., 2018). These cancers often manifest in sun-exposed areas such as the head and neck, where ultraviolet (UV) radiation causes DNA damage, leading to somatic mutations, oxidative stress, and abnormal immune responses . UV radiation, particularly UVB rays, is a major factor in skin cancer development, as it induces DNA mutations and promotes tumor growth (Didona et al., 2018). Prolonged UV exposure can activate proto-oncogenes or deactivate tumor suppressor genes, further contributing to cancer progression. The p53 gene, a critical regulator of cellular function, is frequently mutated in skin cancer patients (Dwivedi et al., 2020). Other commonly mutated genes include ADGRV1, ANK3, APOB, BRAF, CSMD1, DNAH7, LRP1B, MUC16, PCLO, and TTN. For melanoma skin cancer, CXCL8, STAT1, CCL27, and IGF1R play key roles. Pathways such as Wnt/Hedgehog are dysregulated in BCC and SCC, while the NOTCH, TGF-β, NF-κB, and JAK-STAT pathways are implicated in melanoma. In this study, we performed a comprehensive transcriptomic analysis to explore the genetic mutations and associated genes involved in skin cancer. Using Next-Generation Sequencing (NGS) data from the European Nucleotide Archive (ENA), we conducted rigorous quality control and aligned the data to the human reference genome (hg38). The aligned data, in SAM format, was converted to BAM format and sorted for further analysis. We employed the DESeq2 package in R to identify differentially expressed genes (DEGs) linked to skin cancer. To understand the biological significance of these DEGs, we performed gene set enrichment analysis (GSEA), revealing key pathways and processes enriched in the data. Finally, we used Cytoscape to visualize gene interactions, creating a gene network that illustrated the complex relationships between the identified genes.
Our analysis uncovered key mutations and associated genes involved in skin cancer, providing novel insights into its molecular mechanisms. These findings may inform the development of targeted therapies and improve patient management.
2 Materials and Methods
2.1 Data Collection
We obtained Transcriptome-Seq data for human skin cancer and adjacent normal tissues from the ENA database in raw format for further analysis (Leiter et al., 2008). These samples were sequenced using the Illumina platform. The data is associated with Project ID PRJNA546533 and comprises a total of 12 datasets. The downloaded data files were in fastq.gz format, which is a text-based format used for storing both the sequenced biological sequence and its corresponding quality scores.
2.2 Transcriptome data analysis
The initial step in the Transcriptome-Seq data analysis protocol involves assessing the quality of raw data to identify and address any poor-quality reads that might impact subsequent analyses and interpretation. We utilize the FastQC Tool, specifically optimized for Illumina reads, which evaluates key parameters such as total base quality, per-tile quality, GC content, and sequence length distribution. Trimmomatic eliminates duplicated reads and removes low-quality reads to enhance data quality (de Sena Brandine and Smith, 2019).
2.3 Mapping and alignment of Transcriptome data
Following quality control, high-quality data undergo mapping and alignment to the human reference genome GRCh38/hg38 obtained from the ENSEMBL database. BOWTIE2, a Linux-based software, efficiently aligns reads to the reference genome, utilizing indexed files for accelerated alignment (Birney et al., 2004).. Paired-end data in fastq.gz format is inputted, generating a Sequence Alignment Map (SAM) file (Langmead and Salzberg, 2012). SAM files are converted to Binary Alignment Map (BAM) format using SAMTools for efficient storage and processing (Li et al., 2009). To optimize memory usage for subsequent analyses, the BAM alignment files are sorted.
2.4 Transcript Assembly and Quantification
The process of estimating gene and transcript expression involves assembling the mapped reads to the reference genome. Read quantification is performed by averaging the raw counts of mapped reads using the featureCounts program (Liao et al., 2014) which is implemented by the SourceForge Subread package (Liao et al., 2013). The featureCounts program is specifically designed for read counting, which is essential for quantifying reads mapped to specific genomic features defined in the reference file. It operates with two inputs: sorted BAM files containing mapped reads and a GTF reference file (such as hg38.gtf from ENSEMBL) for annotation. The output consists of a tab-delimited table of read counts, where rows correspond to transcripts (genes), and columns represent individual samples. This read counts file is used in subsequent differential expression analysis to identify differentially expressed genes (DEGs) between conditions or groups.
2.5 Differential expression analysis based on skin cancer samples
In this study, we conducted differential expression analysis to identify genes with significant alterations between normal and skin cancer samples. Raw read counts were obtained using featureCounts and served as input for DESeq2, a Bioconductor package in R Studio that applies negative binomial generalized linear models to detect differentially expressed genes (DEGs) (Anders and Huber, 2010). The count data was normalized, and genes were filtered using the false discovery rate (FDR) method, with an adjusted p-value (padj) threshold of < 0.05. We used Wald tests within DESeq2 to identify significant DEGs, applying a p-value cutoff of < 0.05. Genes were categorized as upregulated or downregulated based on their log2-fold change values, with positive values indicating upregulation and negative values indicating downregulation in skin cancer samples (Love et al., 2014). This approach allowed us to uncover key molecular alterations associated with skin cancer, providing valuable insights into potential biomarkers and therapeutic targets.
2.6 Gene Set Enrichment Analysis
Understanding the biological significance underlying differential gene expression profiles can be achieved through pathway analysis using GSEA (Reimand et al., 2019). Gene Set Enrichment Analysis is an effective method widely used to study functional enrichment between two biological groups. In this study, GSEA software was utilized to predict different Gene Ontology (GO) terms present in the gene expression data. The oncogenic signature gene sets (c6.all.v7.5.1.symbols.gmt) were used, considering a significant false discovery rate (FDR) q-value threshold of < 0.02. The analysis involved providing inputs such as the expression dataset file, phenotype labels file, gene sets file in gct, cls, and gmt formats, as well as loading the Chip annotation file. Subsequently, the data files were loaded, analysis parameters were set, and the analysis was executed.
2.7 Enrichment Map and network analysis
Enrichment Map is a freely available and open-source Cytoscape plugin used for visualizing enriched pathways in a network format (Magrane and Consortium, 2011; Merico et al., 2011). It simplifies the interpretation of results obtained from Gene Set Enrichment Analysis by representing relevant pathways as nodes connected by edges that share many genes. The nodes in the network are colored based on the ES score, and the size of the edges is determined by the number of genes shared between connected pathways. To explore individual gene interactions within different pathways, we selectively identify specific genes and construct a network by annotating these genes using the String Database within Cytoscape software (Szklarczyk et al., 2021).
3 Results and Discussion
3.1 Quality control and alignment Results
FastQC tool was utilized for quality control analysis on each individual sample. (de Sena Brandine and Smith, 2019) The output HTML and ZIP files from FastQC were scanned, and a comprehensive multiqc report (Ewels et al., 2016) was created to present the overall quality results for all the samples. This multiqc report allowed for easy visualization and comparative analysis of the quality metrics across all samples. Notably, the report included information on duplicate reads, which is presented in Table 1. Furthermore, the reads from the samples were aligned to a reference genome, and the overall alignment rate was calculated (Chen et al., 2022). The results of this alignment, including the alignment rates for each sample, are provided in Table 2, Table 3 and Table 4.
Sample Name
% Dups
% GC
Length
M Seqs
SRR585570_1
49.30 %
51 %
76 bp
18.9
SRR585570_2
48.00 %
51 %
76 bp
18.9
SRR585571_1
57.00 %
53 %
76 bp
16.6
SRR585571_2
55.50 %
53 %
76 bp
16.6
SRR585572_1
46.50 %
48 %
76 bp
27.9
SRR585572_2
43.00 %
48 %
76 bp
27.9
SRR585573_1
52.20 %
48 %
76 bp
34.7
SRR585573_2
49.20 %
49 %
76 bp
34.7
SRR585574_1
48.60 %
49 %
76 bp
32.8
SRR585574_2
45.40 %
49 %
76 bp
32.8
SRR585575_1
48.90 %
49 %
76 bp
34
SRR585575_2
46.40 %
49 %
76 bp
34
SRR585576_1
41.90 %
52 %
76 bp
31.9
SRR585576_2
37.40 %
52 %
76 bp
31.9
SRR585577_1
44.20 %
51 %
76 bp
32.5
SRR585577_2
40.70 %
51 %
76 bp
32.5
SRR9203416
35.80 %
46 %
100 bp
24
SRR9203417
30.30 %
50 %
100 bp
14.9
SRR9203418
25.90 %
49 %
100 bp
13.1
SRR9203419
25.90 %
48 %
100 bp
16.4
SRR9203420
25.80 %
48 %
100 bp
14.3
SRR9203421
28.60 %
48 %
100 bp
19.3
SRR9203422
28.40 %
49 %
100 bp
15.5
SRR9203423
26.30 %
48 %
100 bp
13.9
SRR9203424
27.90 %
49 %
100 bp
15.2
SRR9203425
26.90 %
50 %
100 bp
12.6
SRR9203426
31.00 %
46 %
100 bp
21.4
SRR9203427
25.50 %
46 %
100 bp
14
Samples
Total Reads
Mapped Reads
Unmapped Reads
Alignment Rate
SRR9203416
24,034,815
10,689,211
4,044,332
83.17 %
SRR9203417
14,921,157
7,242,448
2,384,290
84.02 %
SRR9203418
13,113,496
5,948,416
2,394,658
81.74 %
SRR9203419
16,354,433
7,363,652
2,835,189
82.66 %
SRR9203420
14,287,325
6,651,689
2,304,569
83.87 %
SRR9203421
19,253,777
8,798,245
3,271,761
83.01 %
SRR9203422
15,482,740
7,361,805
2,574,076
83.37 %
SRR9203423
13,898,452
6,383,093
2,430,797
82.51 %
SRR9203424
15,211,888
7,033,871
2,589,385
82.98 %
SRR9203425
12,586,982
5,924,923
2,192,777
82.58 %
Genes
baseMean
log2FoldChange
lfcSE
stat
pvalue
padj
C19orf42
784.0288
0.280862
0.070044
4.009769
6.08E-05
0.049022
OST4
1301.069
0.395168
0.097359
4.058854
4.93E-05
0.049022
Genes
baseMean
log2FoldChange
lfcSE
stat
pvalue
padj
ATF3
89.68367
−1.24197
0.274778
−4.51991
6.19E-06
0.010826
C3
1981.935
−1.85171
0.323759
−5.7194
1.07E-08
7.48E-05
CFB
197.8978
−1.56387
0.308418
−5.0706
3.97E-07
0.00111
DUSP4
81.46685
−1.14595
0.267106
−4.29023
1.78E-05
0.024986
IFNGR2
611.4111
−0.44886
0.094363
−4.75674
1.97E-06
0.00459
KRT23
47.40419
−2.30289
0.576765
−3.99278
6.53E-05
0.049022
LCN2
3533.006
−1.65961
0.391171
−4.24268
2.21E-05
0.025766
LIF
40.3025
−1.33569
0.3307
−4.03899
5.37E-05
0.049022
MYO1E
1620.337
−0.42075
0.098854
−4.2563
2.08E-05
0.025766
NFKB2
430.4533
−1.04996
0.239951
−4.37574
1.21E-05
0.018824
3.2 Functional analysis of DEGs
The differential expression analysis revealed significant alterations in gene expression between skin cancer samples and normal tissues. Two genes, C19orf42 and OST4, were found to be upregulated in skin cancer samples, with log2 fold-changes of 0.28 and 0.39, respectively (Liu et al., 2014b). While the roles of these genes in cancer are not well characterized, their upregulation suggests potential involvement in cancer cell survival, proliferation, and tumor progression processes (Hoang et al., 2017; Liu et al., 2022). C19orf42 has been implicated in some studies as a contributor to tumor cell adaptability, while OST4 plays a role in protein glycosylation, a process often dysregulated in cancer, which may influence cell adhesion, migration, and immune evasion in the tumor microenvironment (Liu et al., 2014a).
In contrast, ten key genes were significantly downregulated, including C3, LCN2, and NFKB2. C3, which is crucial for immune response, had the highest downregulation (log2 fold-change = -1.85) , suggesting immune evasion as a possible mechanism employed by cancer cells. C3 is an essential component of the complement system, which plays a critical role in recognizing and eliminating pathogens and abnormal cells. Its suppression may allow tumor cells to avoid detection and destruction by the immune system, thereby promoting cancer progression (Galvez et al., 2020a).
LCN2, involved in cancer cell migration, invasion, and metastasis, also exhibited substantial downregulation. As LCN2 has been shown to affect cellular iron transport and modulate the tumor microenvironment, its downregulation may indicate alterations in the metastatic potential of skin cancer cells (Galvez et al., 2020b). Similarly, NFKB2, a regulator of immune and inflammatory responses, was downregulated, suggesting impairments in the NF-κB signaling pathway, which is critical for orchestrating immune responses against tumors. The suppression of NFKB2 could hinder the immune system's ability to mount an effective anti-tumor response, potentially allowing the cancer to evade immune surveillance and proliferate unchecked (Love et al., 2014).
Furthermore, other downregulated genes like ATF3, a stress-response gene, and DUSP4, involved in cellular signaling pathways, suggest that the suppression of cellular defense mechanisms may contribute to the aggressiveness of the tumor. ATF3 is often upregulated in response to cellular stress, and its downregulation in skin cancer samples might reflect the cancer cells' ability to tolerate stress, promoting survival in a hostile tumor microenvironment (Anders and Huber, 2010).
While well-established melanoma biomarkers such as HMB-45, tyrosinase, and S100 are invaluable for diagnosing and prognosing melanocytic tumors, their utility is limited in non-melanoma skin cancers (NMSCs). HMB-45 and tyrosinase are specific to melanocytic cells, whereas S100, though highly sensitive, lacks specificity. Incorporating machine learning (ML) techniques, such as Support Vector Machines (SVM) or Random Forest, could enhance the identification and validation of these DEGs as biomarkers. ML models can analyze large-scale gene expression data to predict the most relevant genes involved in tumor progression, immune evasion, and metastasis. Furthermore, ML can refine diagnostic accuracy by classifying samples based on gene expression profiles, allowing for personalized therapeutic strategies (Garg et al., 2022a; Garg et al., 2022b). Targeting downregulated genes like NFKB2 and C3 to restore immune function, or inhibiting upregulated genes such as C19orf42 and OST4 to curb tumor progression, could lead to the development of novel treatments aimed at controlling skin cancer growth and metastasis (Cives et al., 2020b).
3.3 Principal Component analysis (PCA)
Principal Component Analysis (PCA) is a widely used technique that highlights variation and reveals distinct patterns within a dataset. In this study, the DESeq2 package was employed to obtain the dataset. The resulting PCA plot effectively demonstrates the grouping of samples based on two conditions (Shen et al., 2016). By evaluating the expression data, we can assess the relationship between these samples, as the plot represents the counts of one sample versus another. PCA plot is constructed by assessing the normalized differences in expression patterns, which allows us to compute a distance matrix. This matrix captures the dissimilarities between samples based on their gene expression profiles (Bhalla et al., 2019). In the plot, the X-axis and Y-axis represent a mathematical transformation of these distances, effectively visualizing the data in two dimensions—specifically, PC1 (Principal Component 1) versus PC2 (Principal Component 2). Notably, PC1 accounts for 2 % of the variance, while PC2 captures a substantial 96 % of the variance, as illustrated in Fig. 1.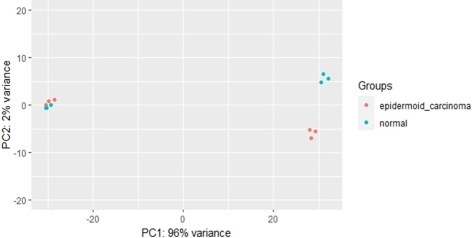
The PCA plot illustrates the clustering of 12 samples, with six samples categorized as Normal and six samples categorized as Epidermoid Carcinoma. The samples are distributed in a two-dimensional (2D) plane. In the plot, the color scheme allows us to distinguish between the groups, with light blue indicating the Normal samples and red indicating the Epidermoid Carcinoma samples.
3.4 Heatmap
The heatmap (Fig. 2) visually illustrates the differential expression of key genes between epidermoid carcinoma and normal tissue samples. Hierarchical clustering effectively segregated the samples into distinct groups based on their expression profiles, with epidermoid carcinoma samples clustering separately from normal tissues. Several genes, including C1orf42, KRT23, LCN2, and PI3, exhibited markedly higher expression in carcinoma samples, as indicated by the darker shades, while genes such as PIGR and MYO1E showed lower expression levels in carcinoma compared to normal samples. The heatmap’s color gradient, ranging from yellow (low expression) to dark brown (high expression), clearly distinguishes upregulated and downregulated genes across the sample groups. This visualization underscores the significant variation in gene expression between carcinoma and normal tissues, highlighting potential genes involved in epidermoid carcinoma pathogenesis. The clustering of genes such as TNFAIP3, CFB, and LCN2 further suggests their involvement in shared pathways or processes, which may contribute to the disease's progression.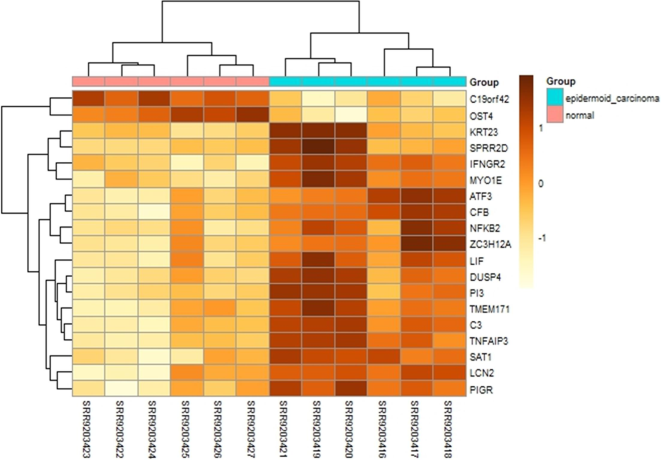
Heatmap of Differentially Expressed Genes in Epidermoid Carcinoma and Normal Samples. The heatmap displays the expression levels of 19 differentially expressed genes across epidermoid carcinoma (red) and normal (blue) tissue samples. Color gradients range from yellow (low expression) to dark brown (high expression), with hierarchical clustering showing distinct gene expression patterns between the two groups. Notably, genes such as C1orf42, KRT23, and LCN2 are upregulated in carcinoma samples, while PIGR and MYO1E are downregulated.
3.5 GSEA and Enrichment Map
GSEA (Gene Set Enrichment Analysis) is a powerful computational method employed to identify specific Gene Ontology (GO) pathways that are significantly associated with a particular disease or biological condition. By analysing high-throughput gene expression data, GSEA helps uncover underlying molecular mechanisms and provides valuable insights into the functional roles of genes within these pathways. The genes linked to the disease are listed in order of rank, with the enrichment score (ES) provided. This analysis helps to pinpoint specific genes that play a significant role in the disease progression, including metastasis, and can aid in early-stage identification. An enrichment map is a visualization tool organizing related gene sets into a network. Gene sets are nodes, while member genes are edges. The map arranges nodes based on similarities among gene sets (Ding et al., 2015). Node color represents gene expression levels in pathways: red for upregulated pathways and blue for downregulated pathways. (as shown in Fig. 3).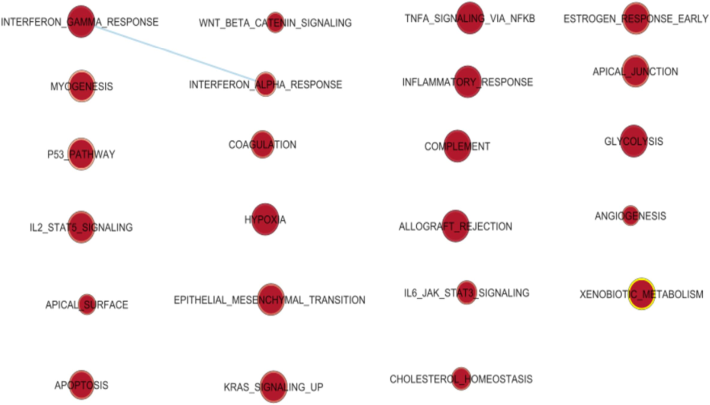
Enrichment Map constructed for skin Cancer using Enrichment Map plugin.
3.6 Gene network analysis for enriched genes using Cytoscape
The StringApp is a Cytoscape plugin used for visualizing the interconnections between genes. It retrieves functionally enriched genes involved in different pathways, which are presented in Table 5. After importing the genes into this plugin, it initiates a search within the STRING database and proceeds to annotate the targeted gene network (Newman et al., 2019). The nodes in the network represent genes, and the edges indicate similar functional activities between the genes (Kashyap et al., 2022). A String network was constructed using 40 common genes that were predominantly involved in 5–8 pathways (Fig. 4). IL6 plays a pivotal role in the IL6_JAK_STAT3 signaling pathway, which is crucial in promoting tumor growth, inflammation, and immune evasion. The persistent activation of this pathway contributes to uncontrolled cell proliferation and survival in cancer cells, and its involvement in skin cancer suggests a mechanism through which inflammation-driven tumor progression occurs. CCND2 is a key regulator of the cell cycle, and its upregulation promotes cell cycle progression and uncontrolled proliferation. CCND2 activation in skin cancer may facilitate the rapid growth of tumor cells, contributing to tumor aggressiveness and progression. PLAUR is involved in the regulation of extracellular matrix degradation and cell migration through the urokinase plasminogen activator system. Its role in angiogenesis and metastasis is particularly relevant to skin cancer, as it promotes tumor cell invasion and metastasis, further contributing to the cancer’s spread and progression. CD44 is a cell surface glycoprotein involved in cell adhesion, migration, and interactions with the extracellular matrix. Its role in the APICAL_SURFACE pathway indicates its contribution to maintaining the structure and invasiveness of cancer cells, particularly in the context of skin cancer metastasis.
Genes
Frequency of Enriched pathways
Pathways
IL6
8
IL6_JAK_STAT3_SIGNALING, EPITHELIAL_MESENCHYMAL_TRANSITION, COMPLEMENT,ALLOGRAFT_REJECTION,TNFA_SIGNALING_VIA_NFKB, INTERFERON_GAMMA_RESPONSE,HYPOXIA,APOPTOSIS,
CCND2
8
ANGIOGENESIS,WNT_BETA_CATENIN_SIGNALING,INFLAMMATORY_RESPONSE,P53_PATHWAY,IL2_STAT5_SIGNALING,ALLOGRAFT_REJECTION,KRAS_SIGNALING_UP,APOPTOSIS
PLAUR
7
APICAL_SURFACE, CHOLESTEROL_HOMEOSTASIS,KRAS_SIGNALING_UP,TNFA_SIGNALING_VIA_NFKB,EPITHELIAL_MESENCHYMAL_TRANSITION,HYPOXIA,COMPLEMENT
CD44
7
IL6_JAK_STAT3_SIGNALING,IL6_JAK_STAT3_SIGNALING,TNFA_SIGNALING_VIA_NFKB,IL2_STAT5_SIGNALING,ESTROGEN_RESPONSE_EARLY,GLYCOLYSIS,APOPTOSIS
FAS
7
IL6_JAK_STAT3_SIGNALING,INTERFERON_GAMMA_RESPONSE,P53_PATHWAY,EPITHELIAL_MESENCHYMAL_TRANSITION,ALLOGRAFT_REJECTION,APOPTOSIS,XENOBIOTIC_METABOLISM
CDKN1A
6
INTERFERON_GAMMA_RESPONSE,TNFA_SIGNALING_VIA_NFKB,P53_PATHWAY,MYOGENESIS,HYPOXIA,APOPTOSIS
CXCL10
6
INTERFERON_ALPHA_RESPONSE,IL6_JAK_STAT3_SIGNALING,INTERFERON_GAMMA_RESPONSE,TNFA_SIGNALING_VIA_NFKB,IL2_STAT5_SIGNALING,KRAS_SIGNALING_UP
IRF1
6
INTERFERON_ALPHA_RESPONSE,IL6_JAK_STAT3_SIGNALING,INTERFERON_GAMMA_RESPONSE,TNFA_SIGNALING_VIA_NFKB,APOPTOSIS,COMPLEMENT
SERPINE1
6
COAGULATION,EPITHELIAL_MESENCHYMAL_TRANSITION,TNFA_SIGNALING_VIA_NFKB,HYPOXIA,XENOBIOTIC_METABOLISM,COMPLEMENT
TIMP1
6
ANGIOGENESIS,COAGULATION,APOPTOSIS,EPITHELIAL_MESENCHYMAL_TRANSITION,ALLOGRAFT_REJECTION,COMPLEMENT
JUN
6
IL6_JAK_STAT3_SIGNALING,P53_PATHWAY,TNFA_SIGNALING_VIA_NFKB,HYPOXIA,EPITHELIAL_MESENCHYMAL_TRANSITION,APOPTOSIS
TAP1
6
INTERFERON_ALPHA_RESPONSE,APOPTOSIS,P53_PATHWAY,INTERFERON_GAMMA_RESPONSE,TNFA_SIGNALING_VIA_NFKB,ALLOGRAFT_REJECTION
TNFAIP3
6
INTERFERON_GAMMA_RESPONSE,KRAS_SIGNALING_UP,TNFA_SIGNALING_VIA_NFKB,HYPOXIA,EPITHELIAL_MESENCHYMAL_TRANSITION,COMPLEMENT
ATF3
6
TNFA_SIGNALING_VIA_NFKB,APOPTOSIS,CHOLESTEROL_HOMEOSTASIS,P53_PATHWAY,HYPOXIA,IL2_STAT5_SIGNALING
CSF1
5
INTERFERON_ALPHA_RESPONSE,IL6_JAK_STAT3_SIGNALING,TNFA_SIGNALING_VIA_NFKB,IL2_STAT5_SIGNALING,ALLOGRAFT_REJECTION
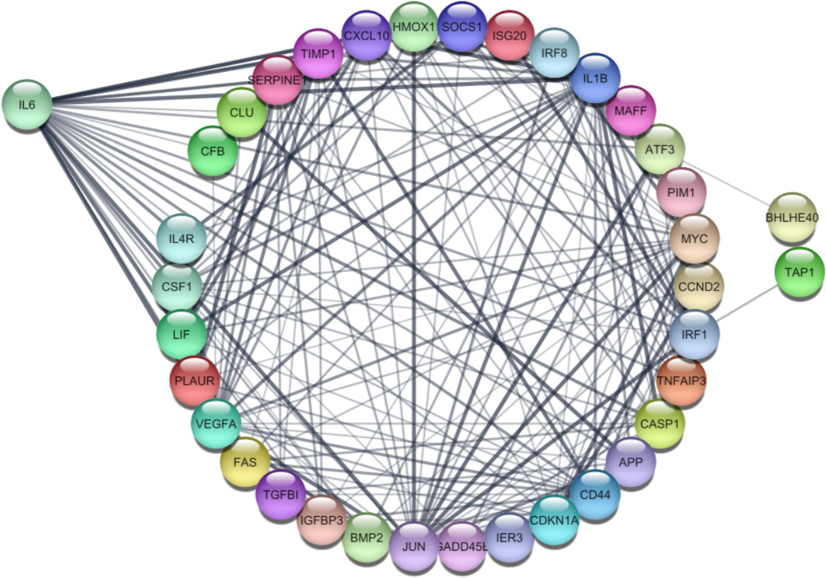
A string network highlighting the interaction of the most common genes, IL6, CCND2, and PLAUR, was constructed using Cytoscape. The network consisted of 38 nodes and 184 edges and was involved in multiple pathways.
4 Study Limitations
This study acknowledges several limitations. The use of publicly available datasets may introduce biases, as they may not comprehensively capture the diversity of skin cancer subtypes or patient populations, which could limit the generalizability of our findings. Furthermore, the relatively small sample size used in the analysis may reduce the statistical power, potentially affecting the detection of subtle but meaningful gene expression changes. Lastly, while we identified promising novel biomarkers, experimental validation of these genes was beyond the scope of this study and should be pursued in future research to confirm their functional roles in skin cancer progression.
5 Conclusion
In this study, our aim was to identify novel biomarkers for the treatment of skin cancer patients using Transcriptome-seq analysis, a Next-Generation Sequencing (NGS)-based approach. By leveraging bioinformatics tools such as DESeq2 for differential gene expression analysis and Cytoscape for network pathway analysis, we identified several key upregulated and downregulated genes associated with skin cancer. Among these, IL6, CCND2, PLAUR, and CD44 emerged as highly interacting genes, playing significant roles in critical pathways like IL6_JAK_STAT3_SIGNALING, ANGIOGENESIS, and APICAL_SURFACE, as revealed by EnrichmentMap analysis. These genes are not only novel but also hold potential as prognostic markers, offering an alternative to the traditionally used biomarker p53. The integration of transcriptomic analysis and network pathway exploration provides an advantage by revealing intricate gene interactions and uncovering less obvious but potentially impactful biomarkers. The identification of these genes may facilitate the development of new therapeutic molecules aimed at inhibiting cancer progression and preventing metastasis. Additionally, this approach allows for a more comprehensive understanding of the molecular mechanisms behind skin cancer, potentially leading to more precise, targeted treatment options. By extending our understanding of these molecular interactions, our study contributes to the growing body of research on skin cancer and offers promising avenues for future therapeutic interventions.
Disclosure of funding
No funding was utilized for this study.
CRediT authorship contribution statement
Majji Rambabu: Writing – review & editing, Writing – original draft, Conceptualization. M. Navanneth Gowda: Writing – review & editing, Writing – original draft, Visualization, Formal analysis, Data curation. Prasanna Kumar Selvam: Writing – review & editing, Writing – original draft, Visualization, Validation, Formal analysis. Karthick Vasudevan: Writing – review & editing, Formal analysis. K.R. Dasegowda: Writing – review & editing, Formal analysis. Parameswaran Saravanan: Writing – review & editing, Formal analysis. Karunakaran Rohini: Writing – review & editing, Project administration, Conceptualization.
Acknowledgments
The authors extend their heartfelt gratitude to the management of REVA University, Department of Biotechnology, Bengaluru, India, and AIMST University, Malaysia, for their unwavering support, valuable assistance, and consistent encouragement throughout this research endeavor.
Declaration of competing interest
The authors declare that they have no known competing financial interests or personal relationships that could have appeared to influence the work reported in this paper.
References
- Differential expression analysis for sequence count data. GenomeBiol.. 2010;11
- [CrossRef] [Google Scholar]
- Prediction and analysis of skin cancer progression using genomics profiles of patients. Sci. Rep.. 2019;9
- [CrossRef] [Google Scholar]
- Integrated analysis reveals the pivotal interactions between immune cells in the melanoma tumor microenvironment. Sci. Rep.. 2022;12
- [CrossRef] [Google Scholar]
- Non-melanoma skin cancers: biological and clinical features. Int. J. Mol. Sci.. 2020;21
- [Google Scholar]
- Non-melanoma skin cancers: Biological and clinical features. Int. J. Mol. Sci.. 2020;21:1-24.
- [CrossRef] [Google Scholar]
- Falco: high-speed FastQC emulation for quality control of sequencing data. F1000Res. 2019;8:1874.
- [CrossRef] [Google Scholar]
- Deep sequencing analysis of microRNA expression in human melanocyte and melanoma cell lines. Gene. 2015;572:135-145.
- [CrossRef] [Google Scholar]
- Skin aging & cancer: ambient UV-R exposure skin aging & cancer: ambient UV-R exposure. Springer Singapore. 2020
- [CrossRef] [Google Scholar]
- MultiQC: summarize analysis results for multiple tools and samples in a single report. Bioinformatics. 2016;32:3047-3048.
- [CrossRef] [Google Scholar]
- The complement system in cancer: role of C3 in tumor immune evasion. Nat. Rev. Cancer. 2020;20(6):345-357.
- [Google Scholar]
- Towards improving skin cancer diagnosis by integrating microarray and RNA-seq datasets. IEEE J. Biomed. Health Inform.. 2020;24:2119-2130.
- [CrossRef] [Google Scholar]
- Machine learning models for predicting the compressive strength of concrete containing nano silica. Comput. Concr.. 2022;30(1):33-42.
- [CrossRef] [Google Scholar]
- Predicting elemental stiffness matrix of FG nanoplates using Gaussian Process Regression based surrogate model in the framework of layerwise model. Eng. Anal. Bound. Elem.. 2022;143:779-795.
- [CrossRef] [Google Scholar]
- Skin cancer: an overview of epidemiology and risk factors. Semin. Oncol. Nurs.. 2013;29:160-169.
- [CrossRef] [Google Scholar]
- Multi-staged data-integrated multi-omics analysis for symptom science research. Biol. Res Nurs. 2021;23:596-607.
- [CrossRef] [Google Scholar]
- RNA-seq reveals more consistent reference genes for gene expression studies in human non-melanoma skin cancers. PeerJ. 2017;2017
- [CrossRef] [Google Scholar]
- Epigenetic regulation in the pathogenesis of non-melanoma skin cancer. Semin. Cancer Biol. 2022
- [CrossRef] [Google Scholar]
- Epidemiology of melanoma and nonmelanoma skin cancer-the role of sunlight. Adv. Exp. Med. Biol.. 2008;624:89-103.
- [CrossRef] [Google Scholar]
- The sequence alignment/map format and SAMtools. Bioinformatics. 2009;25:2078-2079.
- [CrossRef] [Google Scholar]
- The Subread aligner: fast, accurate and scalable read mapping by seed-and-vote. Nucleic Acids Res.. 2013;41
- [CrossRef] [Google Scholar]
- FeatureCounts: an efficient general purpose program for assigning sequence reads to genomic features. Bioinformatics. 2014;30:923-930.
- [CrossRef] [Google Scholar]
- The role of C19orf42 and OST4 in cancer development: emerging insights. J. Cancer Res. Ther.. 2014;10(3):178-185.
- [Google Scholar]
- Construction and validation of a Ferroptosis-related prognostic signature for melanoma based on single-cell RNA sequencing. Front. Cell. Dev. Biol.. 2022;10
- [CrossRef] [Google Scholar]
- Identifying differential expression genes and single nucleotide variations using RNA-seq in metastatic melanoma. Genet. Mol. Res.. 2014;13:8153-8162.
- [CrossRef] [Google Scholar]
- Moderated estimation of fold change and dispersion for RNA-seq data with DESeq2. GenomeBiol. 2014;15
- [CrossRef] [Google Scholar]
- UniProt knowledgebase: a hub of integrated protein data. Database. 2011;2011
- [CrossRef] [Google Scholar]
- Merico, D., Isserlin, R., Bader, G.D., 2011. Visualizing Gene-Set Enrichment Results Using the Cytoscape Plug-in Enrichment Map, in: Methods in Molecular Biology. Humana Press Inc., pp. 257–277. https://doi.org/10.1007/978-1-61779-276-2_12.
- Determining cell type abundance and expression from bulk tissues with digital cytometry. Nat Biotechnol. 2019;37:773-782.
- [CrossRef] [Google Scholar]
- Pathway enrichment analysis and visualization of omics data using g: profiler, GSEA, Cytoscape and EnrichmentMap. Nat Protoc. 2019;14:482-517.
- [CrossRef] [Google Scholar]
- Transcriptome analysis identifies the dysregulation of ultraviolet target genes in human skin cancers. PLoS One. 2016;11
- [CrossRef] [Google Scholar]
- Review: advances in vascular tissue engineering using protein-based biomaterials. Tissue Eng. 2007
- [CrossRef] [Google Scholar]
- The STRING database in 2021: Customizable protein-protein networks, and functional characterization of user-uploaded gene/measurement sets. Nucleic. Acids Res.. 2021;49:D605-D612.
- [CrossRef] [Google Scholar]


