

Translate this page into:
Transcriptomic and metabolomics of flavonoid compounds in Actinidia arguta var. arguta
⁎Corresponding author at: Dongling Road No. 120, Shenyang, Liaoning 110866, China. 2021500021@syau.edu.cn (Changjiang Liu)
-
Received: ,
Accepted: ,
This article was originally published by Elsevier and was migrated to Scientific Scholar after the change of Publisher.
Peer review under responsibility of King Saud University.
Abstract
Actinidia arguta (Sieb. et Zucc.) Planch ex Miq. is fruit plant with high added value, rich in bioactive compounds relevant for human health, like flavonoids and vitamin C, and has high antioxidant activity. These flavonoids also play important roles in plant immune responses and have strong medicinal implications. Moreover, it is very widely distributed in China and attracted more attention with great economic significance in recent years. However, the majority of research on flavonoids has been focused on fruit, not much has been elucidated in leaf in A. arguta. Whether are the leaves of Actinidia arguta also rich in flavonoids and other biologically active ingredients? The metabolome and transcriptome in fruits and leaves of A. arguta var. arguta cv. Changjiang No.1 (CJ-1) was analyzed in this study. We detected ten flavonoids in CJ-1 leaves that belonged to quercetin, isorhamnetin and kaempferol and using LC-MS/MS technology. Flavonoid quercetin were all detected in five tissues. Flavonoid qualification indicated that total flavonoids in young apical leaves were the highest (10219.84 µg·g−1) and 129.8 folds than in fruits (78.75 µg·g−1). From the transcriptome data, we obtained 70,631 non-redundant unigenes in total. There were 32,593 differentially expressed genes (DEGs) to be identified, including 29,617 up-regulated and 2976 down-regulated genes in fruits and young apical leaves. There were 127 metabolic pathways enriched with 3567 DEGs, in which 45 DEGs were associated with flavonoid biosynthesis. Next, the expression of qRT-PCR of key flavonoid pathway genes in leaves were higher than that in other tissues, which was consistent with the higher total flavonoid level. The data provided here were valuable for knowing the molecular mechanisms of flavonoids accumulating in different tissues. Our results were of significant contribution to the literature as they proposed possible new insights of applying leaves in A. arguta in the food and healthcare industries for their high content of flavonoids.
Keywords
Actinidia arguta var. arguta
Flavonoids biosynthesis
Gene expression
Transcriptomics

1 Introduction
Kiwifruit fruits contain relatively high vitamin C, flavonoids, carotenoids, phenolics, various minerals, and other biologically active substances beneficial to human health and the human diet (Ferguson and Huang, 2007; Richardson et al., 2018). In recent years, the cultivation of A. arguta has gradually increased in China and its research and utilization in biology and agriculture are also rapidly developing. At present, A. arguta is commercially cultivated Korea and eastern Russia as well as some cold areas, but it has been also received a lot of attention in many other regions (Almeida et al., 2018). In consequence, knowledge about its nutrients and relevant genes is of great need.
Flavonoids belonged to a class of secondary metabolites with great importance. They have different roles in plants, such as antioxidants, antibiotics, and UV protectants (Schenke et al., 2019) and ‘phytonutrients’ (Nile et al., 2017). A large number of studies have been conducted on the biosynthesis, identification and gene expression of flavonoids in different plants including Oryza sativa L. (Kim et al., 2018), apple (Hu et al., 2016), radish (M’mbone et al., 2018). Li et al. (2017) showed that AcMYB75 was regulated the promoter of ANS (Anthocyanidin Synthase) and involved in red kiwifruit anthocyanin biosynthesis. Extensive research has been conducted in recent years to evaluate the nutritional content and composition of kiwifruit fruits including the flavonoids (Yu et al., 2020; Ozen et al., 2019), anthocyanin (Wang et al., 2019), and vitamin C (Pérez-Burillo et al., 2018). Montefiori et al. (2009) first reported that delphinidin was found in two taxa of Actinidia species and also found in A. chinensis (Liu et al., 2017). Saeed et al. (2019) confirmed that rutin and catechin were in A. deleciosia fruits by HPLC analysis and estimated the total flavonoid content of red kiwifruit (RKF) was richest. However, A. arguta has high commercial value for abundant biologically active compounds. The knowledge about its gene sequence information and genome is limited, so knowing more about its genetic knowledge can improve its research depth in the field of production and health.
Up to date, many studies have focused on volatile compounds, pigment genes, pancreatic lipase inhibitor and flavonols in A. arguta fruits (Wojdyło and Nowicka, 2019), flowers (Matich et al., 2003), roots (Jang et al., 2009). Li et al. (2018) performed RNA-seqs from fruits of two A. arguta cultivars and concluded that LDOX (leucoanthocyanidin dioxygenase) might be a key gene regulating the synthesis of anthocyanins in the pulp of ‘Tianyuanhong’ (a kind of all-red fruit cultivar) kiwifruit. Untill now, the studies on A. arguta mostly focused on the fruit, nor the leaves. Therefore, the objectives of this study were focused on (i) data analysis of flavonoids in A. arguta leaves, (ii) exploring the genes related to the metabolic pathway of flavonoids in leaves and fruits of A. arguta by RNA-Seq, and (iii) analyzing the expression and regulation patterns of these genes in different tissues by qRT-PCR.
2 Materials and methods
2.1 Plant materials and sampling
The leaves and fruits of CJ-1 (female plant) was collected from the Germplasm Resource Nursery of Wild Kiwifruit in Shenyang Agricultural University. The samples included fruits (F), young apical leaves (YAL), mature leaves (ML) and petioles (P), as well as other two kinds of leaves, those of expanding to 1/4 to 1/3 (QL) and 1/2 to 2/3 (HL) of the full leaf size. Store the sample in the refrigerator at −80 °C after collection. The YAL and F were used for transcriptome sequencing, and the F was as the control (Fig. 1).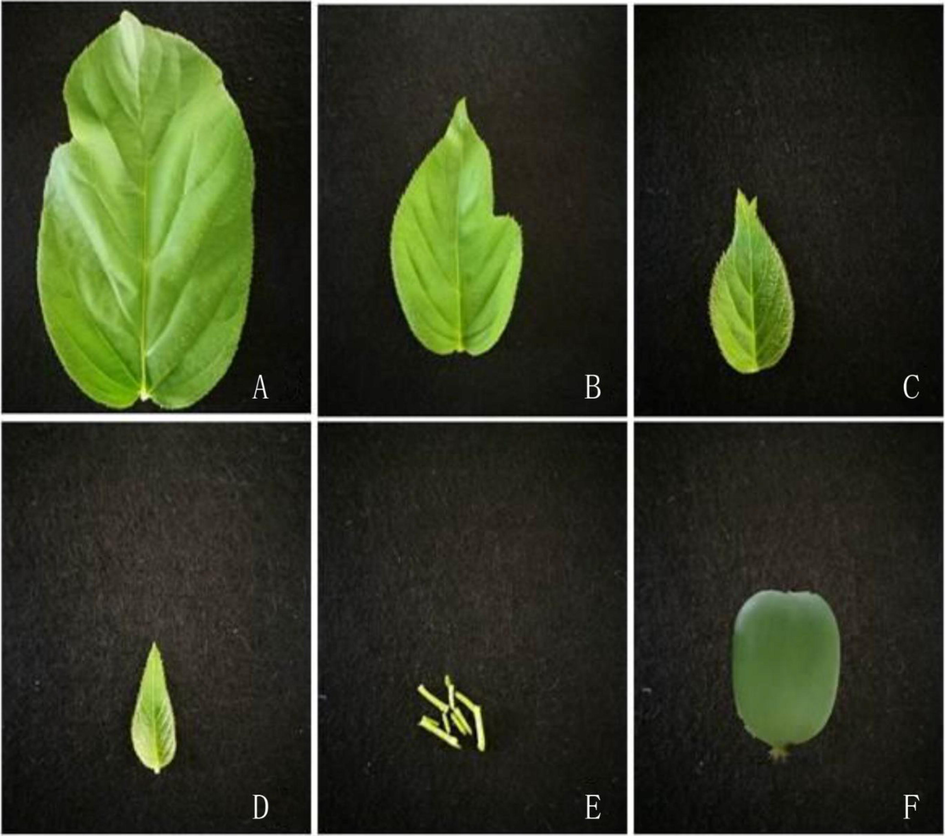
Leaves and fruit of Actinidia arguta var. arguta cv. Changjiang No. 1. (A) Mature leaves (ML); (B) Leaves expanded to 1/2 to 2/3 of the full leaf size (HL); (C) Leaves expanded to 1/4 to 1/3 of the full leaf size (QL); (D) Young apical leaves (YAL); (E) Petioles of young apical leaves (P); (F) Fruits (F).
2.2 Flavonoid determination in CJ-1
According to Gutierrez et al. (2017), the flavonoids from the leaves and fruits of A. arguta were extracted and slightly changed. In liquid nitrogen, quickly grind 1 g of fresh sample add 5 mL of 0.2% HCl (v/v) methanol solution, and then place it in a refrigerator at −20℃ for 24 h, shaking it every 12 h. The sample was centrifuged for 5 min at 3500 rpm. The supernatant was stored at −20℃ after filtering. We performed chromatographic analysis by an Agilent 6410 Triple Quad LC-MS/MS (Agilent Technologies, United States), which was equipped with electron spray ionization (ESI) and 1260 liquid chromatography system. The chromatographic separation column used in this study was Poroshell 120 (Agilent Technologies, USA) with SB-C18 column (2.7 μm and 2.1 × 100 mm). A sample solution of 10 μL was injected. We detected flavonols and flavones with 0.3 mL/min of flow rate at 350 nm. The mobile phases consisted of 2.5% (v/v) A (formic acid in water) and 2.5% (v/v) B (formic acid in acetonitrile). The column temperature was kept at 30 °C with a linear gradient as follows: 0 min, 100% A; 3 min, 90% A; 5 min, 86.5% A; 7 min, 86.5% A; 8 min, 86% A; 9 min, 85% A; 10 min, 85% A; 11 min, 84.5% A; 12 min, 83.5% A; 12.5 min, 82% A; 13 min, 70% A; 13.5 min, 69.5% A; 14 min, 68.5% A; 17 min, 60% A; 20 min, 0% A; 23 min, 95% A; 25 min, 100% A. MS conditions consisted of electrospray ionization, positive ion mode; 15 psi nebulizer pressure; 300 °C gas (N2) temperature; capillary exit, 200 V; 4000 V capillary voltage. We collected and recorded mass spectra in range of m/z 100 to 1000. The LC/MSD-Trap™ software (version 5.3) was used to analyze these results. Kaempferol, quercetin, quercetin 3-O-rutinoside, dihydrokaempferol, dihydroquercetin were purchased from NIFDC. Quercetin 3-O-rutinoside was used as quantification reference standard. The values were expressed with mean ± SE of three replicates.
2.3 RNA extraction, cDNA library preparation
Total RNA of sample extract was isolated by using an improved method called CTAB (cetyltrimethylammonium ammonium bromide). To remove genomic DNA, the total RNA from each replicate was processed by Takara RNAse-free DNAse I (Dalian, China), then by using 1.0% agarose gel electrophoresis to evaluate quality and purity with RNA 6000 Nano LabChip Kitits. The cDNA library was created by reverse-transcribing cleaved RNA fragments. A total of six libraries were constructed, in which CK-1, CK-2, and CK-3 were from fruits (F), and T1-1, T1-2 and T1-3 were from YAL.
The Illumina HiSeq™ 4000 platform was performed to generate paired-end reads and analyse transcriptome of six tissues. The sequences of the ‘CK’ and ‘T’ have been deposited in the GenBank database (Accession SRP143402).
2.4 Data assembly, annotation, and identification of differentially expressed genes
Raw sequencing data were first filtered by deleting reads with adapter or ploy-N, as well as the ones containing over 50% nucleotide identity with a Phred quality score < 5, then unique consensus contigs were assembled using Trinity software. The longest sequences were defined as unigenes. BlastX ananlysis was performed against four protein databases, including Swissprot, KEGG (Kyoto encyclopedia of genes and genomes),Nr (NCBI non-redundant protein), and KOG (euKaryotic Ortholog Groups), by E-value < 10–5 to annotate A. arguta transcriptome. Based on best alignment results, functional annotations of proteins were determined. We evaluated the gene expression by FPKM method, that was fragments per kilobase of transcript per million mapped reads and performed genes analysis using KEGG and enrichment analysis of GO (gene ontology) after selecting genes of fold change >2 and FDR < 0.05 as significant ones.
2.5 Gene expression analysis
Eleven genes identified by transcriptome data were selected randomly to evaluate the expression level by qRT-PCR. The cDNA of each sample was compounded by TaKaRa PrimeScript RT Reagent Kit. Primers were listed in (Table S1) and devised by Primer 3.0 software. qRT-PCR reactions were conducted by a Bio-Rad Real-Time Detection System (IQ5, USA) and Takara SYBR Green PCR Master Mix. The mixtures (10 μL final volume ) consisted of 5 μL of 2 × SYBR Green Master Mix, cDNA template (1 μL), 0.5 μL of each primer (10 μmol/μL) and 2.5 μL ddH2O. The expression level in the different tissues was computed by using 2- ΔΔCt method (Δ Ct = Ctsample − CtActin). All the data were presented as mean ± SE.
2.6 Statistical analysis
Data was analyzed with SPSS 19.0 statistically and the results represented significantly at P<0.05 with the mean ± standard error.
3 Results
3.1 Analysis of 10 components of flavonoid glycosides in A. arguta
According to LC-UV-MS analysis and reference with published data, we could determine flavonoids in A. arguta by elution order, retention time, MS fragmentation pattern, and the UV–vis spectrum (Xue et al., 2016). The HPLC chromatogram of flavonoid compounds was detected at 350 nm (Fig. S1) and ten peaks in the flavonoid extract of A. arguta were detected in total. As shown in Table 1, there were some [M + H]+ ions observed in mass spectrum which were strong, such as m/z 595, m/z 579, m/z 653, m/z 625, m/z 757, etc., also including stronger Y0+ ions and [Y0 + H]− ions, like m/z 301, m/z 315, m/z 285, m/z 316, m/z 300, m/z 314 plasma and m/z 255, m/z 243, m/z 271, m/z 227 and some other fragment ions. Flavonol glycoside compounds were preliminarily determined to be isorhamnetin, kaempferol and quercetin. On the basis of molecular ion, main MS2 fragments, the UV-vis spectrum and retention time, ten compounds were tentatively established as kaempferol-3-O-rutinoside (cis), kaempferol-3-O-rutinoside (trans), kaempferol-3-O- neohesperidoside (P), isorhamnetin-3-O-α-l-rhamnosyl-(1 → 3)-α-l-rhamnosyl-(1 → 6)-β-d-galactoside, Isorhamnetin-3-O-neohesperidoside (P) (cis), Isorhamnetin-3-O-neohesperidoside (P) (trans), Isorhamnetin-3-O-rutinoside, Isorhamnetin-3-O-neohespeidoside and quercetin-3-O-rhamnoglycoside, respectively. (Fig. S2).
Constituent
Molecular ion/[M+H]+
λmax in the visible region (nm)
Retention time/min
Fragment ions/(m/z)
M.W. (Da)
Kaempferol-3-O-Rutinoside (+)
595
266,350
12.188
287
594
Kaempferol-3-O-Rutinoside (-)
595
266,350
13.276
287
594
Kaempferol-3-O- Neohesperidoside (P)
595
267,354
13.693
287
594
Isorhamnetin-3-O-α-L-rhamnopyranosyl-(1→3)-α-L-rhamnopyranosyl-(1→6)-β-D-galactopyranoside
757
256,356
10.772
317
756
Isorhamnetin-3-O-α-L-rhamnopyranosyl-(1→3)-α-L-rhamnopyranosyl-(1→6)-β-D-galactopyranoside
757
257,358
11.339
317
756
Isorhamnetin-3-O-neohesperidoside(P)(+)
625
266,350
14.363
317
624
Isorhamnetin-3-O-neohesperidoside(P)(-)
625
254,358
14.602
317
624
Isorhamnetin-3-O-rutinoside
625
263,356
14.915
317
624
Isorhamnetin-3-O-neohespeidoside
653
259,357
14.609
317
652
Quercetin -3-O- rhamnoglycoside
579
260,359
21.799
301
578
3.2 Quantification of bioactive compounds in CJ-1
The content of flavonoids was analyzed quantitatively in different tissues of CJ-1 (Table 2). We detected ten flavonoid compounds. Quercetin-3-O-rhamnoside had the highest content. Quercetin, kaempferol and isorhamnetin were all detected in fruits, leaves and petioles. The highest concentration of flavonoid was found in leaves, far higher than those of in F and P and F, only 78.75 µg·g−1 and 151.63 µg·g−1, respectively. The highest total flavonoid content in YAL was found, which was 10219.84 µg·g−1, which was 67.4-fold and 129.8-fold as compared to P and F (Fig. 2). Quercetin compounds were all detected in different tissues of CJ-1 (Table 2). However, their concentrations of three flavonoids were different in different tissues. Note: YAL, Young apical leaves; QL, Leaves expanded to 1/4 to 1/3 of the full leaf size; HL, Leaves expanded to 1/2 to 2/3 of the full leaf size; ML, Mature leaves; P, Petioles of young apical leaves; F, Fruits; — means failure to be detected.
Flavonoids
YAL (µg·g−1)
QL (µg·g−1)
HL (µg·g−1)
ML (µg·g−1)
P (µg·g−1)
F (µg·g−1)
Kaempferol-3-O-Rutinoside (+)
121.19 ± 8.53 f
—
397.11 ± 24.59 c
7.36 ± 0.52 d
—
—
Kaempferol-3-O-Rutinoside (−)
775.95 ± 45.80 c
456.45 ± 28.86 cd
—
14.33 ± 1.07 cd
0.56 ± 0.03 e
—
Kaempferol-3-O-Neohesperidoside (P)
1999.91 ± 125.80 b
1326.07 ± 82.84 b
990.58 ± 59.92 a
24.05 ± 2.19 c
10.68 ± 0.62 cd
3.23 ± 0.19 c
Isorhamnetin-3-O-α-l-rhamnopyranosyl-(1 → 3)-α-l-rhamnopyranosyl-(1 → 6)-β-d-galactopyranoside
572.36 ± 34.78 cd
499.85 ± 29.61c
1101.83 ± 70.97 a
56.44 ± 4.58b
13.53 ± 0.81c
5.65 ± 0.33c
Isorhamnetin-3-O-α-l-rhamnopyranosyl-(1 → 3)-α-l-rhamnopyranosyl-(1 → 6)-β-d-galactopyranoside
401.43 ± 24.92 def
323.55 ± 20.53 de
697.98 ± 43.18 b
57.35 ± 4.03 b
1.32 ± 0.01 e
0.95 ± 0.05 c
Isorhamnetin-3-O-neohesperidoside (P)(+)
212.87 ± 13.58 ef
—
28.36 ± 1.89 d
8.59 ± 0.59 d
—
—
Isorhamnetin-3-O-neohesperidoside (P)(−)
2103.58 ± 133.21b
592.69 ± 36.25c
115.43 ± 9.24 d
53.39 ± 3.59b
30.46 ± 1.75b
12.36 ± 0.74b
Isorhamnetin-3-O-rutinoside
446.09 ± 31.49 de
210.33 ± 13.04 ef
62.35 ± 4.23 d
11.27 ± 0.93 d
5.69 ± 0.32 de
—
Isorhamnetin-3-O-neohespeidoside
252.63 ± 16.26 ef
89.95 ± 5.65f
—
7.05 ± 0.45 d
—
—
Quercetin −3-O- rhamnoglycoside
3333.83 ± 221.73 a
1478.94 ± 86.92a
593.31 ± 44.91b
110.72 ± 7.69 a
89.38 ± 5.16 a
56.55 ± 3.32 a
TF contents (µg·g−1)
10219.84 ± 1136.36
4977.83 ± 526.03
3986.94 ± 448.49
350.55 ± 44.39
151.63 ± 15.07
78.75 ± 8.04
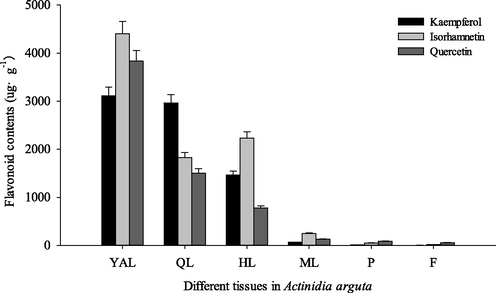
Content of main flavonoids in different tissues of Changjiang No. 1. YAL, Young apical leaves; QL, Leaves expanded to 1/4 to 1/3 of the full leaf size; HL, Leaves expanded to 1/2 to 2/3 of the full leaf size; ML, Mature leaves; P, Petioles of young apical leaves; F, Fruits.
3.3 Transcriptome sequencing and assembly
Illumina HiSeqTM 4000 was used to carry out high throughput sequencing of six libraries. Transcriptome sequencing and assembly results were summarized in Table S3. We obtained average 7.5 Gb clean bases in total. The Q30 and GC ratio of each sample on average was 92.73% and 47.11%, respectively (Table S3). The distributions of unigenes length in CJ-1 were shown in Table S5. By sequencing and mapping alignment, it was identified overall 70,631 genes, whose average length was 798 bp (Table S4).
3.4 Functional annotation and identification of differentially expressed genes
The assembled unigenes were blasted against databases of SwissProt, Nr, KOG, and KEGG (E-value ≤ 0.00001) (Table 3). Results showed that the number annotated in all databases was 11,011 (15.59%) among 70,631 unigenes, and 36,638 (51.87%) unigenes were matched in at least one database. We identified 32,593 DEGs in total, in which 29,617 upregulated and 2976 down-regulated genes in F vs YAL (Fig. 3). Then, we used GO function enrichment and the KEGG pathway to analyze DEGs. There were 12,639 DEGs to obtain from 45 significantly enriched GO terms belonging to three classifications, such as biological process (BP), molecular function (MF) and cellular component (CC) (Fig. S3).
Annotation database
Number of Unigenes
Percentage (%)
Annotated in NR
36 431
51.58
Annotated in SwissProt
26 069
36.91
Annotated in KOG
21 866
30.96
Annotated in KEGG
14 385
20.37
Annotated in all Databases
11 011
15.59
Annotated in at least one Database
36 638
51.87
Total Unigenes
70 631
100.00
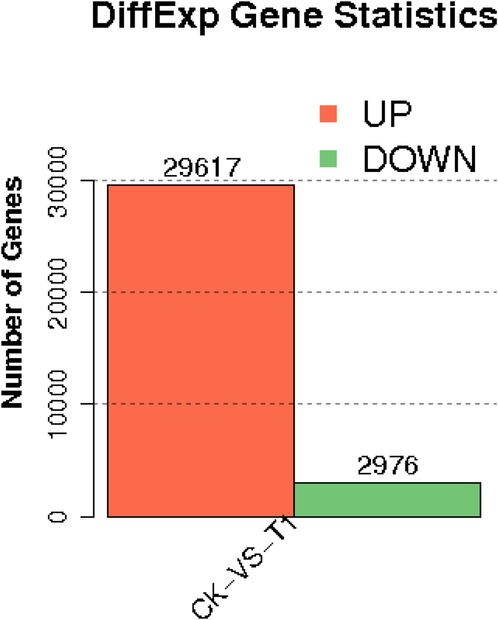
Differential gene expression statistics.
To better understand the functional roles of DEGs in different tissues, we used the KEGG database to analyze their metabolic pathways. There were 127 metabolic pathways obtained with 3567 DEGs. The top 20 enriched pathways were listed in Fig. 4. The most significantly enriched pathway was 'plant-pathogen interaction' shown in Table S5 (Padj ≤ 0.05). Secondly, ‘Plant hormone signal transduction’ pathway was also significantly enriched with 239 DEGs, so we thought that during the leaf and fruit development, hormones may exert key regulation roles. Furthermore, 36 DEGs were enriched in 'Flavonoid biosynthesis' pathway, indicating that the synthesis of flavonoids was different in leaf and fruit, which is also the point of this study.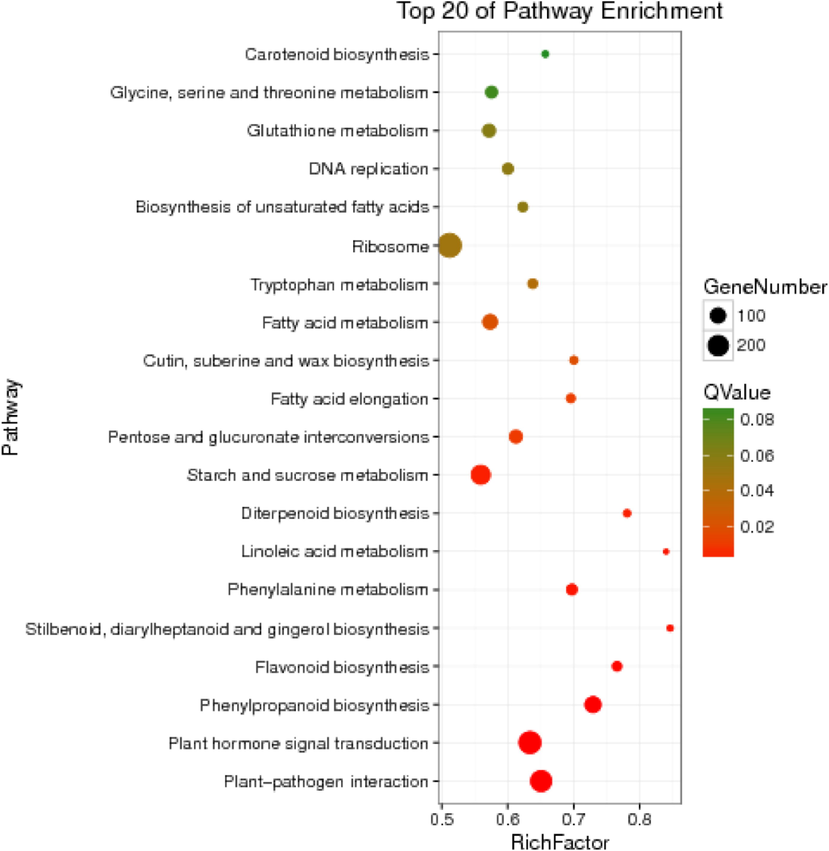
The top 20 of most significant enrichment in KEGG pathways.
3.5 Exploring genes related to flavonoids biosynthesis
To obtain as much genetic information as possible about the flavonoid formation in A. arguta var. arguta, the core genes for all the secondary metabolic pathways including the biosynthesis of flavonoid, anthocyanin, flavone, and flavonol, were extracted from the transcriptional database. Based on the KEGG database, a comprehensive search was carried out in the annotated results of CJ-1. Then according to the corresponding KO ID of the annotated results (Table 4), the corresponding gene was found according to the reference path provided in the KEGG database. There were 45 DEGs identified in total, which were connected with the biosynthesis of flavonoid, flavone and flavonol, and anthocyanin. All these DEGs indicated differential expressions in leaves and fruits, and most of them were up-regulated in leaves. Note: Alla indicates the total number of unigenes analysed, Upb indicates the number of unigenes with expression significantly up-regulated in leaves than that in fruits, Downc indicates the number of unigenes with expression significantly down-regulated in leaves than that in fruits.
Function
Gene
Enzyme
KO id (EC-No.)
Alla
Upb
Downc
Flavonoid biosynthesis
C4H
trans-cinnamate 4-monooxygenase
K00487 (1.14.13.11)
1
1
0
HCT
shikimate O-hydroxycinnamoyltransferase
K13065 (2.3.1.133)
7
6
1
C3′H
coumaroylquinate(coumaroylshikimate) 3′-monooxygenase
K09754 (1.14.13.36)
4
4
0
CCoAOMT
caffeoyl-CoA O-methyltransferase
K00588 (2.1.1.104)
3
3
0
CHS
chalcone synthase
K00660 (2.3.1.74)
3
3
0
CHI
chalcone isomerase
K01859 (5.5.1.6)
1
1
0
F3H
naringenin 3-dioxygenase
K00475 (1.14.11.9)
3
3
0
F3′H
flavonoid 3′-monooxygenase
K05280 (1.14.13.21)
1
1
0
F3′5′H
flavonoid 3′,5′-hydroxylase
K13083 (1.14.13.88)
3
3
0
FLS
flavonol synthase
K05278 (1.14.11.23)
2
2
0
DFR
bifunctional dihydroflavonol 4-reductase/flavanone 4-reductase
K13082 (1.1.1.219/1.1.1.234)
3
3
0
ANS
anthocyanidin synthase
K05277 (1.14.11.19)
1
1
0
LAR
leucoanthocyanidin reductase
K13081 (1.17.1.3)
3
3
0
ANR
anthocyanidin reductase
K08695 (1.3.1.77)
1
1
0
Anthocyanin biosynthesis
UFGT75C1
anthocyanidin 3-O-glucoside 5-O-glucosyltransferase
K12338 (2.4.1.298)
3
1
2
UGAT
cyanidin-3-O-glucoside 2″-O-glucuronosyltransferase
K12937 (2.4.1.254)
4
4
0
Flavone and flavonol biosynthesis
kaempferol 3-O-beta-d-galactosyltransferase
kaempferol 3-O-beta-d-galactosyltransferase
K13269 (2.4.1.234)
1
1
0
AOMT
flavonoid O-methyltransferase
K13272 (2.1.1.267)
1
1
0
Ten DEGs were annotated that encoded four enzymes in the upstream biosynthesis of flavonoid, which were all up-regulated in leaves than in fruits, including chalcone synthase (CHS, 3 DEGs), flavonoid 3′-hydroxylase (F3'H, 1 DEG), flavonoid 3′, 5′-hydroxylase (F3'5'H, 3 DEGs) and flavanone 3-hydroxylase (F3H, 3 DEGs). While in the downstream step, five DEGs were encoding two enzymes, all expressed in leaves predominantly, which were dihydroflavonol 4-reductase (DFR, 3 DEGs) and flavonol synthase (FLS, 2 DEGs). We thought that these two enzymes played a central role in flavonoid formation in leaves. In addition, we also annotated four DEGs, encoding anthocyanidin synthase (ANS, 1 DEG), leucoanthocyanidin reductase (LAR, 3 DEGs) and anthocyanidin reductase (ANR, 1 DEG), respectively. To further learn the roles of genes associated with flavonoids formation in leaves and fruits, a heatmap was plotted (Fig. 5). DEGs all showed different expression in different tissues. By analyzing the pathway significant enrichment of differentially expressed genes, almost all the enzymes were annotated in the flavonoid biosynthesis pathway, indicating that the sequencing of the transcriptome of F and YAL in CJ-1 contained large amounts of information.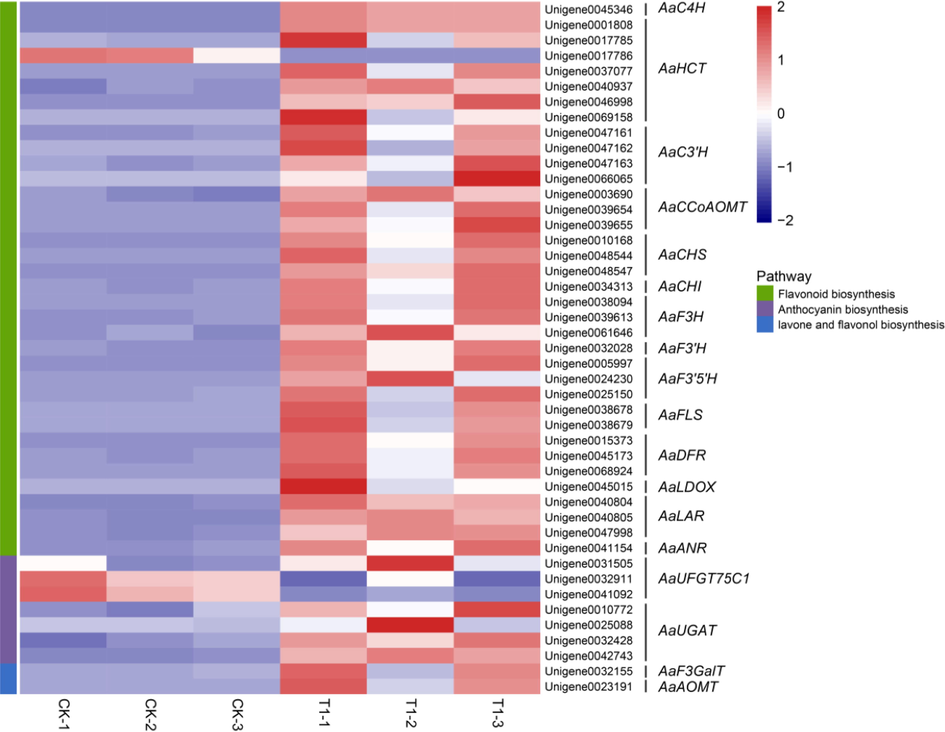
The heatmap was conducted according to the Z-score normalized data of expression profile of flavonoids formation related genes.
3.6 Expression of gene-related with the flavonoid biosynthesis
To confirm the unigenes obtained from transcriptome data, eleven key genes were examined in flavonoid biosynthesis with qRT-PCR. It confirmed that the expression patterns of eleven genes in fruit and leaves were similar to the transcriptome. The expression profiles of these genes were shown in Fig. 6. On the whole, key genes expression in leaves was higher than in other tissues in flavonoid biosynthesis, like AaF3'5'H-1 and AaF3H-1. These genes were partitioned to two types in the light of the expression pattern, those of one type lowered gradually with the developing of leaf, such as AaF3H-1, AaFLS-1, AaF3'5'H-1, AaANS, AaLAR-1, etc. While the other type only included two genes of AaDFR and AaCHS, which expressed higher in F than in ML and P, lower than in other tissues.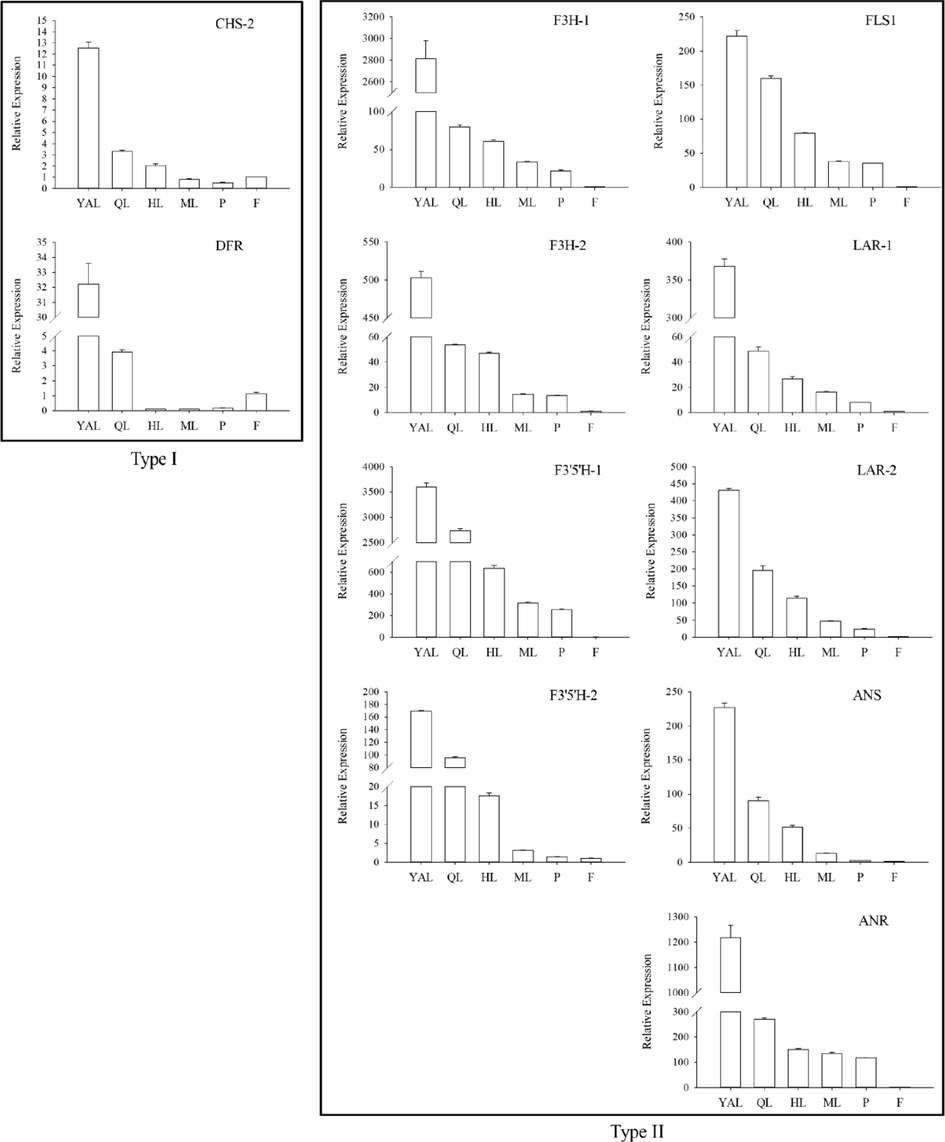
Gene expression associated with flavonoid synthesis by qRT-PCR in different tissues.
4 Discussion
One of the most important secondary metabolism pathways is the flavonoid biosynthetic pathway. For many years, many researchers have been studying deeply on the biosynthesis and regulation of flavonoids, and it has been reported in strawberry (Markus et al., 2008), onion (Park et al., 2017), and Ginkgo biloba (Wu et al., 2018). In a citrus study, transcript levels for CHS, CHI, and F3H, as well as flavonoid contents, were all high in young tissues, decreasing with the ripening, which indicated that flavonoid synthesis began from the early development (Moriguchi et al., 2002). Moreover, in this study, the presented above core gene expression data were consistent with the data of transcriptome sequencing and flavonoid quantification. More expression in young leaves, and concentration of flavonoids in young apical leaves was more than 100 times that of fruits. It was consistent with the working hypothesis of Gutierrez et al. (2017) that flavonols accumulated only in leaves and there was a strong flavonols synthesis in leaves. Similarly, the expression of AaFLS, AaF3’5’H and AaF3H also highly in YAL in this study, which were the core genes synthesizing isorhamnetin, quercetin and kaempferol. We inferred that higher content of quercetin in YAL was caused of the highest expression of AaFLS and AaF3'5'H gene in YAL, then acting together on dihydrokaempferol to synthesize more quercetin. As we know, isorhamnetin was synthesized by benzylation and methylation of quercetin. Therefore, it was believed that the key regulatory genes of the isorhamnetin metabolic pathway were AaFLS and AaF3'5'H, which also caused the highest isorhamnetin content in YAL.
In some crop studies, it had been confirmed that F3'5'H and F3'H genes were involved in regulating the content and synthesis of flavonoids, such as kiwifruit (Peng et al., 2019), melon, etc. It had also been verified that DFR gene could directly catalyze producting naringenin from pelargonidin (Jin et al., 2016). In Solanum lycopersicum research, Payyavula et al. (2013) reported that the expression of most phenylpropane genes decreased with the development of tubers. This study found that AaANR gene also expressed highest in YAL, which may be related to the AaDFR gene and AaF3H gene expressing highly in upstream. In addition, the high expression of the three genes AaDFR, AaANS and AaLAR also resulted in the highest total flavonoid content in YAL.
It was reported that flavonoids from the plant could restrain free radical reactions propagating to protect from diseases, they could also control the growth of the plant and single organ (Meng et al., 2019). Simultaneously, the development of natural antioxidants of plant origin has been devoted more considerable regard (Khoobi et al., 2011). A. arguta var. arguta is a precious wild resource native to China. For many years, it has been commercially cultivated rapidly in China. So far, some studies on the extraction, purification, and identification of flavonoids from A. arguta have been reported (Latocha and Jankowski, 2011; Wojdyło et al., 2017). It was indicated in this study that the flavonoids in A. arguta young leaves belonged to isorhamnetin, quercetin and kaempferol, furthermore, the content of total flavonoids was higher as compared to mature leaves. Guo et al. (2020) informed that more active flavonoid metabolism was in young Ginkgo biloba leaf. Maybe the young A. arguta leaves will be apllied in the fields of food processing and healthcare like G. biloba (Jain et al., 2011) and Lycium barbarum (Zhou et al., 2017).
5 Conclusion
In conclusion, we explored flavonoid accumulation mechanism in the A. arguta fruits and leaves at the metabolome and transcriptome levels. With the use of LC-MS/MS, ten flavonoids were identified in fruits and leaves, including quercetin, kaempferol and isorhamnetin, and the total flavonoid were higher in leaves than in fruits significantly. We identified 45 candidate genes involving in the biosynthesis of flavonoid, flavone and flavonol, anthocyanin. Moreover, eleven key DEGs related to flavonoid biosynthesis expressed higher in young apical leaves, consistent with the data of transcriptome sequencing and flavonoid quantification. A. arguta is a bioactive functional plant species and its leaves with high contents of flavonoids, which could be a promising source of leaf tea or herbal medicine. Our results contributed to further study of the complex physiological process and mechanism of flavonoid accumulation in different tissues.
Acknowledgments
The authors thank the Project of Shenyang High-end Academic Exchange Activities (2018-8) for funding this research.
Declaration of Competing Interest
All authors state that they have no competing commercial interests or individual connections that could have affect the work informed in this study.
References
- Hardy kiwifruit leaves (Actinidia arguta): an extraordinary source of value-added compounds for food industry. Food Chem.. 2018;259:113-121.
- [Google Scholar]
- Genetic resources of kiwifruit: domestication and breeding. Hortic. Rev.. 2007;33:1-121.
- [Google Scholar]
- Temporospatial flavonoids metabolism variation in Ginkgo biloba leaves. Front. Genet.. 2020;11
- [CrossRef] [Google Scholar]
- Transcriptomics, targeted metabolomics and gene expression of blackberry leaves and fruits indicate flavonoid metabolic flux from leaf to red fruit. Front. Plant Sci.. 2017;8:472.
- [Google Scholar]
- MdMYB1 regulates anthocyanin and malate accumulation by directly facilitating their transport into vacuoles in apples. Plant Physiol.. 2016;170(3):1315-1330.
- [Google Scholar]
- Synergistic antioxidant activity of green tea with some herbs. J. Adv. Pharm. Technol. Res.. 2011;2(3):177-183.
- [Google Scholar]
- Flavan-3-ols having a g-Lactam from the roots of Actinidia arguta inhibit the formation of advanced glycation end products in Vitro. Chem. Pharm. Bull.. 2009;57(4):397-400.
- [Google Scholar]
- Transcriptomics and metabolite analysis reveals the molecular mechanism of anthocyanin biosynthesis branch pathway in different Senecio cruentus cultivars. Front. Plant Sci.. 2016;7(107):1307.
- [Google Scholar]
- Synthesis and free radical scavenging activity of coumarin derivatives containing a 2-methylbenzothiazoline motif. Arch. Pharm.. 2011;344(9):588-594.
- [Google Scholar]
- Identification and quantification of flavonoids in yellow grain mutant of rice (Oryza sativa l.) Food Chem.. 2018;241:154-162.
- [Google Scholar]
- Genotypic difference in postharvest characteristics of hardy kiwifruit (Actinidia arguta and its hybrids), as anew commercial crop part II. Consumer acceptability and its maindrivers. Food Res. Int.. 2011;44(7):1946-1955.
- [Google Scholar]
- Kiwifruit R2R3-MYB transcription factors and contribution of the novel AcMYB75 to red kiwifruit anthocyanin biosynthesis. Sci. Rep.-UK. 2017;7(1):16861.
- [Google Scholar]
- A key structural gene, AaLDOX, is involved in anthocyanin biosynthesis in all red-fleshed kiwifruit (Actinidia arguta) based on transcriptome analysis. Gene. 2018;648:31-41.
- [Google Scholar]
- Expression differences of pigment structural genes and transcription factors explain flesh coloration in three contrasting kiwifruit cultivars. Front. Plant Sci.. 2017;8
- [CrossRef] [Google Scholar]
- Redirection of flavonoid biosynthesis through the down-regulation of an anthocyanidin glucosyltransferase in ripening strawberry fruit. Plant Physiology. 2008;146(4):1528-1539.
- [Google Scholar]
- Actinidia arguta: volatile compounds in fruit and flowers. Phytochemistry. 2003;63(3):285-301.
- [Google Scholar]
- Metabolomics integrated with transcriptomics reveals redirection of the phenylpropanoids Metabolic flux in Ginkgo biloba. J. Agric. Food Chem.. 2019;67(11):3284-3291.
- [Google Scholar]
- Identification and transcript analysis of MATE genes involved in anthocyanin transport in radish (Raphanus sativus L.) Sci. Hortic.. 2018;238:195-203.
- [Google Scholar]
- Characterization and quantification of anthocyanins in red kiwifruit (Actinidia spp.) J. Agric. Food Chem.. 2009;57(15):6856-6861.
- [Google Scholar]
- Flavonol synthase gene expression during citrus fruit development. Physiol. Plantarum.. 2002;114(2):251-258.
- [Google Scholar]
- Antioxidant, anti-inflammatory, and enzyme inhibitory activity of natural plant flavonoids and their synthesized derivatives. J. Biochem. Mol. Toxic.. 2017;32(1):e22002.
- [CrossRef] [Google Scholar]
- A comparison investigation on antioxidant activities, physicochemical properties and phytochemical contents of kiwifruit genotypes and cultivars. Int. J. Fruit Sci.. 2019;19(2):115-135.
- [Google Scholar]
- Comparative analysis of two flavonol synthases from different-colored onions provides insight into flavonoid biosynthesis. J. Agric. Food Chem.. 2017;65(26):5287-5298.
- [Google Scholar]
- Developmental effects on phenolic, flavonol, anthocyanin, and carotenoid metabolites and gene expression in potatoes. J. Agric. Food Chem.. 2013;61(30):7357-7365.
- [Google Scholar]
- Differential regulation of the anthocyanin profile in purple kiwifruit (Actinidia species) Hortic. Res.. 2019;6(1):3.
- [Google Scholar]
- Relationship between composition and bioactivity of persimmon and kiwifruit. Food Res. Int.. 2018;105:461-472.
- [Google Scholar]
- The nutritional and health attributes of kiwifruit: a review. Eur. J. Nutr.. 2018;57(8):2659-2676.
- [Google Scholar]
- Suppression of UV-B stress induced flavonoids by biotic stress: Is there reciprocal crosstalk? Plant Physiol. Biochem.. 2019;134:53-63.
- [Google Scholar]
- Comparative assessment of phytochemical profiles and antioxidant and antiproliferative activities of kiwifruit (Actinidia deliciosa) cultivars. J. Food Biochem.. 2019;43(11)
- [CrossRef] [Google Scholar]
- A MYB/bHLH complex regulates tissue-specific anthocyanin biosynthesis in the inner pericarp of red-centered kiwifruit Actinidia chinensis cv. Hongyang. Plant J.. 2019;99:359-378.
- [Google Scholar]
- Anticholinergic effects of Actinidia arguta fruits and their polyphenol content determined by liquid chromatography-photodiode array detector-quadrupole/time off light-mass spectrometry (LC-MS-PDA-Q/TOF) Food Chem.. 2019;271:216-223.
- [Google Scholar]
- Phytochemical compounds and biological effects of Actinidia fruits. J. Funct. Foods. 2017;30:194-202.
- [Google Scholar]
- De novo transcriptome analysis revealed genes involved in flavonoid biosynthesis, transport and regulation in Ginkgo biloba. Ind. Crops Prod.. 2018;124:226-235.
- [Google Scholar]
- Flower pigment heritance and anthocyanin characterization of hybrids from pink-flowered and white-flowered strawberry. Sci. Hortic.-Amsterdam. 2016;200:143-150.
- [Google Scholar]
- Metabolomics study of flavonoids and anthocyanin-related gene analysis in kiwifruit (Actinidia chinensis) and kiwiberry (Actinidia arguta) Plant Mol. Biol. Rep.. 2020;38(3):353-369.
- [Google Scholar]
- Analysis of chemical compositions and antioxidant activities of Lycium barbarum bud and leaf teas. Sci. Technol. Food Ind.. 2017;38(10):129-145. (in Chinese)
- [Google Scholar]
Appendix A
Supplementary data
Supplementary data to this article can be found online at https://doi.org/10.1016/j.jksus.2021.101605.
Appendix A
Supplementary data
The following are the Supplementary data to this article:


