

Transcriptome analysis revealed transporter proteins role in the growth of Labrenzia sp. PO1 and SY1
⁎Corresponding author. szu_sfli@163.com (Shuangfei Li)
-
Received: ,
Accepted: ,
This article was originally published by Elsevier and was migrated to Scientific Scholar after the change of Publisher.
Abstract
Akashiwo sanguinea is closely linked to the healthy growth of Labrenzia sp. PO1. Herein, PO1 and SY1 strains of Labrenzia sp. were isolated from A. sanguinea to investigate their growth. A total of 6067 genes in the Labrenzia sp SY1 and 6067 genes in Labrenzia sp PO1 were identified by RNA sequencing. Totally, 2402 genes out of 6067 were found as differentially expressed genes (DEGs). PO1 strain, 595 with decreased transcript abundance, and 1807 increase transcript abundance. Total 2320 DEGs, 766 with decreased transcript abundance, and 1554 increase transcript abundance were found in the SY1 strain. Transcriptome analysis divulged that DEGs were enriched with regulating metabolic processes, biological processes, and binding activities and may play critical roles in Labrenzia sp. PO1 growth. The ABC transporter pathway was also enriched in PO1 with 23 genes encoding ABC transporters with increased transcript abundance only in this strain. ABC transporter transcript levels and Labrenzia sp. PO1 growth was highest at 32 h, indicating that transporter-encoding genes may be involved in PO1 growth through nutrient transport. Moreover, their low expression in SY1 may be related to its slower growth. This study of Labrenzia sp. PO1 and SY1 transcriptomes may be used as a foundation for future research on the biofilm formation phenomenon of Labrenzia sp. PO1, as the formation was observed only in PO1.
Keywords
Akashiwo sanguinea
Comparative Transcriptomic
Differentially Expressed Genes (DEGs)
Labrenzia sp. Transporters

1 Introduction
Bacteria and phytoplankton are the numerically dominant lifeform in the oceans (McManus and Woodson, 2012). In both marine and freshwater environments, bacterial and algal interactions are very common, while bacteria are regarded as key players in regulating the growth and fluctuations of phytoplankton blooms (Amin et al., 2012). Some marine bacteria can repress or stimulate the growth and lysis of phytoplankton and alter its physiology (Amin et al., 2015). Studies available on microalgae-bacterial interactions depict the role of nutrients. Generally, microbial cells interplay with substratum surface within particular nutritional circumstances at the seawater interface, and the surface probably serves as the starter for the beginning and advancement of marine surface colonization. A species’s capacity to obtain required nutrients from its surroundings determines bacterial colonization (Naik et al., 2018).
Bacteria have developed various mechanisms to get the nutrients necessary for homeostasis (Chaturvedi and Henderson, 2014). Bacteria respond to multiple stresses, including nutrient deprivation, antibacterial defense, and others (Fang et al., 2016). Knowing how bacteria recognize and respond to environmental changes will enhance our awareness of factors responsible for bacterial interactions (Gestal et al., 2019; Hakansson et al., 2018). Bacterial transporter proteins are needed for nutrient uptake and serve as important players during host-bacterial interactions (Bleves et al., 2020; Eisenreich et al., 2019). A subset of ATP-binding cassette (ABC) carriers have been described as playing an essential role in the survival and proliferation of bacteria (Dube et al., 2018). ABC transporters are a large family of transmembrane proteins present in all organisms (Jeong et al., 2014).
Akashiwo sanguinea, a widespread member of marine dinoflagellates, globally results in many environmental complications. Genus Labrenzia is a member of the Rhodobacteraceae family and class Alphaproteobacteria at the same time (Amiri Moghaddam et al., 2018) contains over100 genera and more than 300 species (Xu et al., 2019). Its representatives possess diverse physiology in the marine ecosystem and play an important role in biogeochemical cycling (Xu et al., 2019). Detailed studies for the genome of Labrenzia sp. CP4, Labrenzia PO1 and PHM005 and transcriptome of LZB033 are already available (Zaynab et al., 2020a). In the present study, we isolated the Labrenzia sp. PO1 and SY1 strains from A. sanguinea at logarithmic growth stage and quantitatively examined their transcriptome. To gain insight into the growth of Labrenzia sp. PO1 and SY1, their transcriptomes were sequenced, and gene expression was quantified. Further, differential gene expression analysis was conducted, including pathway enrichment and broader gene ontology enrichment. Our results gave new insight into the growth and metabolic regulation of Labrenzia sp. PO1 and SY1 at the transcriptomic level suggest that various gene targets are involved in the control mechanism of red tides.
2 Materials and methods
2.1 Isolation and growth of the bacterial strain
A. sanguinea cultures were plate streaked, and bacteria were isolated by serial dilutions at logarithmic growth phase (15 days) and maintained in Zobell marine agar 2216E medium (Zaynab et al., 2020a, 2021b). Genomic DNA was extracted with Bacterial DNA (Omega, USA) Kit following company guidelines. For the Labrenzia PO1 sequence, the taxon bacteria was defined in GenBank using the BLAST tool (https:/blast.ncbi.nlm.nih.gov/Blast.cgi). A single colony of Labrenzia sp. PO1 and SY1 were grown in 100 mL liquid 2216E medium for 24 h at 200 rpm at 30 °C (Zaynab et al., 2020a, 2021b). Scanning Electron Microscopy (SEM) were performed to observe behavior and morphology of both the colonies of Labrenzia sp. PO1 and SY1on the plate (Zaynab et al., 2020a, 2021b).
2.2 Bacterial biofilm formation
Isolated and purified bacteria were grown (30 °C, 200 rpm) to the logarithmic growth phase (bacterial concentration of 108 cell mL−1 almost 24 h). The bacterial solution to be tested for biofilm formation was mixed with A. sanguinea algae (at logarithmic phase, i.e.,104 cell mL−1) in a 1:1 ratio. Simply 1 mL of each bacteria and algae was mixed and added to a 12-well plate. For control, 1 mL of 2216E liquid medium and 1 mL of algal solution were added, and a blank control was also included. Incubated under light for 2 to 3 days and manually shaken at regular intervals for 2 to 3 times daily. Finally, the algae dissolving ability of bacteria was observed under the microscope.
2.3 Extraction of RNA and cDNA library preparation
TRIzol (Life Technologies, Thermo Fisher Scientific Inc.) reagent was used to extract the total RNA from PO1 (16 h log and 32 h stationary phase) and SY1 (16 h log and 32 h stationary phase) bacterial strains. For extraction, the bacterial cultures were centrifuged to get the bacterial pellet and resuspended in Trizol reagent (1 mL) with 1/100 vol of network polyacryl and then shifted hygienic, sterile beads beating tubes having 150 µl zirconia beads (Biospec Products, Bartlesville). The POI (16 h and 32 h) and SYI (16 h and 32 h) were pulsed at a maximum speed three times (one minute each time) while kept on ice for 2 min after each pulse. The samples were shifted to sterilized tubes, and beads were cleaned with 100 µl TRI reagent supplied with carrier and added to previous samples. Samples were kept at room temperature for 10 min and centrifuged at 12000×g at 4 °C for 10 min. The supernatant was pipetted out into new tubes, and 100 µl 1-Bromo-3-chloropropane was added, vortexed for 15–20 s, and kept at RT for 10 min. Centrifuged again (12000×g, 4 °C, and 15 min) and the supernatant was transferred to new tubes, and RNA was precipitated with 500 µl isopropanol. To pellet out the RNA, samples were centrifuged (12000×g, 4 °C, 8 min) and washed with 800 µl 75% ethanol by vortexing for 15 s. The pellet was dried for 8 min and resuspended in 150 µl of nuclease-free water. Amont and quality of RNA were measured by Agilent 2100 Bioanalyzer (Agilent Technologies, http://www.agilent.com) combined with an Agilent RNA 6000 Nano Labchip kit. A total of four cDNA libraries were constructed, two for PO1 (16 and 32 h) and the other two for SY1 (16 and 32 h). For the cDNA library preparation, mRNA was isolated by both Sera-Mag oligo dT magnetic beads and Dynabeads (Invitrogen) following the Dynabeads mRNA direct kit (Invitrogen). The enriched mRNAs were fragmented and reverse transcribed for first and second-strand cDNA synthesis. Adapters were subsequently attached to the resulting double-stranded fragments, and further appropriate fragments of DNA were used as a template for PCR amplification.
2.4 Illumina sequencing, transcript assembly, and annotation
Transcriptome sequencing was performed by Genergy Biotechnology Co., Ltd (Shanghai, China). Sequencing of cDNA library was conducted on an Illumina® HiSeq 2500, and 100nt paired-end raw reads were obtained. FastQC (v0.11.5) software was used to check the quality of raw reads. Low-quality reads adapter sequences and Poly-N-containing reads were removed by skewer(v0.2.2) to get high-quality clean reads, which were then aligned to the reference genome of L. aggregata using STAR(2.5.3a). Transcriptome assembly was performed by stringTie (v1.3.1c) software. The results were normalized to Fragments Per Kilobase of transcript sequence per Million base pairs sequenced (FPKM) using StringTie(v1.3.1c). The DESeq2 (v1.16.1) R package was used to analyze the differential gene expression in each strain. DESeq2 offers statistical routines using a negative binomial distribution-based model to determine differential expression in digital gene expression data. To assess the false discovery rate (FDR), the resulting P values were modified using the Benjamini & Hochberg method (Benjamini and Hochberg, 2013). An adjusted P value of < 0.05 found by DESeq was considered differentially expressed genes. Genes with log2 FC ≥ 1.5 were considered increased transcript abundance, and log2 FC < -1.5 considered decreased transcript abundance. Gene functions and Kyoto Encyclopedia of Genes and Genomes (KEGG)were annotated based on multiple databases, namely non-redundant (Nr) sequences, Gene Ontology (GO), Clusters of Orthologous Groups (COGs), and Swiss-Prot public protein databases. TopGO (http://www.bioconductor.org/packages/release/bioc/html/topGO.html) was used for GO function analysis. All DEGs were mapped to the KEGG database (https://www.genome.jp/kegg/pathway.html) or KEGG annotations, using BLASTX. GO, and KEGG enrichment analyses were performed using Fisher’s exact test to calculate the p-value, GO term, and KEGG pathways with p-value < 0.05 were taken as significantly enriched. Heat maps were made using ImageGP (http://www.ehbio.com/ImageGP/index.php/Home/Index/PHeatmap.html) for (SY1 16 h(16 h-1,16 h-2,16 h-3) vs SY1 32 h(32 h-1,32 h-2,32 h-3) and PO1 16 h (16 h-1,16 h-2,16 h-3) vs POI 32 h (32 h-1,32 h-2,32 h-3).
2.5 Real-time quantitative PCR (RT-qPCR)
Total RNA was extracted with the TRIzol reagent (Life Technologies, Thermo Fisher Scientific Inc.). Primers were designed by Primer Premier 5.0 software (Supplementary Table 1) as per transcriptomic results. To perform RT-qPCR, the SYBR Premix Ex Taq™ (Tli RNaseH Plus) kit (TaKaRa, Japan) was used with cycling conditions of 30 s, 5 s, and 30 s at 95 °C, 95 °C, and 60 °C, respectively. RT-qPCR was performed using the BioRad CFX96 Real-Time PCR Detection System. The 16S rRNA gene was used as the internal control for gene expression standardization. RT-qPCR was carried out in three replicates. Relative quantitative gene expression was estimated by 2 − ΔΔCt method (Livak and Schmittgen, 2001; Zaynab et al., 2019, 2020b). Analysis of variance (ANOVA) was used to check the significant differences among group means by least significant difference (LSD) at P < 0.05.
3 Results
3.1 Labrenzia sp. PO1 isolation
In this study, Labrenzia strain PO1 was identified and isolated. Its 16S rRNA sequence accession numbers and related sequences in the GenBank database are shown in Table 1. This strain was isolated from the logarithmic growth phase, and it belongs to the Roseobacter clade of Rhodobacteraceae.
| Strain | GenBank NO.1 | Reference genome | Gene similarity% | Biofilm forming ability | Algae dissolving ability% | Indole Acetic Acid |
|---|---|---|---|---|---|---|
| PO1 | MH443361 | KP301106.1 | 99 | + | 0 | – |
| SY1 | MH454488 | MF948954.1 | 100 | – | 0 | – |
3.2 Growth and characteristics of PO1 and SY1
The Labrenzia sp. PO1 and SY1 strains are members of Labrenzia species that were isolated from the A. sanguinea culture. The culture conditions for PO1 and SY1 marine bacteria were similar. Their growth analysis (Fig. 1 A) showed that both strains reached the logarithmic growth phase. Labrenzia sp. SY1 reached maximum growth of 1.25 × 10⁴ after 30 h, and PO1 strain reached maximum growth (2.0 × 10⁴ cells) after 24 h. PO1 and SY1both indicated a significant difference between the two strains. Their morphological characteristics viewed by SEM are shown in Fig. 1 B and C.
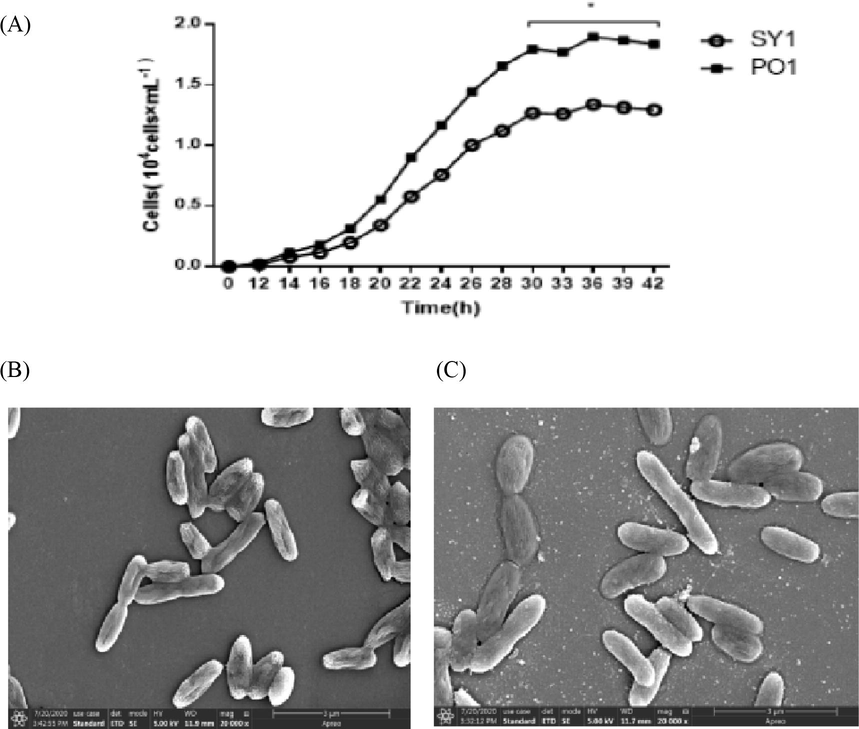
- Growth curve of Labrenzia sp. Strain PO1 and SY1 (A). SEM image of Labrenzia sp. PO1 (B) and Labrenzia sp. SY1 (C).
The PO1 and SY1 strains exhibited similar behavior and morphology on the plate (Fig. 1 B and C, Table1). Both the colonies of Labrenzia sp. PO1 and SY1 are round, with smooth edges. However, their color was different, as PO1 was milky white, and SY1 was creamy yellow. A blackening incident was noticed starting from the edges and moving towards the middle of a single colony when plates were kept for more than a week; this was observed earlier in SY1 than in PO1. The two marine bacterial strains have a genetic similarity. The critical functional difference was forming a biofilm (Table 1), as only Labrenzia sp. PO1 cells were able to do so.
3.3 Illumina HiSeq mRNA sequencing and transcriptomic assembly
The clean reads were obtained after removing unknown nucleotides, adapters, and low-quality sequences (Table 2). Four separate transcriptome libraries were pooled and assembled to get the clean reads. PO1 (16 h, 32 h) and SY1 (16 h, 32 h) provided a total of 119,018,646 and 119,706,384 clean reads (Table 2), respectively, after raw reads were trimmed. The base Q20 value was more than 20, and the error rate ≤0.01%, which reflected a base call accuracy of 98.23% and 98.40% for PO1 (16 h, 32 h) and 98.25% 98.43% for SY1 (16 h, 32 h).
| Samples | Total Raw Reads | Total Clean Reads | Total Clean Bases | Q20% | Total mapped | Mapped ratio (%) |
|---|---|---|---|---|---|---|
| PO1-16 h | 52,843,290 | 52,273,222 | 7,861,965,579 | 98.23% | 51,470,461 | 98.27% |
| PO1-32 h | 67,536,432 | 66,745,424 | 9,840,018,521 | 98.40% | 64,399,341 | 96.50% |
| SY1-16 h | 44,586,038 | 44,141,448 | 6,639,499,470 | 98.25% | 43,647,990 | 99% |
| SY1-32 h | 76,337,812 | 75,564,936 | 11,140,825,635 | 98.43% | 71,009,198 | 93.97% |
3.4 Differential gene expression analysis through RNA-seq
We measured the distribution of unique reads in each differential gene expression library to determine RNA-seq data's normality in each of the four libraries. This normality value was the ratio of the number of bases in a gene covered by specific mapping reads from our transcriptome to the total number of bases. The abundance of categories distributed over various reads exhibited common trends across all four libraries. A total of 6067 genes in the Labrenzia sp SY1 and 6067 genes in Labrenzia sp PO1 were identified by RNA sequencing. Of the 2320 DEGs for SY1 (16 h vs. 32 h), 1554 showed increased transcript abundance, and 766 were found to decreased transcript abundance. Out of 2402 DEGs in PO1 (16 h vs. 32 h), 1807 genes showed increased transcript abundance, and 595 were decreased transcript abundance. In total, 4,722 DEGs were identified between SY1 and PO1 (Table 3). Further elucidation of DEGs was performed through a heat map (Fig. 2). Principal Component Analysis (PCA) was conducted for gene expression data to summarise variability in the main components to allow comparison between samples. PCA was used to evaluate the gene fragments per kilobase million values of all 12 samples. The PCA plot of significant components 1 and 2 indicated no similar spatial distribution among the samples (Supplementary Fig. 1).
| Sample | Increased transcripts abundance | Decreased transcripts abundance | Total DEGs | Total Genes |
|---|---|---|---|---|
| PO1 (16 h vs 32 h) | 1807 | 595 | 2402 | 6067 |
| SY1(16 h vs 32 h) | 1554 | 766 | 2320 | 6067 |
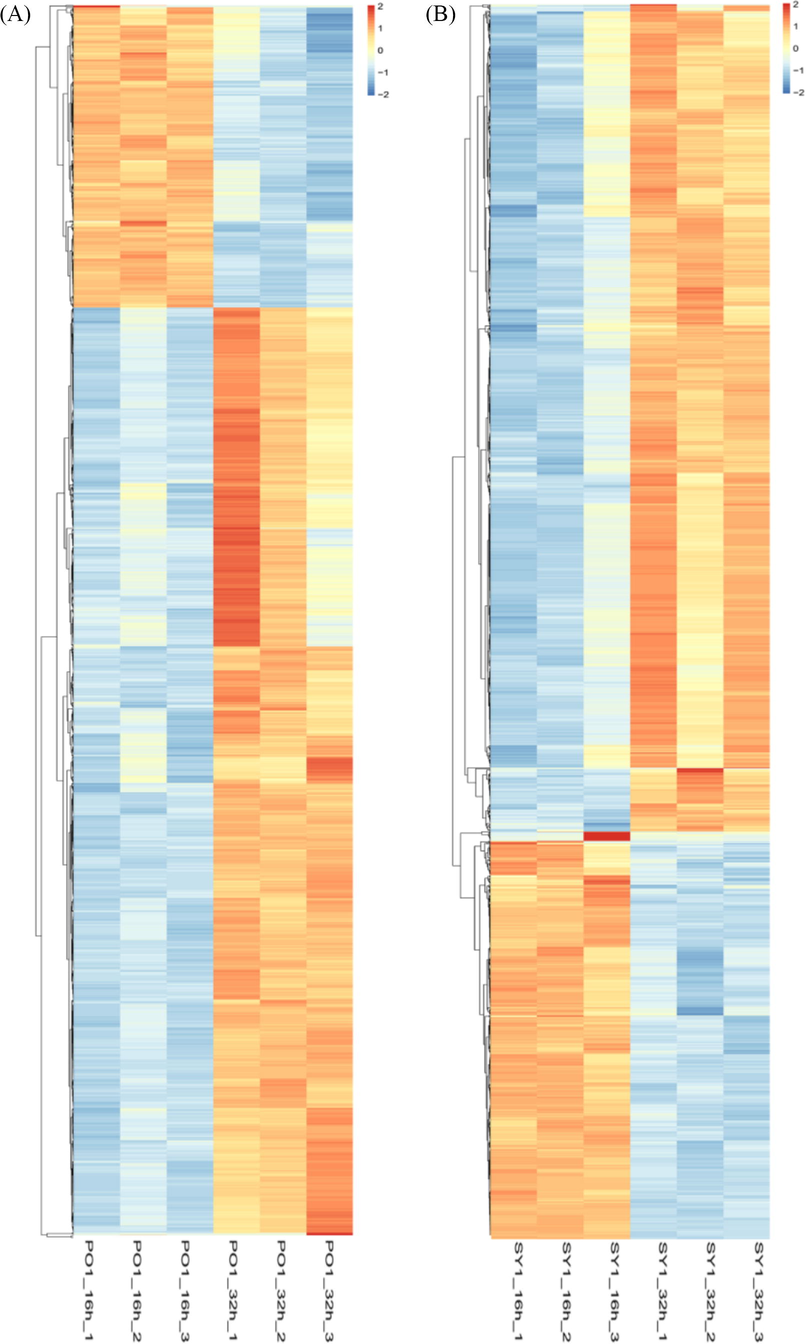
- A heat map of differently expressed genes. Orange color indicates high expression; blue indicates low expression. (A) heat map of PO1 and (B) heat map of SY1.
3.5 Functional analysis of differentially expressed genes
Gene ontology (GO) analysis and annotation were conducted after transcriptome sequencing. Multiple GO terms were assigned to the same unigene in various instances. All DEGs were grouped into various subgroups related to molecular functions, cellular components, and biological processes (Fig. 3A and B). For PO1, enriched biological processes included organic substance transport, the establishment of localization, localization, transport, molecular functions had structural constituent of ribosome, transporter activity, structural molecule activity, ATPase activity, and cellular components included ribosome, ribonucleoprotein complex, protein-containing complex, and proton-transporting ATP synthase complex. For SY1, enriched biological processes had organic substance transport, peptide biosynthetic/metabolic process; molecular functions included structural constituent of ribosome, structural molecule activity, rRNA binding, organic phosphonate transmembrane transporter activity, and cellular components included protein-containing complex, ribosome, ribonucleoprotein complex, and proton-transporting ATP synthase complex. KEGG is a metabolic pathway database that can be used to relate genes to cellular processes. The research utilizes the KEGG pathway analysis to explain the dynamic biological role of genes in biological networks. Thus, the KEGG metabolic pathway database was used to examine the observed DEGs' metabolic pathways. In PO1 and SY1, pathways were significantly enriched. DEGs in the SY1 strain were substantially enriched in the ABC transporters, Ribosome, Photosynthesis, Nitrotoluene degradation, Biosynthesis of siderophore group nonribosomal peptides, Atrazine degradation, Tropane and piperidine, and pyridine alkaloid biosynthesis. Similarly, enriched pathways in PO1 included, Ribosome, Photosynthesis, Atrazine degradation, Tuberculosis, and ABC transporters (Fig. 4A), notably, ABC transporters, which were the main focus of the study.
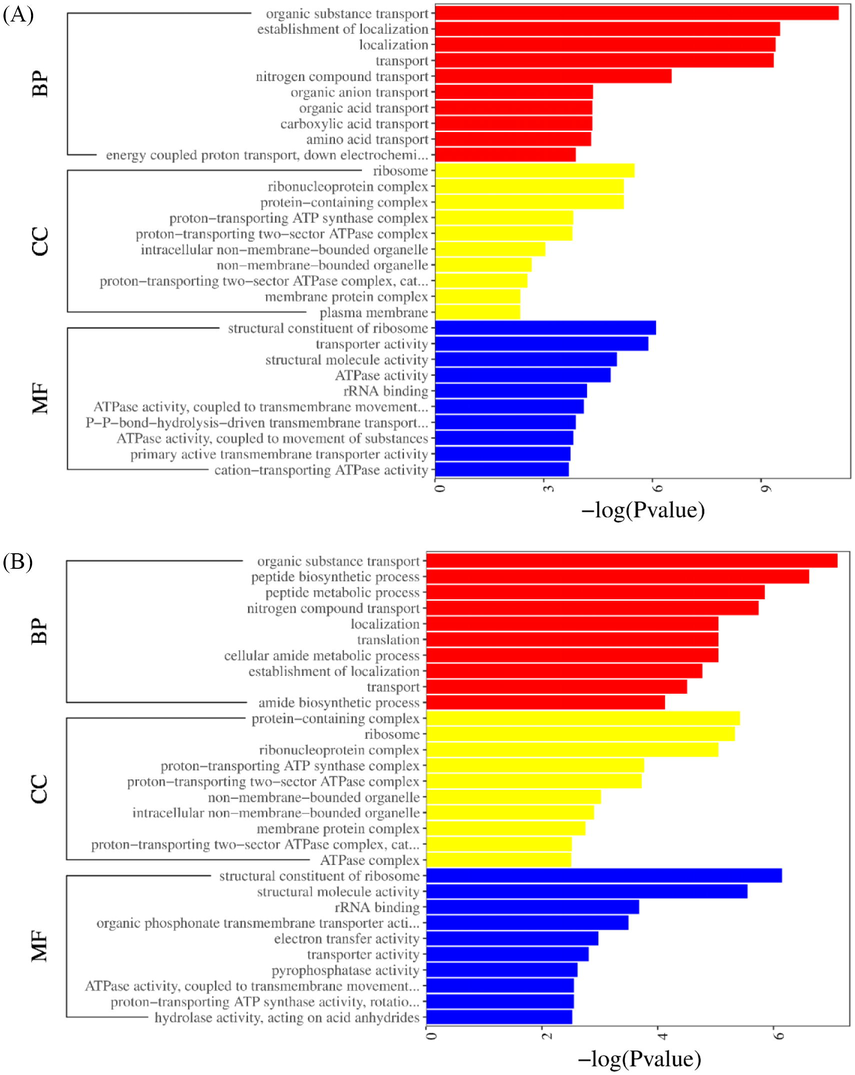
- The most enriched Go classification of DEGs of (A) PO1 at (16 and 32 h) and (B) SY1 at (16 and 32 h). BF; biological processes, CC; cellular components, MF; Molecular function.
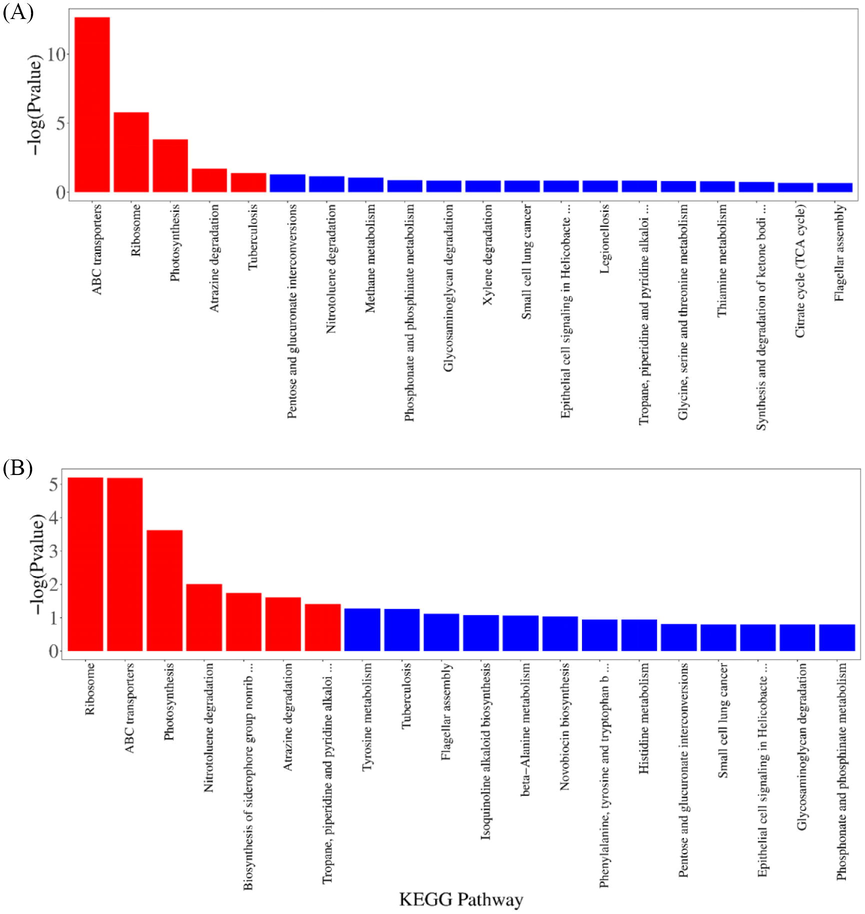
- (A) KEGG pathway enrichment of DEGs in PO1 (16 and 32 h) and (B) KEEG pathway enrichment of DEGs in SY1(16 and 32). The red color showed significantly enriched pathways with p-value < 0.05. The blue color showed non significantly pathways.
3.6 Identification of transporter proteins
According to GO functional annotation, 23 DEGs that may be involved in the rapid growth of PO1 than SY1 were identified, among those, we identified genes encoding transport proteins, including ABC transporter permease protein (ycjO), branched-chain amino acid transport permease protein (livM), trehalose transport system permease protein SugB, (sugB), branched-chain amino acid transport ATP-binding protein (LivG), and ectoine TRAP transporter large permease protein TeaC (teaC) (Supplementary Table 2). The FPKM values of transporters encoding genes were higher at 32 h than 16 h. For example, the FPKM of livM reached 17.178764 (average of three biological replicates) at 32 h and 6.913348 (average of three biological replicates) at 16 h in SY1. Similarly, the transporter-encoding genes expression level was higher at 32 h when compared to PO1 at 16 h (Fig. 5A). Similarly, all these genes were increased transcript abundance in PO1, while no significant change was observed in SY1 in the present study (Fig. 5B). These observations suggested that PO1 rapid growth may be related to transporter proteins’ higher expression (Supplementary Table 2) compared to SY1.
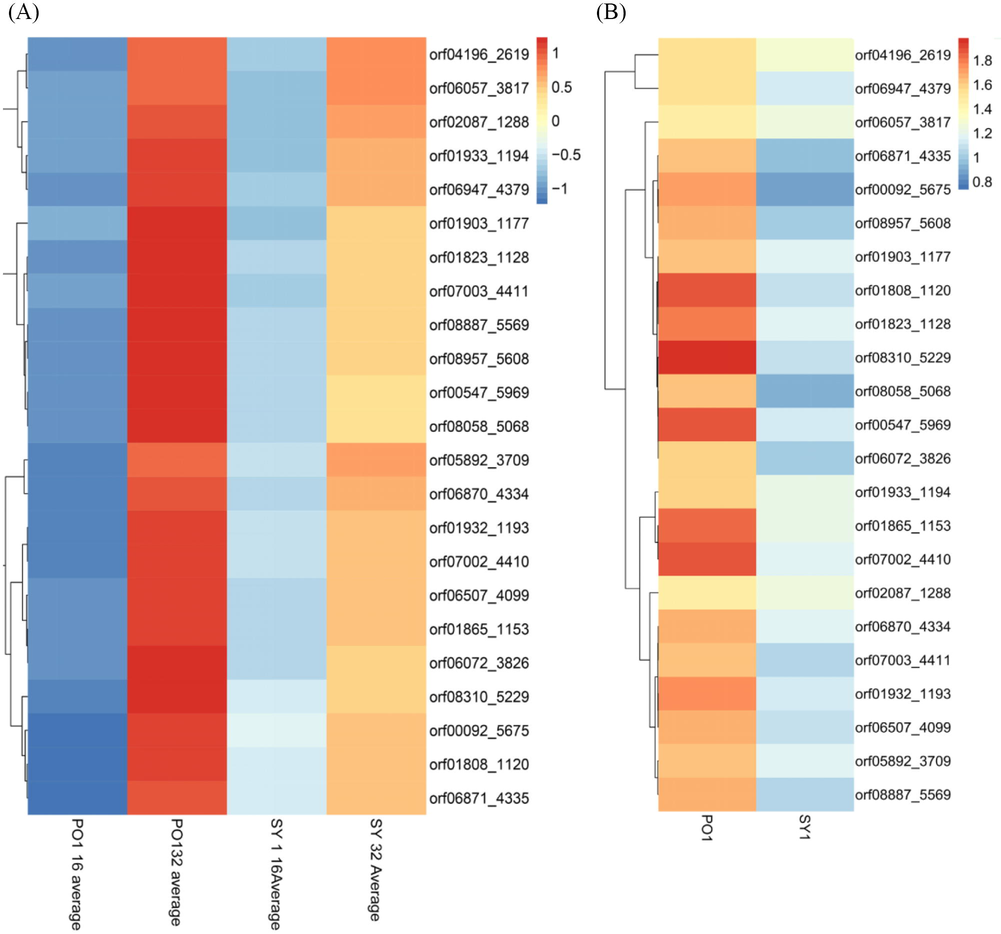
- (A) Heat map of transporters encoding genes PO1 and SY1. PO1 16 h average (three biological replicates FPKM average) and PO1average 32 h (three biological replicates FPKM average). SY1 16 h average (three biological replicates FPKM average) and SY1average 32 h (three biological replicates FPKM average). The red color showed a high expression of genes at 32 h compared to blue at 16 h in PO1. Similarly, blue color in 16 h showed FPKM expression is lower than FPKM expression at 32 h inSY1. Fig. 5. (B). Heat map of transporters encoding genes in PO1 and SY1. Red color or orange color showed expression of transporter encoding genes is higher in PO1 than the expression of SY1that is with blue color.
3.7 mRNA expression level
To validate RNA-seq data, RT-qPCR analysis was conducted. Genes found to be with increased transcript abundance in PO1, such as yurN, NGR_a02190, livM, mgtE, and ycjO, exhibited similar expression patterns as revealed by RT-qPCR analysis (Fig. 6). Their mRNA expression was higher in PO1, indicating that the results of the qRT-PCR were in agreement with RNA-seq data (Fig. 6). Therefore, the RNA-seq results' reliability was verified by the similarity of expression patterns for these 5 DEGs.
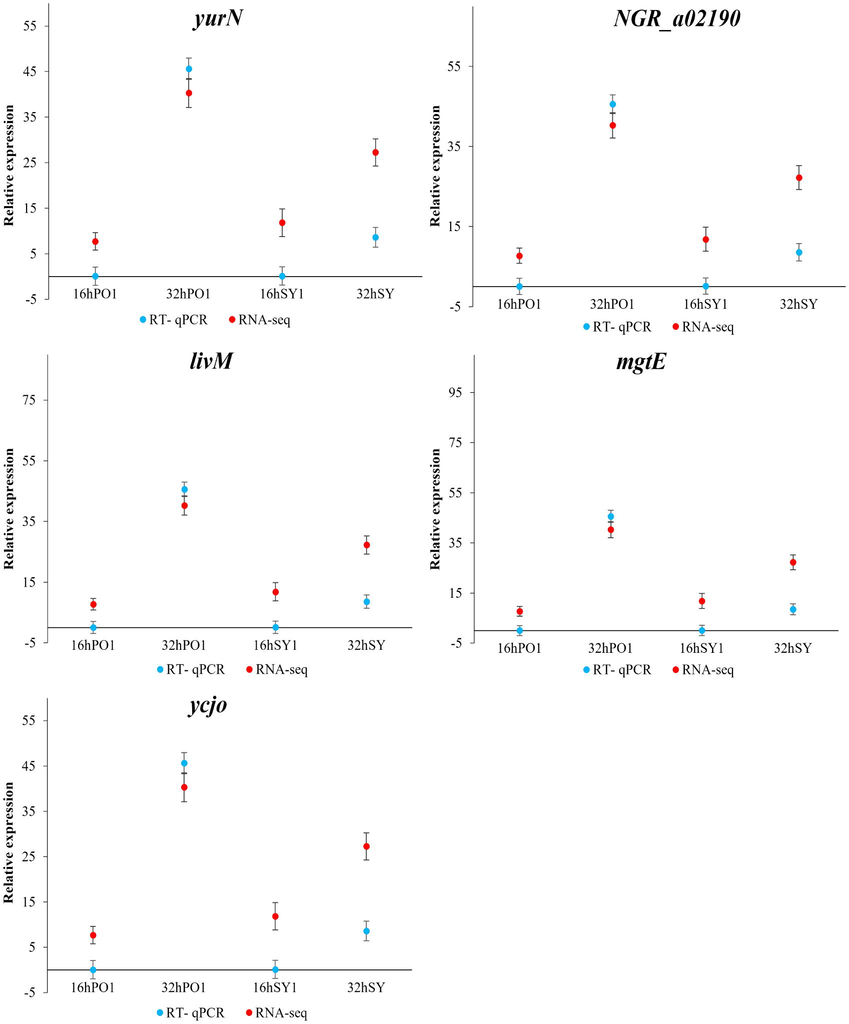
- Comparison of mRNA expression levels determined by RNA-seq and RT-qPCR for five selected genes. mRNA expression levels at (16 h and 32 h) of PO1 and mRNA expression levels at (16 h and 32 h) of SY1. The error bars show the standard error of the mean of technical replicates. Mean ± SE Values arr based on three independent experiments (n = 3) and the significance level was set at P < 0.05. All qPCR data were normalized against the housekeeping gene 16S rRNA. yurN,ABC transporter permease protein;NGR_a02190,ABC transporter permease protein; livM,High-affinity branched-chain amino acid transport; mgtE, Magnesium transporter; and ycjO, ABC transporter permease.
4 Discussion
In this study, investigated the role of transporters in Labrenzia PO1 and SY1 using RNA sequencing (RNA-seq) technology. High-throughput RNA sequencing (RNA-seq) method is opening new horizons in the field of transcripts participated in specific biological metabolic processes (Zaynab et al., 2018).
The ABC transporter family consists of exporter as well as importer proteins. Their expression and transport functions are strictly regulated to maintain the need for critical nutrients and substrate effects. These substances are required for rapid bacterial growth and development. As KEGG pathway analysis revealed, several ABC transporter encoding DEGs showed significant changes in the growth and development process of Labrenzia sp. PO1, indicated that ABC transporters might play role in signaling pathways that enhance growth compared to SY1.
We identified 23 differentially expressed transporter protein-encoding genes that may regulate Labrenzia PO1 rapid growth than Labrenzia SY1. The enhanced expression level of transporter-encoding genes such as ycjO, NGR a02190, MJ0412, livG, teaC, HI 0050cdiB2, ydeG, HI 0051, livF, araQ, ynjD, and potB (Supplementary Table 2) may be playing a role in the regulation of higher growth in Labrenzia sp. PO1 compared to SY1. This involvement's putative underlying mechanism includes the expression of transporter proteins, which then transfer substrates necessary for rapid growth, including nutrients. Transporter-encoding gene expression levels were higher at 32 h when compared to 16 h in PO1 (Fig. 5A). The expression of ABC transporter genes was highest at 32 h, parallel to maximum growth, which was also observed at 32 h (Fig. 1A). This observation supports the notion that enhanced expression of ABC transporters may be responsible for the highest growth of Labrenzia sp. PO1 compared to SY1. In contrast, these 23 ABC transporter-encoding genes were not significantly differentially expressed in the SY1 strain. This may be related to the relatively lower growth of SY1 bacterial strain compared to PO1.
The differentially expressed ABC transporter genes of PO1 may also encode efflux proteins that export signaling molecules that may induce the gene expression pattern observed during Labrenzia planktonic growth (Zhu et al., 2008). In addition, many transporters have been recognized as important for the transport of signaling molecules implicated in growth regulation. Although it has been proposed that tiny signaling molecules may easily diffuse through the cell membrane, active transport is often required for the export of such small molecules (Yang and Hinner, 2015). In addition, during bacterial bioluminescence and the growth of some bacteria (McNab et al., 2003), molecules are readily dispersed across the cell membrane and are detectable by a two-component regulatory system, such as in Vibrio harveyi (Walters and Sperandio, 2006).
Labrenzia sp. PO1 could form biofilms, whereas SY1 was unable to do so. Biofilm formation is a complicated process that results in significant physiological changes. For bacteria, the acquisition of nutrients is essential for colonization of the host environment. Most importers serves as nutrient distributers. Example importers include riboflavin transporters, typically found in Bacillus subtilis, Listeria monocytogenes, and Clostridium difficile, while ABC importers are present Brucella abortus, Proteus mirabilis, and Yersinia pestis (Gutiérrez-Preciado et al., 2015). Bacteria are adapted to rapidly respond to changing host micro environments by selectively up-regulating ABC transporters to acquire the various nutrients required for rapid growth and survival (Garmory and Titball, 2004).
Signals may be transported into the bacterial cells via ABC transporters as observed in E. coli and Salmonella enterica serovar Typhimurium (Walters and Sperandio, 2006). Further, active transport is responsible for both the export and import of a broad range of signaling molecules, such as peptides, as observed in S. aureus (Vuong et al., 2000). Such transporters are part of their respective signaling systems. Thus, the inactivation of one of these signal transporters would terminate the subsequent signal transmission and stop the programmed regulation of gene expression, as observed for the expression pattern of transporters in Labrenzia sp. SY1. The genes encoding transporter proteins were not differentially expressed in Labrenzia sp. SY1. Low transporter expression may have prevented the transport of factors required for biofilm formation, while the up-regulated transporter protein-encoding genes in PO1 may have contributed to biofilm formation.
5 Conclusion
Transcriptome analysis was used to study the genes responsible for Labrenzia PO1 rapid growth, and some of the critical genes identified correlated with the higher growth of Labrenzia sp. PO1 than SY1 growth. The expression patterns of specific genes were further confirmed by qRT-PCR analysis and associated with the growth of Labrenzia sp. PO1 and SY1. More specifically, the results suggested that ABC transporter-encoding genes were involved in the higher growth of PO1 when compared with SY1 growth. Transporter-related transcripts that were not differentially expressed may have contributed to the slower growth and lack of biofilm formation in SY1. The results of this study provide knowledge that may help identify genes that enhance growth and promote biofilm formation. We propose that the transcriptional regulation of these genes eventually results in the inhibition or promotion of biofilm development. This study suggests that the growth of Labrenzia sp. PO1 may be targeted to control red tides through the suppression of ABC transporters.
Acknowledgements
This work was supported by National Key Research and Development Program of China(2020YFD0901003) and Shenzhen Grant Plan for Science and Technology (JCYJ20170818092708470), Shenzhen science and technology key project (JSGG20171013091238230), Shenzhen science and technology application demonstration project (KJYY20180201180253571) The authors extend their appreciation to Taif University for funding current work by Taif University Researchers Supporting Project number (TURSP - 2020/142), Taif University, Taif, Saudi Arabia..
Author Contributions
Madiha Zaynab, Huirong Chen, Yufei Chen, Khalid Ali Khan prepared, performed library preparation, sequencing, data analysis, and drafted the manuscript. Liao Ouyang performed RNA extraction and library preparation. Qinghua Zeng, Wang Xu, Xuewei Yang, Shuangfei Li co-conceptualised the project, participated in experimental design. Madiha Zaynab , , Wang Xuc, and Qinghuai Zeng performed the revision of the manuscript.
Declaration of Competing Interest
The authors declare that they have no known competing financial interests or personal relationships that could have appeared to influence the work reported in this paper.
References
- Interaction and signalling between a cosmopolitan phytoplankton and associated bacteria. Nature. 2015;522(7554):98-101.
- [Google Scholar]
- Interactions between diatoms and bacteria. Microbiol. Mol. Biol. Rev.. 2012;76(3):667-684.
- [Google Scholar]
- Cyclopropane-containing fatty acids from the marine bacterium Labrenzia sp. 011 with antimicrobial and GPR84 activity. Mar. Drugs. 2018;16:369.
- [Google Scholar]
- Bleves, S., Voulhoux, R., Ize, B., Sana, T. G., and Monack, D. (2020). PROTEIN EXPORT AND SECRETION AMONG BACTERIAL PATHOGENS.
- Pathogenic adaptations to host-derived antibacterial copper. Front. Cell. Infect. Microbiol.. 2014;4:3.
- [Google Scholar]
- Exploring the biological roles of Dothideomycetes ABC proteins: Leads from their phylogenetic relationships with functionally-characterized Ascomycetes homologs. PLoS ONE. 2018;13(8):e0197447.
- [CrossRef] [Google Scholar]
- How viral and intracellular bacterial pathogens reprogram the metabolism of host cells to allow their intracellular replication. Front. Cell. Infect. Microbiol.. 2019;9:42.
- [Google Scholar]
- Bacterial stress responses during host infection. Cell Host Microbe. 2016;20(2):133-143.
- [Google Scholar]
- ATP-binding cassette transporters are targets for the development of antibacterial vaccines and therapies. Infect. Immun.. 2004;72(12):6757-6763.
- [Google Scholar]
- Integrated signaling pathways mediate Bordetella immunomodulation, persistence, and transmission. Trends Microbiol.. 2019;27(2):118-130.
- [Google Scholar]
- Extensive identification of bacterial riboflavin transporters and their distribution across bacterial species. PLoS ONE. 2015;10(5):e0126124.
- [CrossRef] [Google Scholar]
- Bacterial-host interactions: physiology and pathophysiology of respiratory infection. Physiol. Rev.. 2018;98(2):781-811.
- [Google Scholar]
- Genome-wide identification of whole ATP-binding cassette (ABC) transporters in the intertidal copepod Tigriopus japonicus. BMC Genomics. 2014;15(1):651.
- [CrossRef] [Google Scholar]
- Analysis of relative gene expression data using real-time quantitative PCR and the 2− ΔΔCT method. Methods. 2001;25(4):402-408.
- [Google Scholar]
- LuxS-based signaling in Streptococcus gordonii: autoinducer 2 controls carbohydrate metabolism and biofilm formation with Porphyromonas gingivalis. J. Bacteriol.. 2003;185(1):274-284.
- [Google Scholar]
- Enhanced exopolysaccharide production and biofilm forming ability in methicillin resistant Staphylococcus sciuri isolated from dairy in response to acyl homoserine lactone (AHL) J. Food Sci. Technol.. 2018;55(6):2087-2094.
- [Google Scholar]
- Impact of the agr quorum-sensing system on adherence to polystyrene in Staphylococcus aureus. J. Infect. Dis.. 2000;182(6):1688-1693.
- [Google Scholar]
- Quorum sensing in Escherichia coli and Salmonella. Int. J. Med. Microbiol.. 2006;296(2-3):125-131.
- [Google Scholar]
- T. Xu M. Yu J. Liu H. Lin J. Liang X.-H. Zhang M. Kivisaar Role of RpoN from Labrenzia aggregata LZB033 (Rhodobacteraceae) in formation of flagella and biofilms, motility, and environmental adaptation 85 7 10.1128/AEM.02844-18.
- Getting across the cell membrane: an overview for small molecules, peptides, and proteins. In “Site-specific protein labeling”. Springer; 2015. p. :29-53.
- Signs of biofilm formation in the genome of Labrenzia sp. PO1. Saudi J. Biol. Sci.. 2020;28(3):1900-1912.
- [Google Scholar]
- Transcriptomic approach to address low germination rate in Cyclobalnopsis gilva seeds. S. Afr. J. Bot.. 2018;119:286-294.
- [Google Scholar]
- Proteomic analysis reveals key proteins in seed germination of Cyclobalnopsis gilva. Biochem. Syst. Ecol.. 2019;83:106-111.
- [Google Scholar]
- Proteomics analysis of Cyclobalanopsis gilva provides new insights of low seed germination. Biochimie. 2020;180:68-78.
- [Google Scholar]
- A putative ABC transporter is involved in negative regulation of biofilm formation by Listeria monocytogenes. Appl. Environ. Microbiol.. 2008;74(24):7675-7683.
- [Google Scholar]
Appendix A
Supplementary data
Supplementary data to this article can be found online at https://doi.org/10.1016/j.jksus.2021.101433.
Appendix A
Supplementary data
The following are the Supplementary data to this article:


