

Translate this page into:
Theoretical evaluation of some α-amino acids for corrosion inhibition of copper in acidic medium: DFT calculations, Monte Carlo simulations and QSPR studies
⁎Corresponding author. brahimmhm@gmail.com (Brahim El Ibrahimi)
-
Received: ,
Accepted: ,
This article was originally published by Elsevier and was migrated to Scientific Scholar after the change of Publisher.
Abstract
Abstract
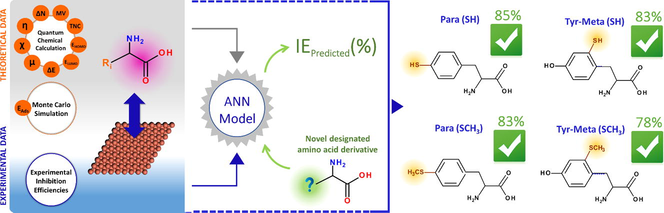
The quantitative structure–property relationship (QSPR) models of the inhibition efficiency of seventeen α-amino acids for copper in acidic medium to their calculated reactivity indicators were developed. DFT calculations and Monte Carlo simulations were employed to find out these indicators. Both multi-linear regression (MLR) and artificial neural network (ANN) methods were employed. The most relevant global descriptors were selected using the simulated annealing algorithm. The QSPR studies showed that the inhibiting performance of the investigated compounds was influenced by their electronegativity, LUMO energy, fraction of electron transferred and total negative charge. The results show that the ANN based model exhibits a great predictive performance compared with MLR model according to correlation coefficient and the root-mean-squared error. In addition, this indicates that the corrosion inhibition of copper by these α-amino acids is mainly a complex phenomenon. Moreover, by analysis of local reactivity indicators and using the ANN constructed model, ten new designed derivative compounds with their predicted inhibition efficiency were proposed.
Keywords
Corrosion
Modeling
DFT
Monte Carlo
Simulated annealing
QSPR

1 Introduction
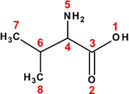
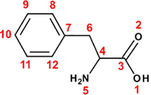
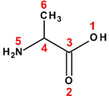
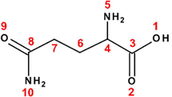
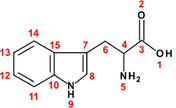
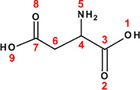
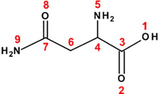
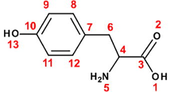
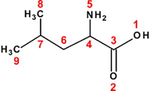
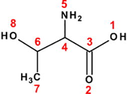
Copper is one of the most used metallic material in many industrial applications, namely: power plants, chemical industries, heating and cooling systems. The choice of this material is attributed to its good mechanical and conductive properties, in addition to its lesser cost. Unless, during cleaning of industrial equipment by acid pickling, the acid comes into contact with copper metal causing its dissolution (El Ibrahimi et al., 2017). One of the most used methods to prevent the corrosion phenomena is the corrosion inhibitor compounds. This process showed many advantages as its high efficiency, simple feasibility and economically viable (Sastri, 2011). For this purpose, several classes of organic compounds are used for metal protection in various aggressive mediums, especially, in acidic solutions (El Issami et al., 2007). Among these compounds, the α-amino acids were widely studied and exhibited a great ability to act as good corrosion inhibitors at many operating conditions (El Ibrahimi et al., 2017). The α-amino acid molecule (Fig. 1) possesses at least one carboxyl and one amine group bonded to the same carbon atom (α-carbon). The other ligands of the α-carbon are –H or R-group of different size and shape.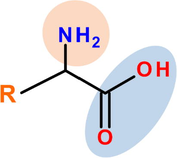
Schematic representation of α-amino acid.
Quantitative Structure–Property Relationship (QSPR) is a modeling approach that has been successfully applied in large chemistry space coverage. Deriving data based on this modeling tool constitute as an attractive supplement or even alternative to an experimental data generation, the latter being both time consuming and costly. Further, QSPR modeling provides an effective way for establishing and exploiting the relationship between chemical structure descriptors of molecules and their activities toward the design of novel corrosion inhibitor candidates (Zhao et al., 2014).
The ability of seventeen α-amino acids to act as corrosion inhibitors for copper in molar nitric acid solution has been investigated by Barouni et al. (2008, 2010, 2013, 2014a,b). The molecular structures of these molecules and their inhibition efficiencies (acquired from potentiodynamic polarization technique at 10−3M) have shown in Table 1. Depending on the pH value of the medium, these molecules can exist in different protonation states (Gece et al., 2010). Due to the high acidity level of used medium and according to the acidity constants (i.e. pKa) of studied compounds, the full protonated forms (see Fig. A.1) were taken into consideration in the computation process, further to neutral forms.
Amino acid
IE (%)
Amino acid
IE (%)
Amino acid
IE(%)
−20
36
56
Valine (Val)
Phenylalanine (Phe)
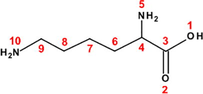
Lysine (Lys)
−1
38
58
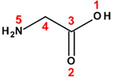
Glycine (Gly)
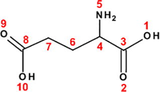
Glutamic acid (Glu)
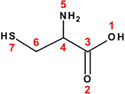
Cysteine (Cys)
25
40
67
Alanine (Ala)
Glutamine (Gln)
Tryptophan (Try)
28
45
80
Aspartic acid (Asp)
Asparagine (Asn)
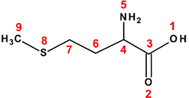
Methionine (Met)
30
46
82
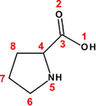
Proline (Pro)
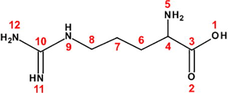
Arginine (Arg)
Tyrosine (Tyr)
34
50
Leucine (Leu)
Threonine (The)
According to the above-mentioned, the objective of the study is to conduct QSPR analysis on these compounds and use the obtained model to screen the inhibition efficiency of some novel designed amino acid derivatives for copper.
2 Computational details
2.1 DFT calculations
Quantum chemical calculation for neutral and full protonated (see Fig. A.1) amino acids both in gas and aqueous phases were performed with Gaussian-09 software. The calculations were made using DFT/B3LYP/6-311 + G(d) method. The solvent effect was treated by IEFPCM model using water. Various global reactivity indicators were calculated. Firstly, we interested in the frontier orbital energies, namely: highest occupied molecular orbital ( ), lowest unoccupied molecular orbital ( ) and its difference, electronegativity ( ), hardness ( ), dipole moment (μ), molecular volume, electron-donating ability ( ), total Negative Charger which were calculated by two manners: from Mulliken Population analysis ( ) and from Natural Bond Orbital analysis ( ) as described in El Ibrahimi (2016). Concerning the local reactivity indicator of these amino acids, we are limited to analyze it through the partial charge on the atoms, electrostatic potential map, HOMO and LUMO distributions on the molecules.
2.2 Monte Carlo simulation
In order to get further information about the interaction between these amino acids and the copper surface, molecular mechanic via Monte Carlo simulation was performed using Materials Studio 6.0 software. The COMPASS force field was used to optimize the structure of all components of the system of interest. Electrostatic and van der Waals were set as the Ewald summation method and atom-based summation method, respectively. The simulation was carried out with a single amino acid molecule on the Cu(1 1 1) crystal surface in a simulation box (20.45 Å × 20.45 Å × 64.61 Å) with periodic boundary conditions to model a representative part of the interface devoid of any arbitrary boundary effects. The chosen of Cu(1 1 1) was justified by its most stability among low Miller index copper surfaces and to its most abundant as provided by Guo et al. (2014). The copper surface was modeled with an eight-layer slab model, each layer contains 64 copper atoms. A great vacuum region with 50 Å thickness was built above Cu(1 1 1) (Fig. 2). All copper atoms in the simulation box were fixed during the simulations.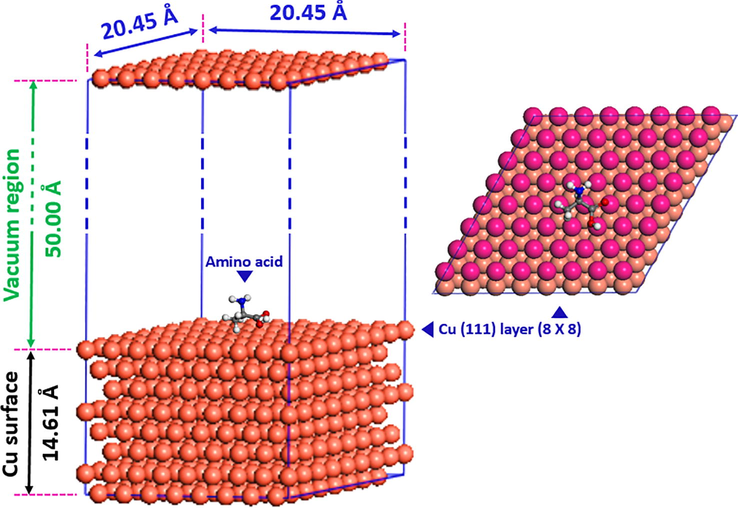
Schematic of periodic slab used in MM-Monte Carlo simulations.
2.3 QSPR studies
The total data were separated into training and test datasets. The first dataset was used to develop the QSPR model, and the second dataset was used to estimate the performance of the obtained model. Next, the feature selection using the simulated annealing algorithm was applied to select the most relevant descriptors, this feature selection is a wrapper method (Brooks and Morgan, 1995).
Two mathematical methods were used to develop QSPR models: multi-linear regression (MLR) and artificial neural network (ANN). The ANN is one of the commonly used methods in the machine learning field. It is a non-linear mathematical approach, which can be used to model too complex structure-property relationship, like corrosion inhibition problems. In this context, one of frequently used supervised learning ANN in QSPR modeling, called the three-layered feed forward network using back-propagation algorithm (Gaxiola and Melin, 2016), was adopted in this study. In this work, a sigmoid transfer function was used in the hidden layer and a linear transfer function in the output layer. For the network training, the Levenberg-Marquardt algorithm was employed. The simulated annealing feature selection combined with MLR and the ANN modeling were performed by using “R” language in R-3.1.3 software.
3 Results and discussion
3.1 Individual descriptor and IE
Before doing any upper level of QSPR analysis, it was important to begin that by a simple linear regression method to model the contribution of each descriptor on the inhibition property of these molecules. The quantum chemical parameters obtained by DFT calculation at B3LYP/6-311 + G(d) level in gas and aqueous phases of neutral and protonated amino acids, such as EHOMO, ELUMO, ΔE and so on, are collected in Tables A.1 and A.2.
In order to show the effect of protonation process on the inhibition performance of studied amino acids. We interested to explorer it via the energy gap (ΔE) and electron-donating ability (ΔN) parameters. Fig. 3(a) presents ΔE as a function of the amino acid nature (exclude Val and Gly) with corresponding IE. In whole, the protonation process has affected the magnitude of this energy, which it is increased for almost amino acids with medium or less IE (orange region). On the other hand, this process has reduced weakly the ΔE for the amino acids with the high IE, like Tyr, Met and so on (green region). In the same way, the values of ΔN are presented as a function of the inhibition efficiency in Fig. 3(b). The positive values indicate the possibility of electron transforming from inhibitor molecules to the metal surface and vice versa if ΔN was negative (El Ibrahimi et al., 2016). It is apparent from the figure that the protonation influenced the ability of those compounds to donate or receive electrons. All neutral compounds exhibited positive values, so after protonation of many amino acids, the lasts become negatives. However, this effect is weaker for compounds with higher IE, as noted previously in the case of ΔE. Nevertheless, the protonation process showed an effect on the reactivity of almost investigated amino acids, which required to consider it in developing of QSPR models.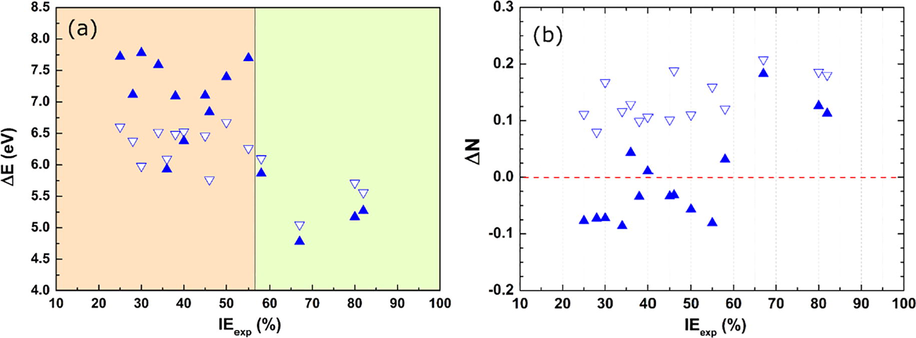
(a) ΔE values of investigated amino acids in aqueous phase and (b) their ΔN values for neutral (
 ) and protonated (
 ) forms.
The calculated quantum parameters of all amino acids were correlated against IE, and the determination coefficient value for each parameter is shown in Fig. 4. As can be seen, the R2 values of ΔN (in aqueous phase) and μ (in gas phase) of neutral amino acids equal zero, such observation showed the absence of correlation between these parameters and the obtained inhibition efficiency via a simple linear model. This observation involves that the calculated ΔN (in aqueous phase) and μ (in gas phase) of neutral compounds did not contribute -absolutely- in the inhibition efficiency of these compounds. Further, it was shown that the calculated parameters in the aqueous phase are correlated more than those in the gas phase. Especially, a large difference is noted for protonated compounds, this can be attributed to the instability of cationic molecules in the gas phase and consequently troubled the calculated quantum parameters, the same trend has been reported by some authors (Zhao et al., 2014). Additionally, this indicated that the calculated descriptors under solvation conditions correlated more to the inhibition efficiency of investigated compounds regarding gas phase. On the other hand, as shown from Fig. 4 the quantum descriptors which involving electronic interaction, namely EHOMO, ΔE, η, χ and ΔN, are exhibited great R2 values, suggesting the chemical interaction nature of these compounds with the copper surface. This observation agrees with the experimental data of Barouni et al. However, the R2 values of all correlation cases remain lower. Otherwise, those parameters could not be used individually to well describe the performance of studied amino acids.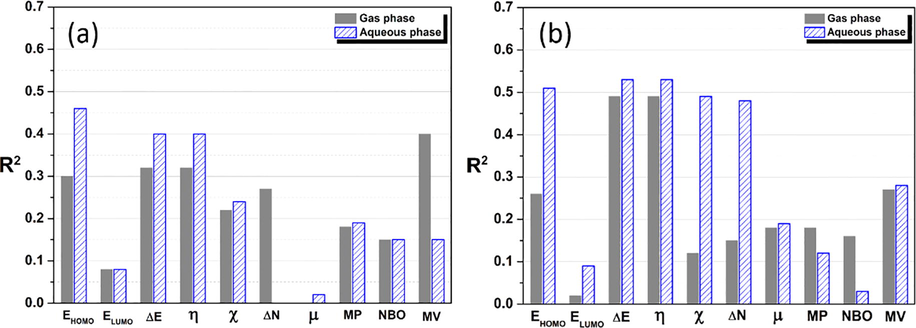
Linear regression values obtained from the correlation between calculated quantum parameters in gas and aqueous phases for (a) neutral and (b) protonated amino acids with the IE.
In favor to get more detail about the interaction of studied molecules with the Cu(1 1 1) surface, molecular mechanic (MM) via Monte Carlo simulations in gas and aqueous phases were performed. Fourteen water molecules are used to simulate the solvation conditions. The calculated values of the adsorption energy (Eads) are reported in Table A.4. As can be noted in the aqueous phase, the absolute adsorption energy is great against its corresponding in the gas phase, which the highest energy is obtained for protonated amino acids forms. This increase in energy is attributed to the stabilization role of the solvent molecules (Kabanda et al., 2013). It should be stated that the similar energies values are found by Kaya et al. (2016a,b). On the other hand, all values of Eads are negative, indicating that the adsorption could occur spontaneously involving exothermic reactions. Additionally, the most stable optimized structures of some amino acids (with highest IE) at neutral and protonated forms adsorbed on Cu(1 1 1) surface are displayed in Fig. 5 (for the rest of compounds see Fig. A.2). As shown from these figures, neutral molecules were adsorbed into Cu(1 1 1) surface through its functional and aromatic groups, which was justified by the presence of free lone pair electron and π-electrons. Regarding restricted geometry conditions, the obtained configurations showed that these neutral amino acids have the priority groups to adsorb on the copper surface, the following sequence is purposed: —COOH, —SR, aromatic ring and then —NH2 groups. On the other hand, it was noteworthy that the protonation process has changed the adsorption configuration of studied amino acids. The protonated amine group was not adsorbed on Cu(1 1 1) surface and is directed outside of it, this can be attributed to the deficient in electronic density on the protonated nitrogen atom. Although, the carboxylic group remains able to adsorb on the copper surface. The same trend has noted by Zhao et al. (2014) on Fe(1 1 0) surface. A considerable effect is noted in the case of Phe, which the phenyl ring is turned with 90° and became perpendicular on Cu(1 1 1) surface for protonated form, (Phe–H)+. In addition to electronic structure (discussed previously through quantum parameters), a simple view of the geometrical structure of the four selected amino acids with the highest inhibition performance shows that planar and heteroatom containing amino acid are responsible on its protection ability.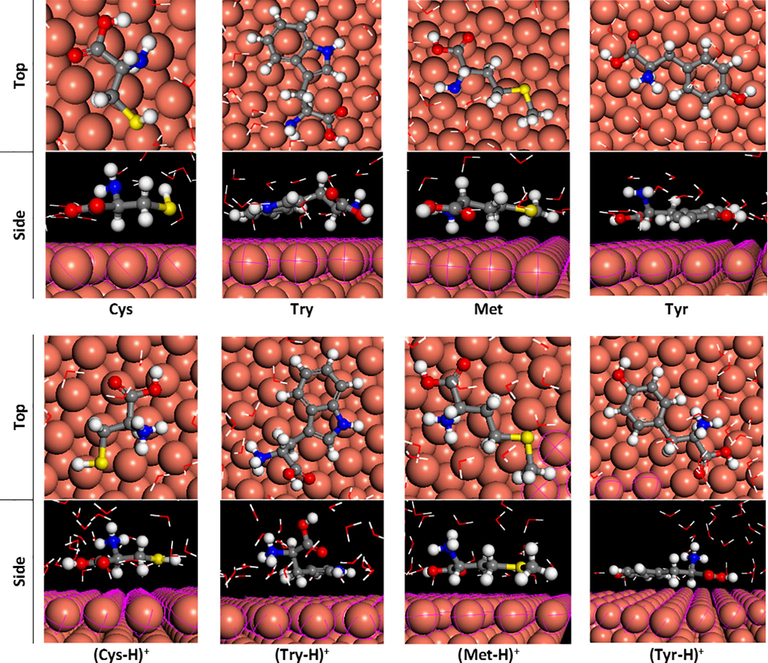
Optimized systems of some amino acids in neutral and protonated forms on Cu(1 1 1) in aqueous phase.
In order to give a whole vision, the obtained adsorption energy values (Table A.4) have used to plot the linear correlation curves with the experimental values of IE (Fig. 6). In different systems, the regression line has shown a negative slope value indicating that the inhibition efficiency increases with the absolute adsorption energy, which it is in accordance with prior studies (Kaya et al., 2016a,b). The R2 values remain lower to build a robust linear model between IE and Eads for the investigated compounds. This can be due to the high complexity of the inhibition process, which involves many factors.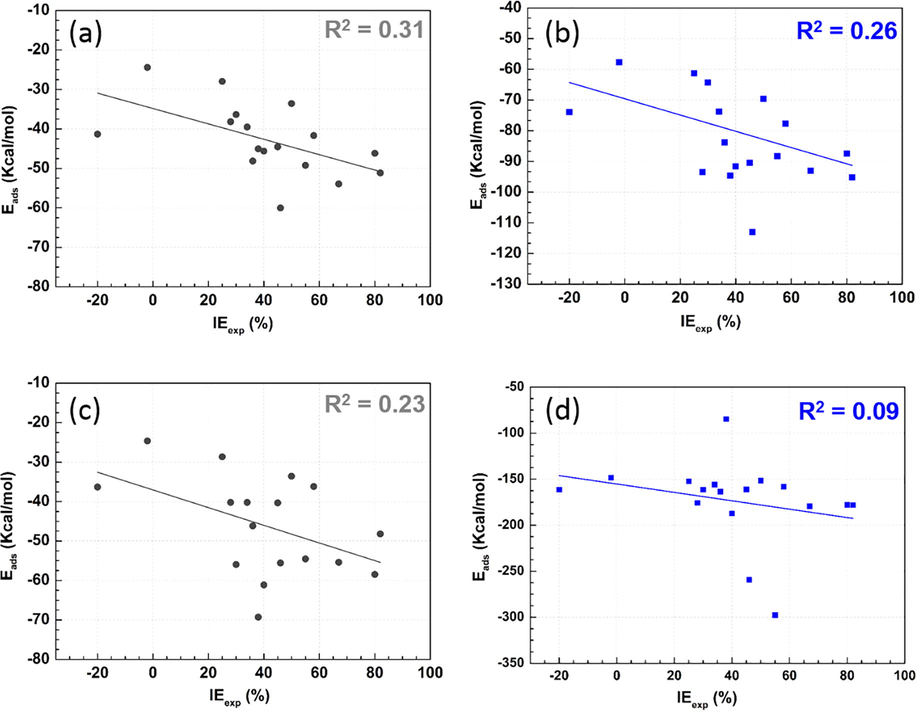
Linear correlation curve of adsorption energy with IE of studied neutral (a,b) and protonated (c,d) amino acids in gas (●) and aqueous (
 ) phases.
3.2 QSPR analysis
One of the most important steps in the QSPR analysis is the variable selection. It was found in the previous section that the calculated parameters in the aqueous phase have shown a great contribution to the inhibition efficiency regarding the gas phase. For this purpose, the twenty-two global descriptors coding the neutral and protonated investigated compounds forms in the aqueous phase was used. In the first stage, to identify the interrelationships between different descriptors, a correlation coefficients calculation was performed. The Pearson correlations matrix between the calculated descriptors is shown in Table A.5. This matrix showed a good (R ≥ 0.5) and poor (R < 0.5) co-linearity between calculated descriptors, like TNCNBO(N) with EAds(N). In order to reduce the redundancy existing in our data set, one of the descriptors pairs that are highly correlated (i.e. R ≥ 0.90) were randomly excluded. Table A.6 collected the thirteen screened descriptors and their R. In the second stage, among these descriptors, the simulated annealing built-in MLR (SA-MLR) analysis was applied to select the most appropriate ones. Consequently, a group of four relevant descriptors was selected including χ(N), ELUMO(P), ΔN(P) and TNCNBO(P).
The Eq. (1) represents the best generated QSPR model by using the MLR method with the four selected descriptors. The intercept and all regression coefficients of used descriptors were found to be statistically significant. An overview of those coefficients and matching descriptor showed, in the first stage, that both neutral and protonated inhibitors forms have contributed differently to the inhibition efficiency. In the second stage, the kind of descriptor and their corresponding correlation coefficients indicate that the inhibitors have probably interacted with the metallic surface through electronic interaction, which it is in agreement with the experimental results
ANN method was used to construct the non-linear model based on the same selected descriptors by the SA-MLR method. In order to improve neural network (NN) generalization and to early stop training before over-fitting due to the limited studied dataset, a validation dataset was employed. In other words, the dataset was randomly divided into three non-overlapping datasets, namely: training (≈80%), validation (≈10%) and test data (≈10%). A training of different neural network architectures demarche was employed. The latest consists to train several NN architectures with a different number of neurons in hidden layer, it was tested from two to ten neurons with one neuron as incremental steps. In the same time, each NN architecture was retrained many times with different sampling and initial conditions i.e. initial weights and biases values of hidden and the output layer. Furthermore, the training was parameterized to be stopped when the validation error (RMSEvalidation) increased for six iterations. Unlike MLR approach, the ANN methods are commonly known as the “black-boxes” which give little information about the causative relationships among variable. Instead of equation model with parameters in MLR method, the ANN offers a network graph with the weights to describe the relationship between dependent variable and explanatory variables. The Table A.7 summarized the layer's weights and biases constant values of built ANN model, which had given a higher R and lower RMSE values.
Table 2 reports the computed statistical indicators for all dataset types employing in MLR and ANN analysis. As can be seen from the table, firstly for training dataset, a value upper than 0.70 of Rtrain for obtained models is noted, which implies a good linear relationship between experimental and predicted IE for training dataset, especially in the ANN model case (Rtrain = 0.89). Further, the RMSEtrain of the MLR is great than that of the ANN, indicating the good predictive performance of the ANN constricted model against MLR model. Secondly, for test dataset, the comparison between the correlation coefficient (Rtest) of the MLR and the ANN based models, has shown a similar linear correlation between experimental and predicted IE values by employing linear and non-linear modeling methods. However, it is clear that the value of RMSEtest for ANN model is lower than that for MLR model, indicating a lower difference between observed and predicted IE by ANN. In order to get a whole vision on the performance of built models, the Rall and RMSEall were calculated on the total dataset. The obtained values showed that the ANN model reproduced better the experimental data with lower error than that of MLR model. Graphically, the Fig. 7(a,c) display the plots of experimental IE values against corresponding predicted values using MLR and ANN based models, respectively. The associated models residual is presented in Fig. 7(b,d). These plots show that the predicted IE values by non-linear model matching more to experimental values than that of the linear model. This finding confirmed that the inhibition of corrosion is more a non-linear phenomenon. For this purpose, the ANN model will be used in the next step to predict the inhibition efficiency of new designed α-amino acids derivatives for copper corrosion in acidic medium.
Methods
Training set
Validation set
Test set
Full dataset
Rtrain
RMSEtrain
Rvalidation
RMSEvalidation
Rtest
RMSEtest
Rall
RMSEall
MLR
0.79
15
–
–
1.00
12
0.80
15
ANN
0.89
12
1.00
9
1.00
8
0.90
11
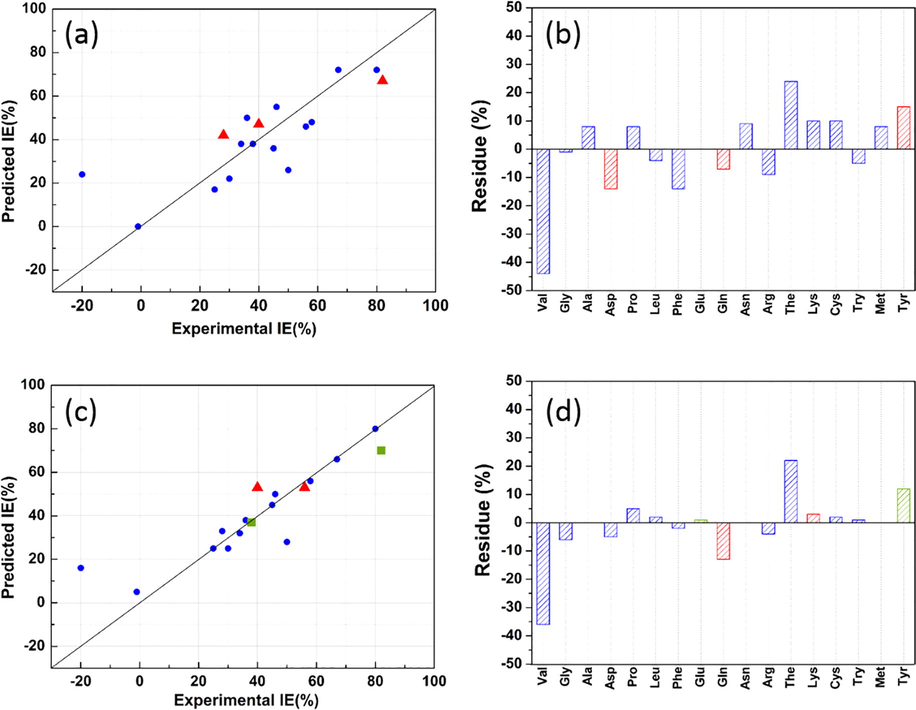
(a,c) Plot of predicted versus experimental IE values for training (
 ), validation (
 ) and test (
 ) datasets and (b,d) corresponding residues values calculated by employing MLR and ANN models.
3.3 Novel designed derivatives
One of the most used local descriptor to understand the suitable interaction center(s) on an inhibitor molecule with the metal surface is the atomic charges (Gece, 2008). There is a common agreement that more a site is charged negatively is its capacity to adsorb into the metal surface, via a donor-acceptor interaction (Obot et al., 2015). The calculated atomic natural charges of some investigated compounds in the aqueous phase are collected in Table A.8. It was found that nitrogen atom bonded to α-carbon has the highest negative charge in all investigated amino acids, except N atom of the second amine group and of primary ketamine function in Lys and Arg, respectively. Also, the oxygen atoms of carboxylic function have shown a great negative charge, while its carbon atom has a positive charge. Furthermore, it is showed that the substitution of H atom of thiol function in Cys by methyl group leads to amplifying the negative charge on the sulfur atom in Met, due to inductive donor effect. However, for protonated compounds, the negative charge on atom have reduced, in particularly on nitrogen atom directly connected to α-carbon. This is noteworthy noted by comparing the TNCNBO of neutral and protonated amino acids. On the other hand, this can improve the ability of carbonyl group including the side-chain to interact more with metal surface than protonated amine group, and hence the adsorption mode. The same trend has noted previously on the adsorption configuration obtained by MM-Monte Carlo simulations.
Recently, the use of electrostatic potential (ESP) map to understand the reactive center of inhibitor molecules has attracted the attention of several searchers (Kovačević and Kokalj, 2011). In Fig. 8, ESP maps of some neutral and protonated amino acids are presented (for other compounds see Fig. A.3). As shown, for all studied neutral amino acids, the region of negative electrostatic potential (electron rich region) is located on carboxyl and amine groups bonded to α-carbon. Further, on the rest of molecule skeleton, the electrostatic map was depended to the size, shape and chemical properties of the side chain. However, as protonated amino acids charged positively, a positive ESP contour has distributed on the whole molecule structure. Nevertheless, a region of small negative potential is located on sp2(O) and sp3(O) atoms for (Gln–H)+ and (Tyr–H)+ molecules, respectively.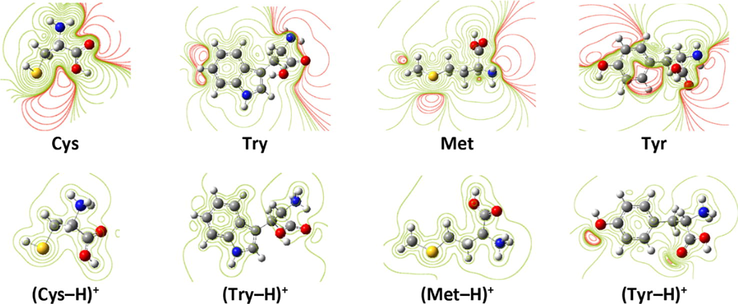
ESP of selected amino acids in neutral and protonated forms. Regions of negative (positive) potential are red (green).
The HOMO and LUMO orbitals are plotted in Fig. 9 of four selected amino acids at neutral and protonated states in the aqueous phase (for the rest of compounds, see Fig. A.4). For molecules with an aromatic ring, namely: Phe, Try and Tyr, the HOMOs were spread throughout the whole ring including the amine group, and theirs LUMOs were located only on the aromatic ring. For the molecules with a sulfur atom (i.e. Cys and Met) its HOMO was focused on the sulfur-containing group, and its LUMO type orbital on carboxyl group and a small part on amine group. The main distribution of HOMO in Arg and Lys molecules were located in guanidine and the second amine group, respectively. Whereas LUMO on carboxyl and amine groups bonding at α-carbon. On the other hand, passing from Glu to Gln molecule, the effect of changing of hydroxyl by amine group has reduced the location of frontiers molecular orbitals. However, for the rest of amino acids, the HOMOs were concentrated on amine group, which attached in α-carbon, while for LUMOs on carboxyl group. As seen from those figures for protonated amino acids, excluding (Ala–H)+, (Leu–H)+, (The–H)+ and (Lys–2H)2+, the protonated amine group (connected to α-carbon) has not shown any distribution of HOMO or LUMO orbitals, and consequently a probable absence of interaction between the later and metal surface. This can explain and confirm our previous findings about the adsorption configuration obtained by MM-Monte Carlo simulations. However, carboxyl group was contributed both in HOMO and LUMO for protonated compounds, except (Arg–H)+, (Cys–H)+, (Try–H)+, (Met–H)+ and (Tyr–H)+. More inspection of those molecular orbitals reveals, in one hand, that the protonation process has changed their shapes. On the other hand, the presence of electron donating substituent such sulfur, oxygen and nitrogen-containing groups with aromatic ring constituted the suitable sites for binding to the metal surface.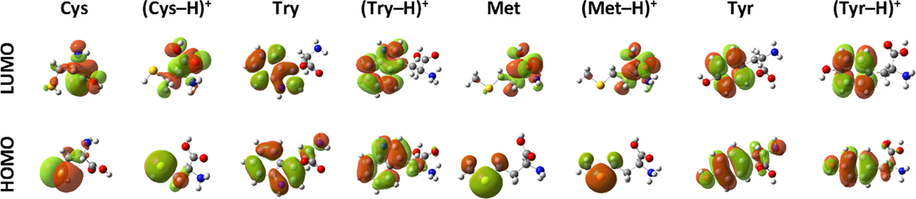
HOMO and LUMO orbitals of selected amino acids.
Following to above findings and using Tyr as core molecule skeleton, which exhibited the highest inhibition efficiency (IEexp = 82%) among investigated biomolecules, a series of ten new compounds were designed (Fig. 10). In this series of molecules, the hydroxyl, amine and thiol functional groups were used. Firstly, the hydroxyl group in Tyr was substituted successively by –NH2, –SH and –SCH3 groups (Para(X) derivatives). Secondly, one hydrogen atom in Meta position on aromatic ring was substituted by –OH, –NH2, –SH, and –SCH3 groups (Tyr-Meta(X) derivatives). Finally, the hydrogen atoms in the two Meta positions was substituted by the same group, i.e.: —OH, —NH2 or —SH (Tyr-Bi Meta(X/X) derivatives). All those molecules were studied by employing the same computation conditions as used previously. Table A.9 collects the calculated descriptors of designed derivatives. Table 3 presents the predicted IE values of the newly designed compounds. As can be noted, all the new designed amino acids molecules exhibited the ability to inhibit the corrosion, where the predicted IE varied from 17% to 85%. Further, the new compounds with thiol groups in Para, Meta and Bi Meta-position (i.e. Para(SH), Para(SCH3), Tyr-Meta(SH), Tyr-Meta(SCH3) and Tyr-Bi Meta(SH/SH)) showed a great inhibition efficiency to its of Tyr (i.e. Para(OH)), like: Para(SH) compound with 85% as inhibition efficiency. In the same way, the Tyr-Meta(OH) and Tyr-Bi Meta(OH/OH) derivatives have shown a good ability to prevent the corrosion. However, a remarkable reduction in the predicted inhibition efficiency was noted for the compounds that the amine group is incorporated. For example, the IEpred of Tyr-Meta(SH) is reduced by half regarding its of Tyr-Meta(NH2). As discussed in the previous sections, this can be attributed to the effect of protonation process on the electronic and structural properties of those compounds, and consequently their interaction with the metal surface, which reflects on their inhibition.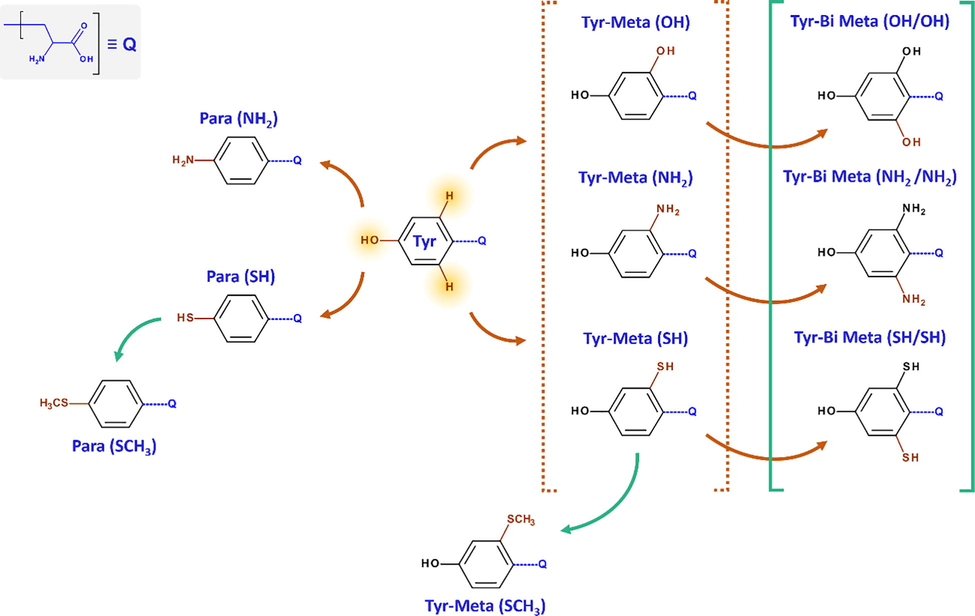
Molecular structures of the new designed Tyr derivatives.
Para(X)
IEpred (%)
Tyr-Meta(X)
IEpred (%)
Tyr-Bi Meta(X/X)
IEpred (%)
Tyr = Para(OH)
70
Tyr-Meta(OH)
83
Tyr-Bi Meta(OH/OH)
79
Para(NH2)
45
Tyr-Meta(NH2)
39
Tyr-Bi Meta(NH2/NH2)
17
Para(SH)
85
Tyr-Meta(SH)
83
Tyr-Bi Meta(SH/SH)
78
Para(SCH3)
83
Tyr-Meta(SCH3)
78
4 Conclusions
By employing the simple linear regression method, a preliminary study on the relationship between calculated global reactivity indicators and the IE was conducted. It showed that the calculated indicators in the aqueous phase (for both neutral and protonated forms) were correlated more to the IE than their corresponding in vacuum phase. Further, this stage of the study was exhibited that the protonation process has affected the reactivity of investigated compounds. Despite that, simple linear regression remains insufficient to describe greatly the observed inhibition behaviors. For this reason, the accurate mathematical methods, namely: MLR and ANN, were applied. Following all steps of the QSPR modeling process two models were constructed using four descriptors: χ(N), ELUMO(P), ΔN(P) and TNCNBO(P). Through calculated statistical parameters, the comparison between constructed models proves that the ANN provided better results, which indicates that the corrosion inhibition is mainly a non-linear phenomenon. Thereafter, by analysis of local reactivity indicators, Para(SH) was suggested as new efficient inhibitor for copper corrosion in acidic medium.
References
- Some amino acids as corrosion inhibitors for copper in nitric acid solution. Mater. Lett.. 2008;62:3325-3327.
- [Google Scholar]
- Amino acids as corrosion inhibitors for copper in nitric acid medium: experimental and theoretical study. J. Mater. Environ. Sci.. 2014;5(2):456-463.
- [Google Scholar]
- Tryptophan as copper corrosion inhibitor in 1M nitric acid solution. J. Chem. Biol. Phys. Sci.. 2014;4(4):3140-3155.
- [Google Scholar]
- Inhibition of corrosion of copper in nitric acid solution by four amino acids. Res. Chem. Intermed.. 2013;40:991-1002.
- [Google Scholar]
- The inhibited effect of Cysteine towards the corrosion of copper in nitric acid solution. Open Corrosion J.. 2010;3:58-63.
- [Google Scholar]
- Amino acids and their derivatives as corrosion inhibitors for metals and alloys. Arab. J. Chem. 2017
- [Google Scholar]
- Computational study of some triazole derivatives (un- and protonated forms) and their copper complexes in corrosion inhibition process. J. Mol. Struct.. 2016;1125:93-102.
- [Google Scholar]
- Trizolic compounds as corrosion inhibitors for copper in hydrochloric acid. Pigment. Resin Technol.. 2007;36(3):161-168.
- [Google Scholar]
- New Backpropagation Algorithm with Type-2 Fuzzy Weights for Neural Networks. Springer International Publishing; 2016.
- The use of quantum chemical methods in corrosion inhibitor studies. Corros. Sci.. 2008;50(11):2981-2992.
- [Google Scholar]
- Quantum chemical studies of some amino acids on the corrosion of cobalt in sulfuric acid solution. Mater. Corros.. 2010;61(2):141-146.
- [Google Scholar]
- Theoretical challenges in understanding the inhibition mechanism of copper corrosion in acid media in the presence of three triazole derivatives. RSC Adv.. 2014;4:41956-41967.
- [Google Scholar]
- Chitosan as an eco-friendly inhibitor for copper corrosion in acidic medium: protocol and characterization. Cellulose. 2017;24:3843-3867.
- [Google Scholar]
- Computational study of some amino acid derivatives as potential corrosion inhibitors for different metal surfaces and in different media. Int. J. Electrochem. Sci.. 2013;8:10839-10850.
- [Google Scholar]
- Quantum chemical and molecular dynamic simulation studies for the prediction of inhibition efficiencies of some piperidine derivatives on the corrosion of iron. J. Taiwan Inst. Chem. Eng.. 2016;65:522-529.
- [Google Scholar]
- Determination of corrosion inhibition effects of amino acids: quantum chemical and molecular dynamic simulation study. J. Taiwan Inst. Chem. Eng.. 2016;58:528-535.
- [Google Scholar]
- Analysis of molecular electronic structure of imidazole- and benzimidazole-based inhibitors: a simple recipe for qualitative estimation of chemical hardness. Corros. Sci.. 2011;53(3):909-921.
- [Google Scholar]
- Density functional theory (DFT) as a powerful tool for designing new organic corrosion inhibitors. Part 1: an overview. Corros. Sci.. 2015;99:1-30.
- [Google Scholar]
- Green Corrosion Inhibitors: Theory and Practice. John Wiley & Sons Ltd; 2011.
- Quantitative structure–activity relationship model for amino acids as corrosion inhibitors based on the support vector machine and molecular design. Corros. Sci.. 2014;83:261-271.
- [Google Scholar]
Appendix A
Supplementary data
Supplementary data associated with this article can be found, in the online version, at https://doi.org/10.1016/j.jksus.2018.04.004.
Appendix A
Supplementary data


