

Translate this page into:
The potential effect of Tubulysin A on autophagy in a group of cancer cell lines
⁎Corresponding author. lamya.alsadhan@gmail.com (Lamya Alsadhan),
-
Received: ,
Accepted: ,
This article was originally published by Elsevier and was migrated to Scientific Scholar after the change of Publisher.
Abstract
Cancer continues to be a prominent global threat, and current chemotherapy options often involve tubulin-targeting compounds disrupting microtubule function. Autophagy's role in cancer varies across cell types, tumor stages, and carcinogenic stimuli. Recent attention has focused on autophagy as a response to antimitotic drugs. Our study spotlights TubA, a myxobacteria-derived peptide with potent antimitotic properties, demonstrating notable antiproliferative effects on diverse cancer cell lines at low concentrations. Remarkably, TubA proved more effective than TubB, another myxobacterial compound. In MCF-7 cells, TubA induced autophagy, increasing LC3-I lipidation to LC3-II and enhancing lysosomal activity and acidity. Intriguingly, TubA triggered an intrinsic apoptotic pathway mediated by autophagy, evidenced by increased cathepsin B activity, cytosolic leakage, and subsequent apoptosis through cytochrome c release. In summary, our findings indicate that TubA promotes cell death via cytotoxic autophagic activity in the MCF-7 cancer cell line.
Keywords
Tubulysin A
Autophagy
Autophagic flux
Apoptosis
Caspase-3
Microtubules
CathepsinB

1 Introduction:
Cancer mortality globally has increased due to disparities in healthcare access, socio-economic inequities, and medical infrastructure limitations, affecting millions of individuals annually. (Hanahan, 2022). Latest data reveals that there are more than 19.3 million new instances of cancer reported worldwide (Ferlay et al., 2021). The escalating cancer incidence underscores the urgent need for potent pharmaceuticals to address the diverse forms of this disease (Desai et al., 2022). In 2020, Saudi Arabia recorded 27,885 new cancer diagnoses and 13,069 cancer-related fatalities (WHO, 2020). Breast, colorectal, and prostate cancers ranked as the greatest frequent malignancies observed (Almutlaq et al., 2017).
Despite advances in anticancer drug discovery (Bray et al., 2018), current cancer treatments face challenges because of several drug resistance and serious adverse effects. Although the FDA approves new cancer treatments annually, the need persists for agents with lower toxic effects (Hawash, 2022; Heptinstall et al., 2018). Antimitotic drugs disrupting microtubule function have proven effective in cancer chemotherapy. Nevertheless, both clinical and basic research face persistent challenges, including issues such as cytotoxicity to non-tumorigenic cells and the emergence of multiple resistances in cancer cases (Hawash, 2019).
Tubulysin A, a peptide with unusual amino acids and a central thiazole heterocycle, was first isolated from the myxobacterial species Archangium geophyra through fermentation (Sasse et al., 2000). Examinations have delved into its influence on microtubules, both at the biochemical and cellular levels. In vitro, it hinders the polymerization of purified tubulin (Steinmetz et al., 2004). It unveiled a disruption in the microtubule networks over time in diverse cancer cell lines, resulting in apoptosis after a G2/M cell cycle arrest (Hamel, 2002; Sasse et al., 2000).
Autophagy serves as a pivotal adaptive pathway for cellular survival during stress conditions, orchestrating the capture, degradation, and subsequent recycling of intracellular proteins and organelles. Under stress, the cellular self-preservation mechanism of autophagy enacts the targeted delivery and enzymatic dismantling of cytoplasmic constituents within lysosomes, generating reusable building blocks to maintain cellular homeostasis (Rogov et al., 2014). Additionally, it eliminates damaged cellular elements, promoting overall cellular health (Li et al., 2020). Autophagy presents a multifaceted role in cancer, displaying the capacity to both impede and foster cell proliferation and tumorigenesis under varying circumstances. In certain cases, the commencement of autophagy emerges as a pivotal player in the elimination of tumor cells. It operates independently or serves as a precursor to apoptosis, recognized as cytotoxic autophagy. This intricate process underscores autophagy's dual functionality, not only directly eliminating cancer cells but also orchestrating the subsequent initiation of apoptosis. (Xu et al., 2022). The impact of autophagy on cancerous cells varies, with its effects influenced by factors such as cell types, the stage of tumorigenesis, and carcinogenic stimuli. Furthermore, there has been a recent increase in interest regarding the involvement of autophagy in response to antimitotic drugs (van Vuuren et al., 2015).
This study investigates the impact of Tubulysin A on autophagy in MCF-7 breast cancer cells. Autophagy is assessed by measuring LC3-I to LC3-II conversion using western blotting and detecting autophagic flux. The study aims to understand how TubA affects lysosomal activity and its potential role in inducing cell death. The goal is to develop a novel cancer therapeutic strategy by combining TubA with enhanced autophagy to increase effectiveness.
2 Materials and Methods
2.1 Synthetic compound
Tubulysin A (TubA) and Tubulysin B (TubB) Fig. 1 were a generous gift from Dr. Wolfgang Richter – Tube Pharmaceuticals GmbH, Vienna, Austria. Chloroquine diphosphate salt (CQ)Fig. 3 was purchased from Sigma-Aldrich (St. Louis, MO, USA).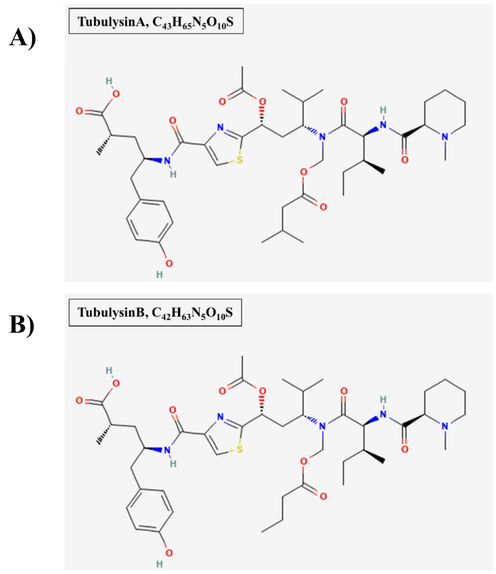
A) The Chemical structure of TubA (Information, 2024a). B) The Chemical structure of TubB (Information, 2024b).
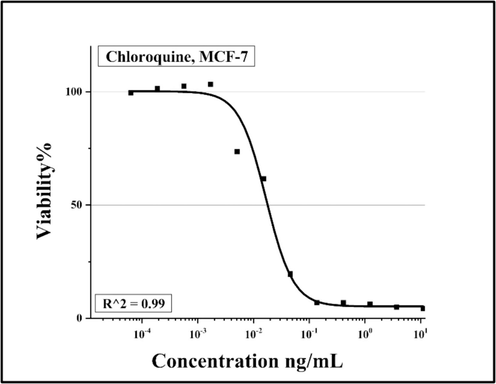
Concentration-dependent growth inhibition of MCF-7 cell line by CQ. The calculated IC50 value of each cell line is given in the graph. R2 is the proportion of the variation.
2.2 Cell culture
Cell lines were acquired from the German Collection of Microorganisms and Cell Cultures (Deutsche Sammlung für Mikroorganismen und Zellkulturen, DSMZ) and the American Type Culture Collection (ATCC). The depositors' recommended culture conditions were adhered to when cultivating the cell lines. Fetal bovine serum (FBS) and culture media were purchased from GIBCO (Invitrogen). NEST (CA, USA) provided plasticware.
2.3 Cell viability assay
The study evaluated cell growth inhibition using a 96-well plate format. Cell suspension was seeded into wells with TubA alone, and methanol as a negative control. After four days, cell proliferation was quantified using the MTT assay adhering to the protocol described by (Elnakady et al., 2004).
2.4 Immunofluorescence staining of microtubules.
Following treatment with TubA at defined concentrations and durations, MCF-7 cells cultured on 12-mm glass coverslips in four-well plates were fixed with a 1:1 cold acetone-methanol and stained with anti-tubulin antibodies (Sigma) and Alexa Fluor 488-conjugated goat anti-mouse IgG secondary antibody (Invitrogen). Nuclei were visualized by DAPI staining. Images were taken using a ZEISS LSM 800 confocal microscope. (Elnakady et al., 2004).
2.5 Measurement of autophagic flux of LC3-I/LC3-II by western blotting
Cells were treated with TubA alone and a combination of CQ and TubA at 24 and 48-hour time points (Chikte et al., 2014). Cell lysis was performed following a previously established protocol (Hussain et al., 2007). Proteins (20 µg/well) were separated by SDS-PAGE using 4–15 % Mini-PROTEAN TGX Precast Protein Gels. The separated proteins were transferred to a PVDF membrane using the Trans-Blot Turbo Transfer System (Bio-Rad). Immunoblotting was performed using an anti-LC3-II polyclonal rabbit antibody (1:1000; Abcam) and a mouse monoclonal actin antibody (1:5000; loading control, Santa Cruz). The samples were visualized using Alexa fluor 647 secondary antibodies and the ChemiDoc XRS System Imaging system from Bio-Rad Laboratories, CA.
2.6 Lysosomal functions:
2.6.1 LTR staining and lysosomal pH
Lysosomal quantity and acidity were assessed using LysoTracker Red DND-99 (LTR) and LysoSensor Yellow/Blue DND-160 dye (LSR). MCF-7 cells were cultured on glass coverslips in a 24-well plate. After overnight incubation, cells were treated with TubA (0.23 nM) at 24 and 48-hour time points. CQ (37.5 nM) and Methanol served as positive and negative controls, respectively. Cells were stained with LTR (60 nM) or LSR dye (3 μM) following the manufacturer's protocol (Thermo Fisher Scientific, Carlsbad, CA). Fluorescence images were captured using a Zeiss axio observer confocal fluorescence microscope (Carl Zeiss AG, Oberkochen, Germany).
2.6.2 Lysosomal cathepsin enzyme activity
MCF-7 cells were seeded onto coverslips in 4-well plates and treated with TubA (0.23 nM) at 24 and 48-hour time points. CQ (37.5 nM) and Methanol served as positive and negative controls. Cells were incubated with Magic Red Cathepsin B Substrate and Hoechst 33342 for nuclear counterstaining. Fluorescence images were captured using a ZEISS LSM 800 confocal microscope (Carl Zeiss AG, Oberkochen, Germany).
2.6.3 Statistical analysis
Results were presented as mean values accompanied by their corresponding standard deviations (SDs). Statistical differences between groups were evaluated using a paired Student's t-test. A p-value ≤ 0.05 was considered statistically significant, indicating a statistically relevant difference between the compared groups.
3 Results
3.1 TubA inhibits the growth of cancer cell lines in a concentration-dependent manner
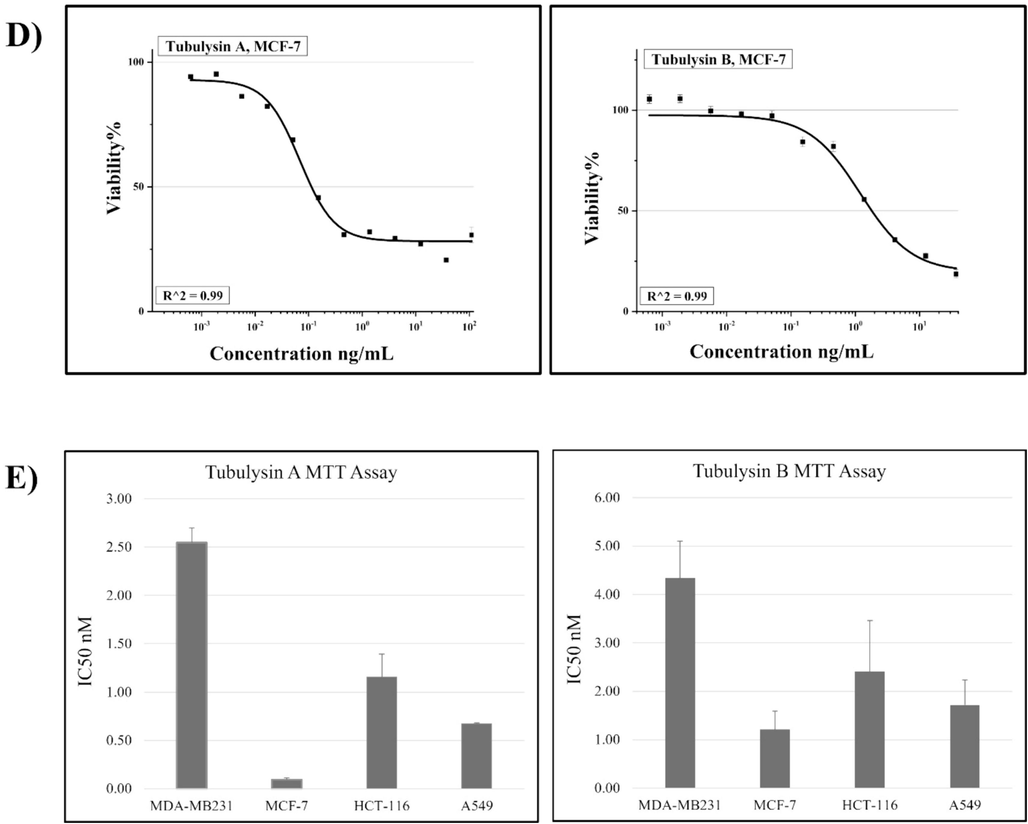
The antiproliferative effects of TubA and TubB were compared in four human cancer cell lines: A549, HCT-116, MDA-MB231, and MCF-7Fig. 2. Both compounds exhibited potent inhibition of cancer cell growth at low nanomolar concentrations. MCF-7 was the most sensitive to TubA, with an IC50 of 0.09 nM, while MDA-MB231 was the least sensitive, with an IC50 of 2.55 nM. TubA showed higher efficacy than TubB, with MCF-7 cells being 20-fold more sensitive Table 1. Overall, TubA demonstrated broad-spectrum antiproliferative potential and potential superiority over TubB in treating various cancer types.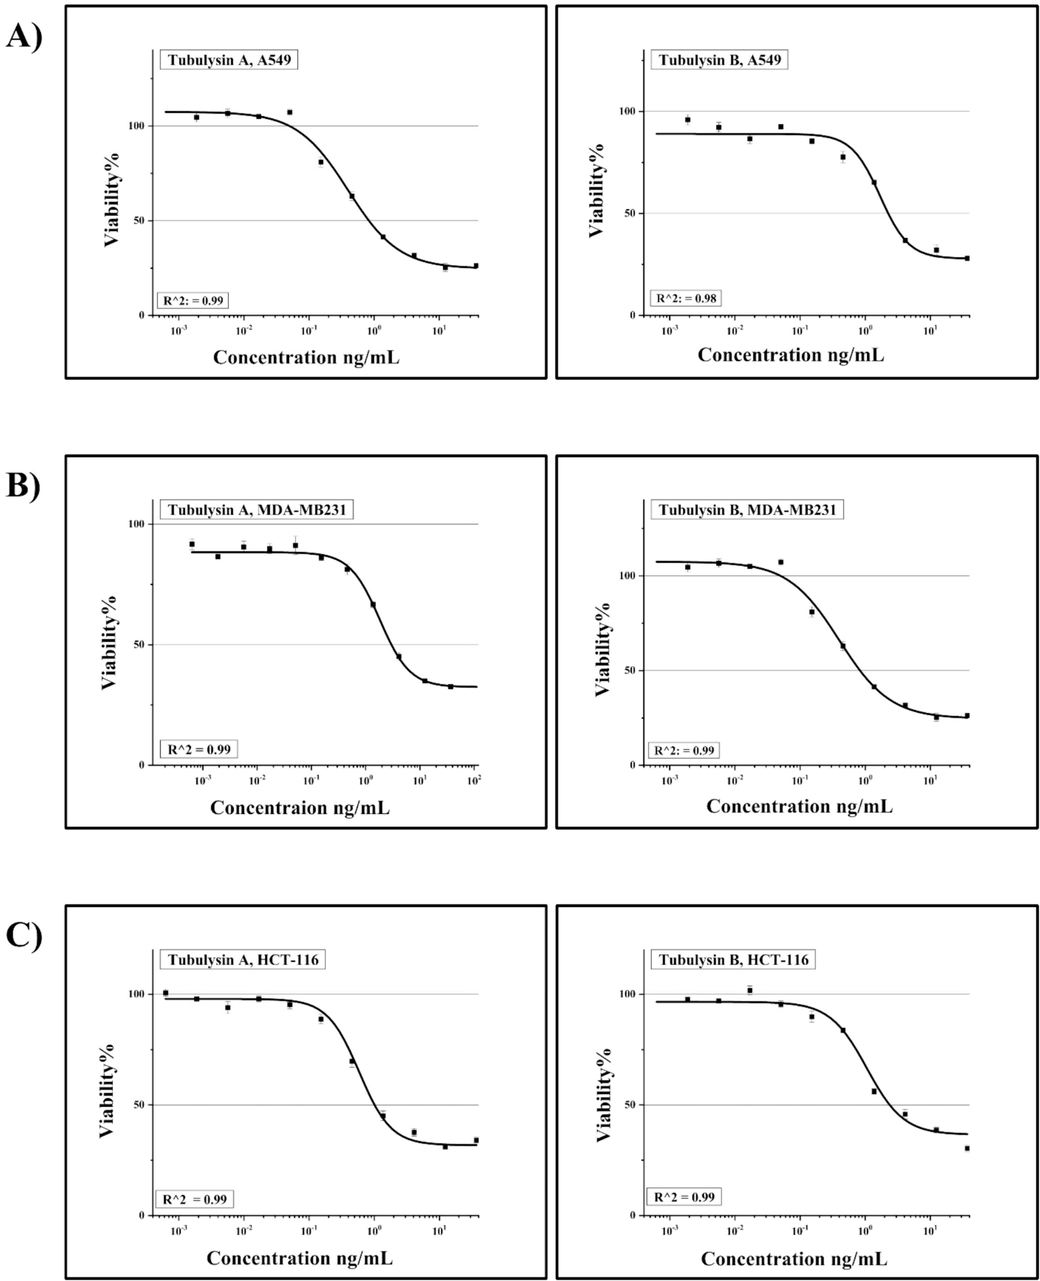
Concentration-dependent growth inhibition of: A) A549, B) MDA-MB231, C) HCT-116 and D) MCF-7 cell lines by TubA & B. R2 is the proportion of the variation. E) Represents a comparison between the value of the IC50 in tested cell lines.
Concentration-dependent growth inhibition of: A) A549, B) MDA-MB231, C) HCT-116 and D) MCF-7 cell lines by TubA & B. R2 is the proportion of the variation. E) Represents a comparison between the value of the IC50 in tested cell lines.
Cell lines (Human)
Cell type
TubA (IC50 value nM)
TubB (IC50 value nM)
HCT-116
Colon carcinoma
1.16 (±0.03)
2.41 (±1.01)
A549
Lung Carcinoma
0.67 (±0.01)
2.07 (±0.5)
MCF-7
Breast Carcinoma
0.09 (±0.02)
1.72 (±0.4)
MDA – MB231
Breast Carcinoma
2.55 (±0.1)
4.33 (±0.7)
3.2 Microtubules architecture post TubA and CQ treatment
MCF-7 cells were treated with TubA at a concentration of 0.45 nM for 24 and 48 h. Control and CQ-treated cells showed preserved cellular integrity (Fig. 4A and B). However, cells treated with a combination of CQ and TubA exhibited mild microtubule depletion and changes in morphology, especially with longer incubation times (Fig. 4C and E). TubA-treated cells showed significant alterations in both microtubule organization and nuclear morphology, with disrupted filaments and fragmented appearance (Fig. 4D and 4F). The effects worsened with longer incubation times, indicating a progressive and dose-dependent impact. TubA also disrupted mitotic spindles, affecting chromosomal segregation during mitosis, and this effect increased with longer incubation times.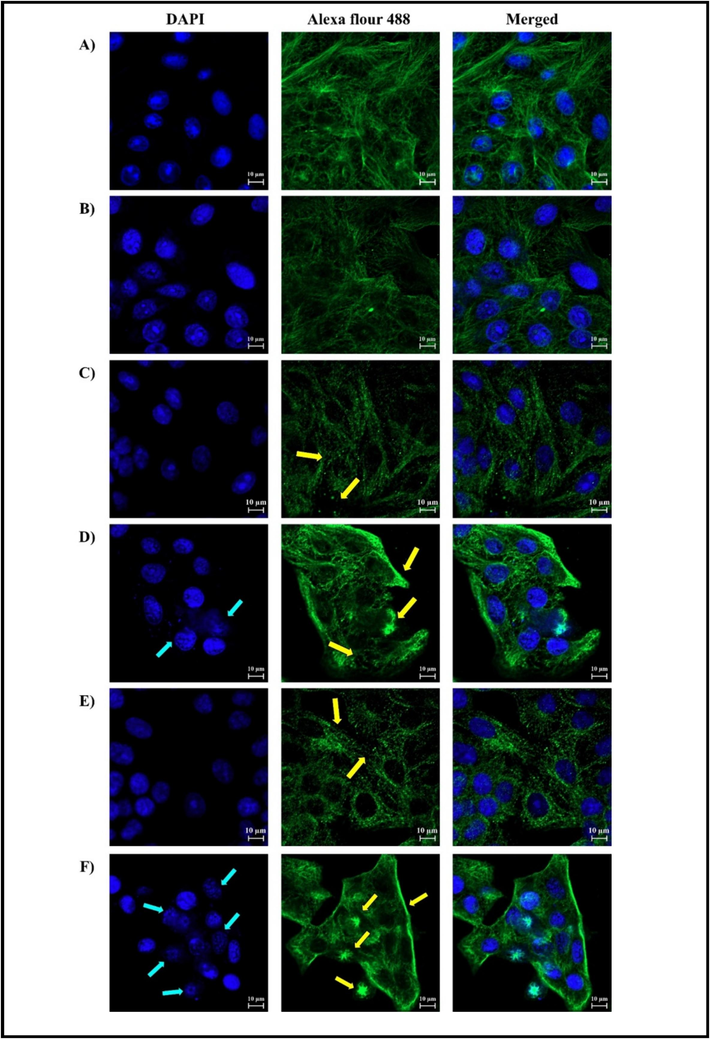
MCF-7 cells were examined by immunofluorescence confocal microscopy (scale bar is at 10 µm). A) represents control (MeoH), B) represents CQ as a positive control, C) and E) represents treatment with CQ + TubA for 24 and 48 h, respectively. The yellow arrows point to the microtubules. D) and F) represents treatment with TubA for 24 and 48 h, respectively. Blue arrows point to the nuclei, while the yellow ones point to the microtubules.
3.3 LC3-I/LC3-II conversion
MCF-7 cells were treated with different compounds for 24 and 48 h. Methanol-treated cells (control) and CQ-treated cells showed low autophagic activity, as indicated by higher LC3-I expression compared to LC3-II and a low LC3-I/LC3-II conversion ratio (Fig. 5). The combination of CQ and TubA significantly increased the conversion ratio, suggesting enhanced autophagic flux. TubA alone also increased the conversion ratio, but to a lesser extent than the combination treatment. Longer incubation times resulted in higher LC3-I to LC3-II conversion in the TubA-treated group (Fig. 5).
A) The impact of TubA and CQ on LC3-I/LC3-II conversion and autophagic flux in MCF-7 cells was evaluated by western blotting analysis. The results shown were derived from three biological experiments. B) and C) show a comparison between the control group and TubA. Also, it shows a comparison between the combined treatment group of TubA and CQ (CQ + TubA) and TubA group. D) Represents a comparison between the different time points (24H and 48H) in the groups treated by TubA. The error bars show the standard deviation (mean ± SD). Statistical analysis was performed using one way-ANOVA. *: p ≤ 0.05, **: p ≤ 0.01, ***: p ≤ 0.001.
LC3-II expression remained unchanged in the control and CQ-treated groups, indicating minimal autophagic activity (Fig. 6). In contrast, the combination treatment and TubA-only group showed significant increases in LC3-II levels. The combination treatment led to a notable rise in LC3-II expression, while the TubA-only group exhibited a marked increase but less than the combination group.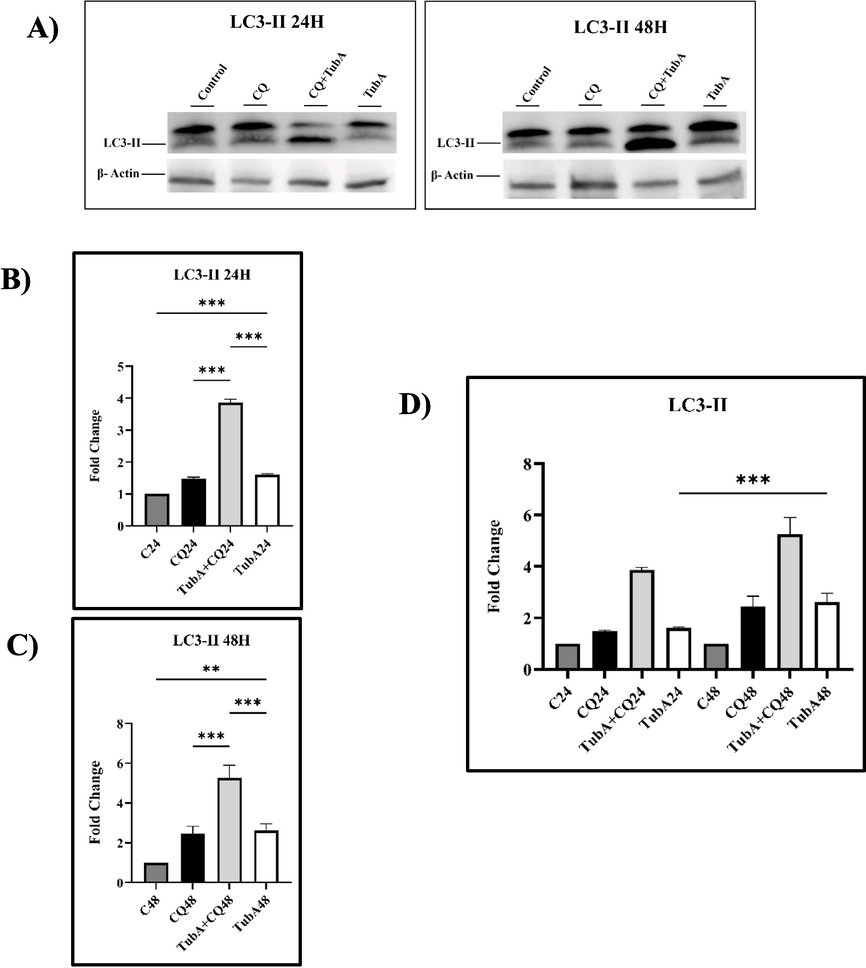
A) Expression of LC3-II protein treated by TubA and CQ treatment in MCF-7 cell line. The results shown were derived from three biological experiments. B) and C) show a comparison between the control and TubA. Also, it shows a comparison between the combined treatment of TubA and CQ (CQ + TubA) and TubA. D) represents a comparison between the different time points (24H and 48H) in the groups treated by TubA. The error bars show the standard deviation (mean ± SD). Statistical analysis was performed using one way-ANOVA. *: p ≤ 0.05, **: p ≤ 0.01, ***: p ≤ 0.001.
Overall, the combination of CQ and TubA enhanced autophagic flux, while TubA alone triggered autophagy. CQ inhibited LC3-II breakdown in lysosomes, leading to its accumulation. Longer incubation times increased autophagic activity in the TubA-treated group.
3.4 Lysosomal function
3.4.1 LTR staining
TubA-treated cells showed an increased number of lysosomes compared to the control group, indicating heightened lysosomal activity and upregulated autophagy. However, the addition of CQ reduced LTR uptake into lysosomes, suggesting that CQ alkalizes lysosomes, inhibiting autophagosome-lysosome fusion and reducing lysosomal activity (Fig. 7).
The Figure exhibits the effects of TubA and CQ on the lysosomal activity of MCF7 cells across two distinct time points (A) 24 h and B) 48 h). Lysotracker Red staining was replicated in three independent experiments (>6 images per well). C) Mean fluorescence intensity was statistically evaluated using one-way ANOVA. Statistical significance thresholds were established as *: p ≤ 0.05, **: p ≤ 0.01, and ***: p ≤ 0.001. Error bars represent standard deviation (mean ± SD).
3.4.2 Lysosomal pH
The fluorescence intensity of Lysosensor yellow staining decreased in the CQ group compared to the treated group, intensifying with longer incubation time (Fig. 8). This decrease is expected as CQ inhibits lysosomal protease activity. A significant difference was observed between the CQ group and the TubA-treated group, which became more prominent over time (Fig. 8). Fig. 8 also shows an increase in fluorescence intensity with prolonged incubation time in the treated groups, indicating enhanced lysosomal activity associated with heightened autophagic activity and increased fusion of autophagosomes with lysosomes.
The Figure exhibits the influence of TubA and CQ on the lysosomal pH of MCF7 cells at two distinct time points (A) 24 h and B) 48 h). Lysosensor staining was replicated in three independent experiments (>6 images/well). C) Mean fluorescence intensity was statistically evaluated using one-way ANOVA, with significance thresholds defined as *: p ≤ 0.05, **: p ≤ 0.01, and ***: p ≤ 0.001. Error bars represent standard deviation (mean ± SD).
3.4.3 Lysosomal cathepsin enzyme activity
The fluorescence intensity of the control and CQ groups showed no significant difference, indicating low lysosomal activity. In contrast, the treated groups displayed a substantial increase in Magic red intensity, indicating heightened cathepsin B activity. This suggests an escalation in lysosomal activity associated with increased autophagic activity. Additionally, the nuclei in the treated groups exhibited fragmentation and disruption, suggesting that TubA may have initiated an apoptotic cascade (Fig. 9).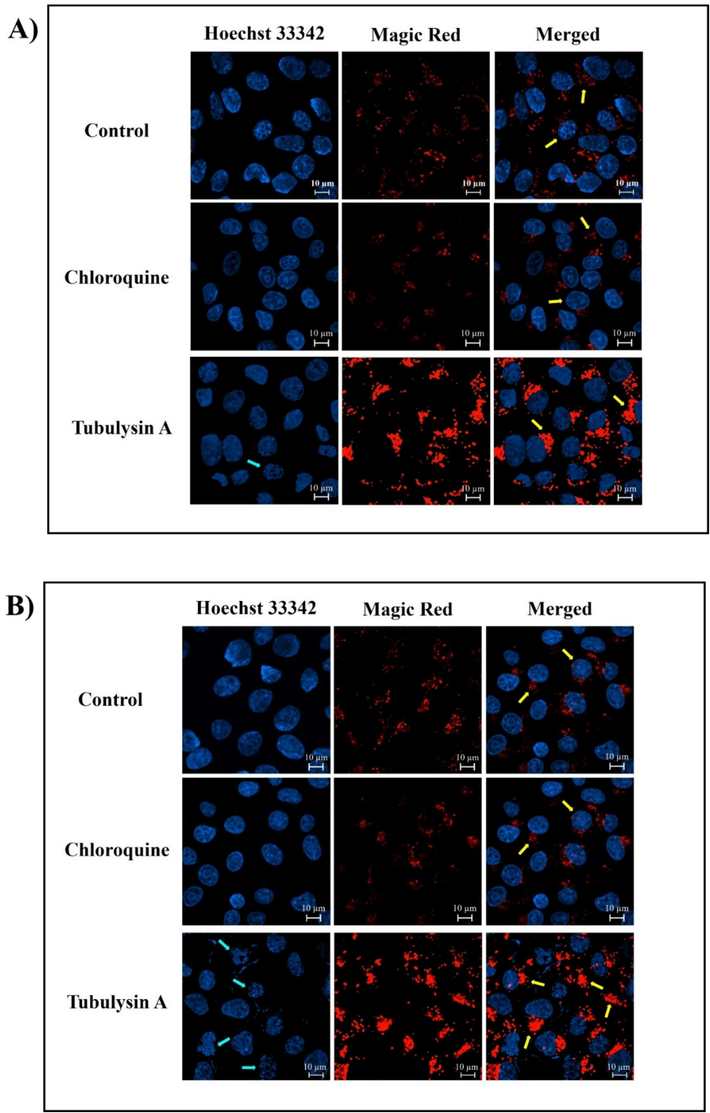
Effect of TubA and CQ on the activity of CathepsinB in the lysosomes of MCF-7 cell line at two distinct time points (A) 24 h and B) 48 h). The intensity of Magic Red Cathepsin B staining was quantified in three independent experiments (>6 images per well) C) Mean fluorescence intensity was statistically evaluated using one-way ANOVA, with significance thresholds defined as *: p ≤ 0.05, **: p ≤ 0.01, and ***: p ≤ 0.001. Error bars represent standard deviation (mean ± SD).
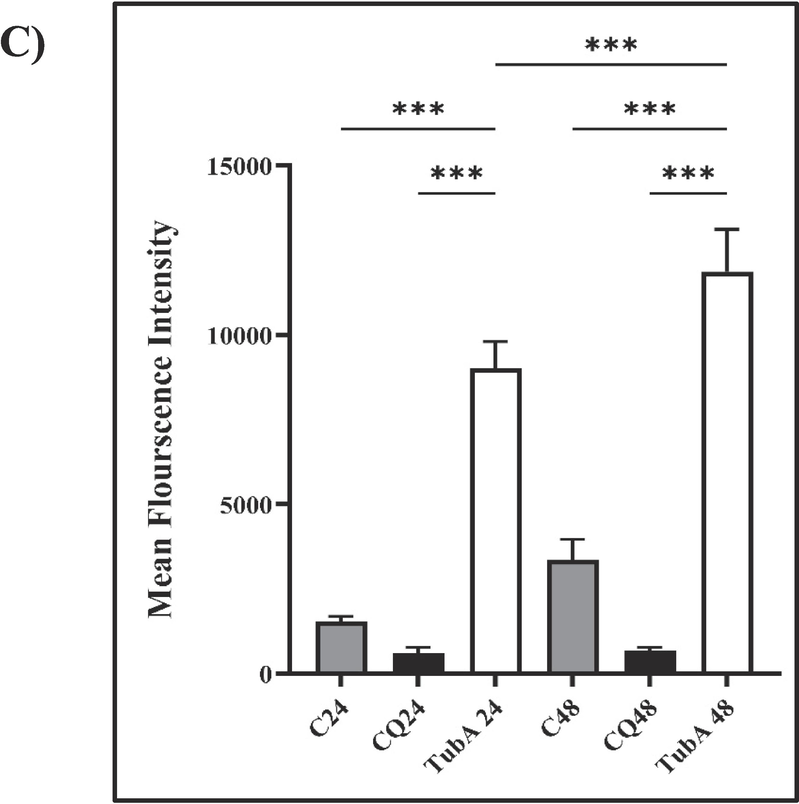
Effect of TubA and CQ on the activity of CathepsinB in the lysosomes of MCF-7 cell line at two distinct time points (A) 24 h and B) 48 h). The intensity of Magic Red Cathepsin B staining was quantified in three independent experiments (>6 images per well) C) Mean fluorescence intensity was statistically evaluated using one-way ANOVA, with significance thresholds defined as *: p ≤ 0.05, **: p ≤ 0.01, and ***: p ≤ 0.001. Error bars represent standard deviation (mean ± SD).
4 Discussion
Autophagy is a complex process involved in cellular demise, and its role in promoting cell death is still debated. One classification system, proposed by (Galluzzi et al., 2017), categorizes autophagy's functions into three types. Autophagy-associated cell death occurs when autophagy is induced alongside apoptosis or other cell death pathways. Autophagy-mediated cell death refers to a scenario where autophagy directly initiates apoptosis. Autophagy-dependent cell death is a regulated process that occurs independently of apoptosis or necrosis, relying on the autophagic machinery (Denton et al., 2015).
In this study, Tubulysin A, known for inducing apoptosis, was explored as an autophagy inducer. The focus was on autophagy-mediated cell death, where autophagy triggers apoptosis. CQ was used as an autophagic inhibitor to show that TubA wouldn't initiate cell death when combined with CQ, providing clearer results.
The tetrapeptides known as Tubulysins, which are derived from Myxobacteria, exhibit significant antiproliferative properties against various human cancer cell lines (Kaur et al., 2006; Sasse et al., 2000), Notably, Tubulysins demonstrated remarkable potency with IC50 values in the low nanomolar to picomolar range, effectively combating cancer cell clones that were resistant to numerous medications (Sasse et al., 2000; Steinmetz et al., 2004). Based on concentration-dependent effects, this study demonstrated that TubA inhibits the growth of different cancer cell lines. These outcomes are in line with earlier research on TubA's effects on cell division and growth. TubA outperformed TubB in a direct comparison using the MTT assay in terms of its cytotoxic activity against the tested cancer cell lines. TubA treatment significantly inhibited the growth of all tested cell lines, a noteworthy finding that suggests the drug's broad-spectrum antiproliferative potential. The results of this study suggest that TubA is a promising candidate for anticancer therapy and should be investigated further.
As reported previously, treatment of mammalian cells with TubA led to the depletion of microtubules within the cell and fragmentation of the nuclei which indicates that apoptosis is taking place (Khalil et al., 2006), similar findings were reported in this study as incubation of MCF-7 cell line with TubA for 24 and 48 h has caused depletion of microtubules and change in their morphology, Also it caused fragmentation and transforming the morphology of the nuclei into a ring shape (Fig. 4.F) which is an indicator of apoptosis, as reported by (Khalil et al., 2006). Interestingly, the combination of CQ and TubA appears to prevent TubA from causing apoptosis. These findings were consistent with (Wang et al., 2017) as autophagy inhibition by CQ resulted in a notably higher cell survival rate compared with treated cells. This result leads to the consideration of the pathway cell death is taken by TubA, as it is proved to be an apoptotic inducer in several cancer cell lines (Khalil et al., 2006; Sasse et al., 2000) and the inhibition of autophagy by CQ-promoted cell survival emphasizes on the idea that the cell death pathway is taking the autophagy-mediated cell death pathway, where the activation of autophagy instigates apoptosis.
Autophagy flux is often characterized as an evaluation of the autophagic system's ability to degrade cellular components. This process includes transporting autophagic substrates to the lysosome for degradation, and assessing autophagy flux is crucial for determining the efficiency of the autophagic process. As LC3 is specifically associated with both autophagosomes and autolysosomes, the levels of LC3 directly correspond to the number of autophagosomes, providing a direct indicator of autophagic activity.
LC3-II protein levels increased significantly in treated groups during prolonged incubation. However, as per (Tilija Pun et al., 2020), elevated LC3-II alone doesn't guarantee increased autophagic flux. Their study suggests using lysosomal protease inhibitors, like CQ, for a more nuanced understanding. If LC3-II rises with a compound and a protease inhibitor compared to the inhibitor alone, it indicates increased autophagosome formation. In our study, LC3-II increased in the CQ and TubA combination group compared to CQ alone.
Moreover, if LC3-II rises with a compound alone and further increases with CQ, it suggests the compound either promotes LC3-II synthesis, hinders degradation, or enhances autophagic flux (Tilija Pun et al., 2020). Our findings support this, with the TubA-treated group showing increased LC3-II expression, albeit less than the combination group, strongly suggesting enhanced autophagic flux.
As per (Mizushima & Yoshimori, 2007), elevated LC3-II indicates autophagosome buildup but not necessarily autophagic degradation. Our study aligns with this, where the ratio of LC3-I conversion to LC3-II significantly increased in the TubA alone group, though notably less than the combination group, indicating enhanced autophagic flux. The increase in the autophagic flux is consistent with the rate of cell death in the MCF-7 cell line, it is previously confirmed that TubA triggers caspase-dependent apoptosis (Khalil et al., 2006). In this study, the inhibition of autophagy using CQ increased the survival rate of the MCF-7 cell line, these findings were consistent with (Grandér et al., 2009) where LP-1 cell line upon treatment with dexamethasone for 24 and 48 h the cells underwent apoptosis by caspase-3 activation, also it increases autophagic flux by LC3-I conversion to LC3-II, which is a distinct marker of autophagy. Furthermore, treatment of lymphoblastic leukemia using obatoclax (Heidari et al., 2010) induced autophagic flux by LC3-I to LC3-II lipidation which triggered caspase-dependent apoptosis and cell death.
Lysosomes and autophagy work together in cellular maintenance. TubA treatment increases LTR dye accumulation, indicating heightened lysosomal activity and degradation (Iwai-Kanai et al., 2008). CQ treatment decreases LTR dye absorption, confirming its role as a lysosomal protease inhibitor (Iwai-Kanai et al., 2008; Seo et al., 2015). TubA-treated groups show increased fluorescence intensity with LysoSensor Yellow/Blue DND-160, indicating heightened lysosomal acidity (Chen et al., 2023). CQ treatment leads to decreased fluorescence intensity, indicating lysosomal alkalization. These results suggest increased lysosomal activity and autophagy in TubA-treated groups, consistent with previous findings in the MCF-7 cell line.
Cathepsins form a group of spherical proteases primarily found in the lysosome. Cathepsin B thrives in acidic conditions, particularly within vesicles, outperforming its activity at neutral pH (Patel et al., 2018). CQ disrupts the acidic environment in lysosomes, hindering the optimal activity of enzymes like cathepsin B (Tang et al., 2018), which explains the downregulation of cathepsin B that was shown in the result of this study.
Compared to CQ, TubA treatment increased cathepsin B activity in a time-dependent manner, indicating a potential role for cathepsin-dependent cytotoxic autophagy. Increased cathepsin B expression triggers its lysosomal escape, leading to apoptosis (Chwieralski et al., 2006). These findings were consistent with (Han et al., 2017), where it demonstrated findings indicate that Vorinostat stimulates cytotoxic autophagy through Cathepsin B activation in cutaneous T-cell lymphoma. Inhibition of Cathepsin B in breast cancer cells exposed to Vorinostat reduces apoptosis and enhances cell survival, highlighting its involvement in the drug's cytotoxic effects.
In conclusion
TubA strongly inhibits the proliferation of human carcinoma cells, including MCF-7, at low nanomolar concentrations. It induces cell death through autophagy, which leads to apoptosis. Blocking autophagy with CQ prevents cell death. TubA not only triggers apoptosis through caspase-3 cleavage but also induces persistent autophagic flux. Increased expression of Cathepsin B suggests activation of the intrinsic apoptotic pathway, leading to Cytochrome C release from mitochondria and initiation of intrinsic apoptosis.
Understanding Tubulysin A's mechanism of autophagy induction is crucial to fully harness its therapeutic potential in vitro and in vivo.
Funding
This research was funded by the Researchers Supporting Project (RSP-2024/214), King Saud University, Riyadh, Saudi Arabia.
CRediT authorship contribution statement
Lamya Alsadhan: Writing – original draft, Visualization, Software, Methodology, Investigation, Formal analysis, Data curation. Yasser A. Elnakady: Writing – review & editing, Supervision, Formal analysis, Conceptualization. Badr A. Aldahmash: Writing – review & editing, Conceptualization. Aisha Alqarni: Methodology. Layali M. Almutairi: Methodology. Mansour I. Almansour: Methodology. Ahmed Rady: Methodology.
Declaration of competing interest
The authors declare that they have no known competing financial interests or personal relationships that could have appeared to influence the work reported in this paper.
References
- Almutlaq, B.A., Almuazzi, R.F., Almuhayfir, A.A., Alfouzan, A.M., Alshammari, B.T., AlAnzi, H.S., Ahmed, H.G. J. J. O. C. P., 2017. Breast cancer in Saudi Arabia and its possible risk factors. 12, 83-89.
- Bray, F., Ferlay, J., Soerjomataram, I., Siegel, R. L., Torre, L. A., Jemal, A. J. C. a. c. j. f. c. (2018). Global cancer statistics 2018: GLOBOCAN estimates of incidence and mortality worldwide for 36 cancers in 185 countries. 68(6), 394-424.
- Lysosome-related exosome secretion mediated by the miR-26b/Rab31 pathway was associated with the proliferation and migration of MCF-7 cells treated with BPA. Ecotoxicol. Environ. Saf.. 2023;252:114563
- [Google Scholar]
- Use of LysoTracker dyes: a flow cytometric study of autophagy. Cytometry A. 2014;85(2):169-178.
- [Google Scholar]
- Desai, A., Scheckel, C., Jensen, C. J., Orme, J., Williams, C., Shah, N., Leventakos, K., & Adjei, A. A. J. J. N. O. (2022). Trends in Prices of Drugs Used to Treat Metastatic Non–Non-small cell Lung Cancer in the US From 2015 to 2020. 5(1), e2144923-e2144923.
- Disorazol A1, is a highly effective antimitotic agent acting on tubulin polymerization and inducing apoptosis in mammalian cells. Biochem. Pharmacol.. 2004;67(5):927-935.
- [Google Scholar]
- Molecular definitions of autophagy and related processes. EMBO J.. 2017;36(13):1811-1836.
- [Google Scholar]
- Autophagy as the main means of cytotoxicity by glucocorticoids in hematological malignancies. Autophagy. 2009;5(8):1198-1200.
- [Google Scholar]
- Hamel, E. J. P. S. O. R. o. B. (2002). Interactions of antimitotic peptides and depsipeptides with tubulin. 66(3), 142-160.
- Autophagy-related genes are induced by histone deacetylase inhibitor suberoylanilide hydroxamic acid via the activation of cathepsin B in human breast cancer cells. Oncotarget. 2017;8(32):53352.
- [Google Scholar]
- Recent advances of tubulin inhibitors targeting the colchicine binding site for cancer therapy. Biomolecules. 2022;12(12)
- [Google Scholar]
- Hawash, M. (2019). Highlights on specific biological targets; cyclin-dependent kinases, epidermal growth factor receptors, ras protein, and cancer stem cells in anticancer drug development. 69(09), 471-478.
- GX15-070 (obatoclax) overcomes glucocorticoid resistance in acute lymphoblastic leukemia through induction of apoptosis and autophagy. Cell Death Dis.. 2010;1(9):e76-e.
- [Google Scholar]
- Heptinstall, A. B., Adiyasa, I., Cano, C., Hardcastle, I. R. J. F. M. C. (2018). Recent advances in CDK inhibitors for cancer therapy. 10(11), 1369-1388.
- Sanguinarine-dependent induction of apoptosis in primary effusion lymphoma cells. Cancer Res.. 2007;67(8):3888-3897.
- [Google Scholar]
- Information, N. C. f. B. (2024a). PubChem Compound Summary for CID 12134544, Tubulysin A. Retrieved January 11 from https://pubchem.ncbi.nlm.nih.gov/compound/Tubulysin-A.
- Information, N. C. f. B. (2024b). PubChem Compound Summary for CID 12134545, Tubulysin B. Retrieved January 11 from https://pubchem.ncbi.nlm.nih.gov/compound/Tubulysin-B.
- Biological evaluation of tubulysin A: a potential anticancer and antiangiogenic natural product. Biochem. J.. 2006;396(2):235-242.
- [Google Scholar]
- Khalil, M.W., Sasse, F., Lünsdorf, H., Elnakady, Y.A., Reichenbach, H.J.C., 2006. Mechanism of action of tubulysin, an antimitotic peptide from myxobacteria. 7(4), 678-683.
- Cathepsins: Proteases that are vital for survival but can also be fatal. Biomed. Pharmacother.. 2018;105:526-532.
- [Google Scholar]
- Rogov, V., Dötsch, V., Johansen, T., Kirkin, V.J.M.C. (2014). Interactions between autophagy receptors and ubiquitin-like proteins form the molecular basis for selective autophagy. 53(2), 167-178.
- Sasse, F., Sieinmetz, H., Heil, J., Hoefle, G., Reichenbach, H. J. T. J. o. a. (2000). Tubulysins, new cytostatic peptides from myxobacteria acting on microtubuli production, isolation, physico-chemical and biological properties. 53(9), 879-885.
- The zinc ionophore clioquinol reverses autophagy arrest in chloroquine-treated ARPE-19 cells and in APP/mutant presenilin-1–transfected Chinese hamster ovary cells. Neurobiol. Aging. 2015;36(12):3228-3238.
- [Google Scholar]
- Isolation, crystal and solution structure determination, and biosynthesis of tubulysins—powerful inhibitors of tubulin polymerization from myxobacteria. Angew. Chem.. 2004;116(37):4996-5000.
- [Google Scholar]
- Hydroxychloroquine attenuates renal ischemia/reperfusion injury by inhibiting cathepsin mediated NLRP3 inflammasome activation. Cell Death Dis.. 2018;9(3):351.
- [Google Scholar]
- Antimitotic drugs in the treatment of cancer. Cancer Chemother. Pharmacol.. 2015;76(6):1101-1112.
- [Google Scholar]
- Autophagy is essential for flavopiridol-induced cytotoxicity against MCF-7 breast cancer cells. Mol. Med. Rep.. 2017;16(6):9715-9720.
- [Google Scholar]
- The cytoprotective, cytotoxic and nonprotective functional forms of autophagy induced by microtubule poisons in tumor cells-implications for autophagy modulation as a therapeutic strategy. Biomedicines. 2022;10(7)
- [Google Scholar]


