

Translate this page into:
The impact of sloping land conversion program on ecosystem services interaction in forest-tea landscape
⁎Corresponding author. hzq03512@126.com (Zhiqin Hua)
-
Received: ,
Accepted: ,
This article was originally published by Elsevier and was migrated to Scientific Scholar after the change of Publisher.
Peer review under responsibility of King Saud University.
Abstract
Background
The interaction of ecosystem services (ESs) has attracted great attention as land use changes at the landscape scale to synergize ecological and economic benefits, while the influence of landscape structure on the interaction of ESs has received less investigation.
Methods
We proposed an integrated framework to analyze the influence of the sloping land conversion program (SLCP) on the interaction of ESs and provided a case study of a forest-tea landscape in Gande town, Anxi County, located on the southeastern coast of China. Visualizing the land use change under the implementation of the SLCP on the map, quantitatively measuring metrics of landscape structure, and comparing ES provisioning indicate ES interactions.
Results
The results show that ecological and economic benefits are synergistic in Gande under the implementation of the SLCP, as more forestland and farmland was converted from tea gardens. Moreover, the forest-tea-agricultural product landscape structure promotes sustainable landscape management.
Conclusion
It makes sense that landscape structure changes the influence of land use policies under the different social economic and economic contexts, and ES interactions are dynamic with different landscape structures.
Keywords
Landscape management
Ecological conservation
Economic benefits
Synergy and trade-offs of ecosystem services
Metrics of landscape structure
Land use policy

1 Introduction
Ecosystem services (ESs) include provisioning services (e.g., food, energy, timber), regulating services (e.g., soil retention, carbon storage, nutrition cycling), cultural services (e.g., aesthetic, recreation, heritage), and supporting services; furthermore, it has been argued that different ESs are correlated in complex ways (Bennett et al., 2009). The interaction of ESs attracts great attention as land use management changes at the landscape scale (Rescia and Ortega, 2018) and ecosystem-based landscape management is expected to maximize economic output and improve ecological function. Although maximizing economic output always results in the loss of ES provisioning (Torralba et al., 2018), such as agricultural expansion, it contributes to establishing livelihoods for undernourished people; however, it also causes great habitat loss and extinction events (Reed et al., 2016). Polasky et al. (2011) evaluated the impact of actual land use change on ESs in Minnesota from 1992 to 2001, and the results indicated that large-scale agricultural expansion increased returns to landowners but decreased net social benefits, such as carbon stocks, water quality, and terrestrial biodiversity.
Agroforestry landscapes are popular in developing countries and are widely accepted as an important way of synergizing food security, alleviating poverty, and providing a number of ESs (Kay et al., 2018; Landis, 2017). However, trade-offs among different ESs occur in agroforestry landscapes over a range of temporal and spatial scales (Mortimer et al., 2018). Cacao and coffee planted with shade trees in tropical countries (e.g., Indonesia, Brazil, Malaysia) are explicit agroforestry landscapes. It is argued that shade trees contribute to a landscape matrix that conserves biodiversity and improves the pest and disease resilience of cacao (Andres et al., 2016), and diversifying the shade tree species can promote overall landscape heterogeneity, ecological corridors and buffer zones around protected forest areas (Vebrova et al., 2014). However, great tradeoffs between a high cacao yield and decreasing provisioning ESs are induced by shaded trees (Vaast and Somarriba, 2014). Factors such as multiple cropping systems and local knowledge of landscape planning likely cause these trade-offs (Biasi et al., 2017; Rahman et al., 2016).
Over the past two decades, many studies have assessed landscape structure using metrics such as patch size and distribution, heterogeneity (density, richness, and diversity of patches) and complexity of rural landscapes (Forman, 1995). Meanwhile, spatial approaches such as geographical mapping and remote sensing have been applied in ES tradeoff assessments for land use and land cover management (Remme et al., 2014). However, the impacts of agroforestry landscape structures on the tradeoffs between economic output and provisioning ESs are less discussed. One of the reasons may be that agroforestry landscape structure conversion is driven by many social, economic and political and ecological forces (Spies et al., 2017)]; for example, the Natura 2000 network in the EU attempts to protect biodiversity by sustainable land use and is challenged as landscape restructuring (abandonment of less productive agricultural lands and forest expansion) under the impact of the Agriculture Environment Policy (Spies et al., 2014).
Forest-tea landscapes are popular in the mountainous areas of Southeast and Southwest China, e.g., in Fujian Province on the southeast coast, forest cover areas account for approximately 67% of the total land area, and tea crop plantations increase by 9.5% annually; thus, tea cultivation areas reach approximately 1.6% of the total land area. A monoculture tea landscape is observed in some villages, even near protected forest areas, and farmers remove trees and plant tea crops. The expansive tea plantation has made caused a land use transition since the 1990s. However, soil erosion on steep slopes becomes severe because of tea plantations. Therefore, policies on the prohibition of tea plantations on steep slopes and the construction of ecological tea gardens have been implemented.
Since the implementation of the sloping land conversion program (SLCP) (one of the greatest government-led PES in China, which incentivizes rural farmers to convert croplands on steep slopes (more than 25 degrees) or otherwise ecologically sensitive areas to forests or grasslands through the use of eco-compensation payment initiatives), the monoculture tea landscape is transforming to a forest-tea landscape, as more trees are planted on the top of the mountains and on the steep mountain trails. Different forest-tea landscape structures are observed in the field, such as complex forest-tea landscape structures (irregular patches of diversified tree species, agricultural crops, and tea crops) and semi-complex forest-tea landscape structures (regular patches of fast-growing forest and tea crops). The SLCP expects that more trees will be planted on the sloping lands and more marginal farmlands will be retired. However, there is little research on the impact of the SLCP on different structures of forest-tea landscapes, let alone on the influence of the SLCP on the interaction of provisioning ESs and economic output. It is possible that policy makers of the SLCP know nothing about the efficacy of ecosystem conservation and converting tea crops to forests contradicts local economic development. Another possibility is that the goal of the SLCP coincides with the synergy of economic development and ES conservation. Thus, it is pressing to assess the influence of the SLCP on the ES interaction to provide guidance for land use change over time.
Two research questions are of importance to policy makers in this paper: (1) How does the SLCP impact land use? (2) What is the influence of land use change on ES provisioning and economic benefits? In the two questions, we apply metrics of landscape structure to measure land use change, which is informative for policy makers. Next, we compare an ES assessment impacted by land use change to indicate ES interaction. This research contributes to the assessment of the SLCP to verify whether it represents ecological-economic synergistic development; furthermore, this research provides suggestions for the use of ecological compensation policy to promote efficient compensation payments. In this paper, we propose an integrated framework to analyze the influence of the SLCP on the ES interaction of forest-tea landscapes in Anxi County; however, the application of the framework can be expanded to other agroforestry landscape structures in situations of land use change.
2 Materials and methods
2.1 Study area
Anxi County is located on the southeastern coast of China and is one of the most important tea cultivation areas in Fujian (Fig. 2). The terrain is mainly mountains and hills, and it has a subtropical monsoon climate with an average temperature of 17–23 °C. The terrain and climate in Anxi are suitable for tea cultivation. Intensive Wulong tea cultivation produced great economic benefits for rural farmers; however, it also increased soil erosion during the 1990s and 2005. Since 2013, the local government has implemented the SLCP on the steep slopes (above 25°) and has focused on the ecological conservation of tea gardens.
Gande town of Anxi County is the largest tea cultivation area in Anxi, with an area of 21,000 ha. Because controlling severe soil erosion is required by the Anxi government, the SLCP has been implemented in the town for several years, and the government continues to subsidize ecological tea garden construction in Gande to synergize ecological conservation and economic development. It is representative that monoculture tea crop landscapes have been converted to forest-tea landscapes in Gande. Moreover, the impact of the SLCP on land use transformation is significant in Gande. Thus, we choose Gande town as a case study to reveal the impacts of the SLCP on the trade-offs of economic output and ecological benefits.
2.2 Proposed integrated framework
The implementation of the SLCP aimed at converting the ecologically sensitive farmland on steep slopes to forests, and land use change formed different landscape patterns. We compare the metrics of different landscape structures in land use maps and then calculate the ES and economic output differences using this static snapshot during the land use change period. The integrated framework is as follows (Fig. 1).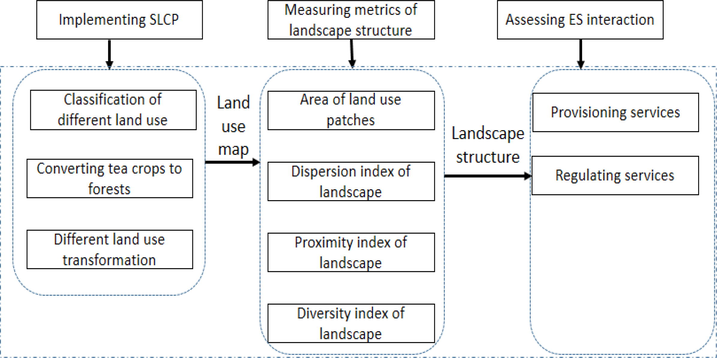
The integrated framework of the study.
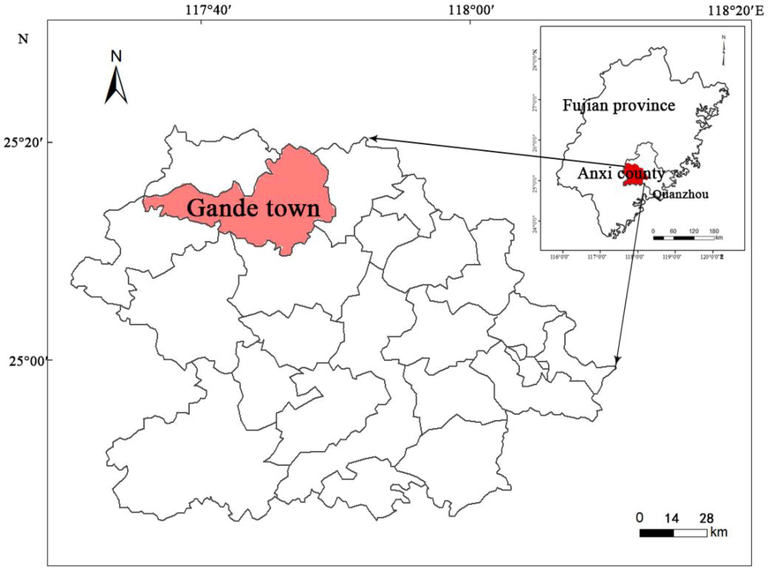
Research location.
Different land uses are classified in practice to enhance planning for land use management. In China, land use is classified into two first classes (agricultural land and built-up land) and twelve second classes (e.g., agricultural land is classified into farmland, garden, forestland, and grassland, and built-up land is classified into commercial/service land, industrial/mining/warehousing land, residential land/ traffic road land, public service land, watershed and others) (GB/T21010-2017). As tea crops are converted to forests, farmland is transformed to forestland under the SLCP. Land use maps are an important instrument used for visualizing land use changes. Here, we make different maps to reflect the land use change at different times based on geospatial information systems. Moreover, the metrics of landscape structure are measured in Fragstat software 14.2 based on land use maps. It is assumed that different patch areas directly impact the provision of ESs; therefore, comparing provisioning services and regulating services in physical units indicates the level of interaction.
However, the integrated approach presumes that land use change is impacted by the implementation of the SLCP, ignoring influences such as the abandonment of tea gardens when farmers migrate to cities. Meanwhile, rural farmers enrolled in the SLCP are completely converting tea crops to forests. Factually, it is probable that rural farmers leave tea trees growing on the sloped farmlands without planting specific trees (Yu, 2016). Thus, inaccurate land use classification of different land use patches likely exists. Moreover, ignoring the correlation of social and economic impact on land use change is likely to result in an exaggerated estimate of the influence of the SLCP on land use change. In this paper, we chose a town in Anxi County, where almost all the tea gardens enrolled in the SLCP have been converted to forests. Based on the available data, we classified different land uses and made a land use map of the town.
The appropriate selection of landscape metrics used to measure land use change under the impact of the SLCP is based on some criteria, as landscape structure has a great effect on ecological processes and ES provisioning. Here, we aim to calculate ES provisioning based on the area of different land use in the land use map. Thus, the criteria are simplified as follows: (1) reflecting the characteristics of landscape (area of each land use class), (2) highlighting the variation in landscape structure, and (3) indicating ecological conditions. We select the metrics of landscape level as follows: percentage of landscape, area-weighted mean shape index, mean-proximity index, juxtaposition index and Simpson’s diversity index.
To compare provisioning services and regulating services, we focus on forestland, tea gardens and farmland, as the ES values of residential land, traffic road land and unclassified land are presumed to be zero. Specific ESs are categorized (in Table 1). Considering that the market price of regulating ESs is uncertain, we compare ES values in physical units at different times to indicate the interaction of ESs.
Ecosystem services
Sub-types
2013
2017
References
Provisioning services
Tea crop (ton)
√
√
Anonymous (2019)
Timber products (m3)
√
√
Anonymous (2019)
Subsistence products: bean,corn, sweet potato, mushroom, orange
(ton)×
√
Anonymous (2019)
Regulating services
Climate regulation (CO2e ton)
√
√
Fang et al. (2001)
Rainfall interception service (ton)
×
√
Sheng et al. (2017)
Sediment deposition reduction (ton)
×
√
Sheng et al. (2017)
Soil nutrient loss reduction (ton)
×
√
Sheng et al. (2017)
2.3 Methods and data sources
2.3.1 Land use map
We used 30 m resolution Landsat images (https://glovis.usgs.gov/) in 2013 and 2017 to classify different land uses in Gande town. The Google Earth map with a high resolution of 2.5 m and the digital elevation map (DEM) were used to adjust the land use classification. As the dataset of land use classification of Gande was unavailable in 2013, we used supervised classification of images based on the Google Earth map and land use map of Gande in 2014. Here, five second-class land uses were classified, including forestland, tea garden, residential land, traffic road land and unclassified land in Arcgis10.2 software. Unclassified land was defined as no trees or no tea crops on the agricultural land. As the implementation of the SLCP started in 2014 and land use change continued, we compared the different landscape structures in 2013 and 2017.
2.3.2 Methods of ES assessment
Based on the classification of provisioning services, regulating services and cultural services in the Millennium Ecosystem Services Assessment, the provisioning services were sub-classified as tea crops, timber products, and subsistence agricultural products. Regulating services included services such as climate regulation, rainfall interception service, sediment deposition reduction, and soil nutrient loss regulation (Table 1). Although cultural services, such as aesthetic and recreation, are explored with eco-tourism in the ecological tea garden, this category is ignored because data are unavailable.
Almost all the afforestation on the steep slopes in Gande is pine forest because of its environmental adaptability and fast growth. It was calculated that the average standing stock on the forestland was 100 m3/ha in 2013 (https://www.forestry.gov.cn/main/72/content-644541.html) but 108 m3/ha in 2017 (Biao et al., 2010). The specific output of subsistence agricultural products, such as bean, mushroom, and corn crops, was estimated by the benefit transfer of proportional farmland in Gande to the total farmland in Anxi.
2.3.2.1 Carbon stock assessment
Climate regulation of carbon sequestration was the sum of forest carbon stocks and tea plant carbon stocks. Mason pine forest biomass was calculated using the formula (Fang et al., 2001):
2.3.2.2 Water interception assessment
Quantifying the amount of water intercepted in the rainfall event was impacted by forest type, canopy density, and leaf area index. Under ideal conditions, the rainfall interception service of mason pine forests was calculated as the sum of decreased soil erosion by the forest canopy, litter layer and soil water storage, following the method of Sheng et al. (2017). The coefficients of the canopy interception rate, the water-holding capacity in litter, and the capillary porosity of soil. According to the meteorological data, the precipitation is approximately 1800 mm in Gande every year, and the largest rainfall was assumed to be 150 mm.
2.3.2.3 Soil erosion reduction assessment
The soil erosion reduction service was measured by the amount the sediment deposition was reduced, further referring to the Soil Erosion Classification and Grading Standards (SL190-2007); specifically, the coefficient of the soil erosion modulus of the forestland (t/ha) was 4.5 t/ha, and the coefficient of the soil erosion modulus of the tea garden (t/ha) was 50 t/ha.
2.3.2.4 Nutrient retention assessment
Nutrient retention services, such as nitrogen, phosphorus and potassium in the soil, are critical for plant growth. The nutrient retention was equivalent to the total amount of soil erosion reduction multiplied by the contents of different nutrients in the forest soil [41]. Soil nutrition was assessed based on the mixed soil layer of 0–20 cm of mason pine forestland in Fujian, and the contents of nitrogen, phosphorus and potassium were 0.18%, 0.07%, and 1.44%, respectively (Biao et al., 2010).
3 Results
3.1 Impact of the SLCP on land use change
The map of land use classification (Fig. 3a) indicates that tea garden was almost prevalent on the mountains in 2013, and the area reached approximately 5815 ha. Forestland was mainly distributed on the western mountain, and some was scattered on the northeastern mountain. The forestland reached approximately 7270 ha. Farmland was segmented by tea gardens and had a value of approximately 5730 ha. The main residential land was aggregated along a traffic road, with a value of approximately 2020 ha. The area of traffic land was approximately 127 ha. After the implementation of the SLCP in 2017 (Fig. 3b), the area of tea garden decreased to 3563 ha, forestland increased to 8812 ha, and farmland increased to 6924 ha. Residential land also decreased to almost 836 ha, while traffic land increased to 825 ha. This result was attributed to the highway construction across some villages.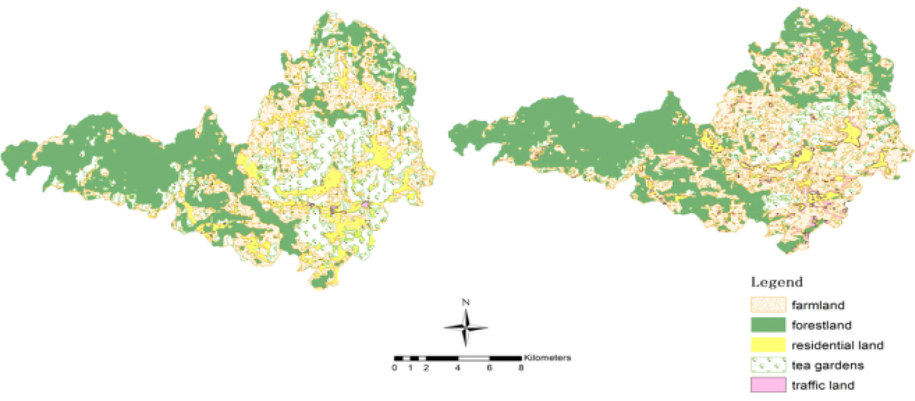
Land use classification of Gande in 2013 (a) and 2017 (b).
Comparing the two different maps in 2013 and 2017, a significant difference in land use change existed in the central part of Gande town. We chose some random points on the farmland that was previously tea garden and combined this information with the DEM data; the results indicated that most of the tea garden converted to farmland was implemented with an increasing elevation of 600 m-900 m.
3.2 Change in landscape structure
The metrics of landscape structure in the above land use maps indicated that the forestland was the most abundant type, and the proportion of total agricultural land use was comparatively increased, but built-up land use decreased slightly in the different years. The landscape was composed of 34.6% forestland, 27.6% tea gardens, 27.3% farmland, approximately 9.7% residential land and 0.8% traffic land in 2013. The landscape was composed of 42% forestland, 17% tea gardens, 33% farmland, 4% residential land and 4% traffic land in 2017. Moreover, the metrics of landscape structure, such as shape, proximity, and interspersion extent, change with different percentages of landscape. The measurement results (Table 2) indicated that significant differences existed in the landscape structure under the impact of the SLCP, except for the diversity of the landscape.
Assessment year
Area-weighted mean shape index
Mean-proximity index
(radius of 1000 m)Juxtaposition index
Simpson’s diversity index
2013
4.58
251.95
72.62
0.61
2017
5.21
549.31
66.96
0.61
A greater area-weighted mean shape index likely indicates a more complex land use shape and influences the edge effect of the landscape. A greater mean-proximity index in the radius of 1000 m likely indicates a more fragmented collection of different land uses. The lower juxtaposition index in 2017 indicates that more similar land use was found in adjacent areas. The Simpson’s diversity index was almost the same, which indicated that the diversity of the landscape had a minor change. Because more farmland was transformed from tea gardens at lower elevations, tea gardens were more fragmented in 2017. Meanwhile, forest areas at higher elevations (above 1000 m) increased because tea gardens and farmland were converted to forestland. Thus, forestland, tea gardens, and farmland were most likely distributed regularly based on different elevations.
3.3 SLCP impact on the interaction of ecosystem services
Under the impact of the SLCP, different land uses changed ES provisioning, such as decreasing tea crop output while increasing timber products and agricultural products. Moreover, more regulating services would be provided with expanding forest plantations. The results of the ES assessments between 2013 and 2017 are shown in Table 3.
Assessment year
Provisioning services
Regulating services
Tea crops
Timber products
Subsistence products
Climate regulation
Rainfall interception
Sediment deposition reduction
Soil nutrient loss reduction
2013
7675
10,178
14,748
304,301
380,503
330,785
5590
2017
5347
19,386
21,010
298,110
452,618
400,946
6776
The tea crop output decreased considerably when tea gardens were transformed to forestland or farmland, while subsistence agricultural products increased greatly. Climate regulation also decreased as there was a great loss of carbon stocks from the tea crops. Other provisioning services increased because of the expansive forest plantations. Furthermore, considering the increasing price of tea crops in 2017 (the price in 2013 was approximately 57 RMB/kg, and it increased to 122 RMB/kg based on the statistics of tea quantity and market value from the State Agricultural Agency), the total economic benefits of provisioning services were profoundly greater than those in 2013. Additionally, the ecological benefits of regulating services increased in 2017 if the price was maintained at the same level. Thus, the results indicated that ecological and economic benefits were likely synergistic under the implementation of the SLCP in Gande.
4 Discussion
Interactions of ES provisioning caused by land use change have attracted the attention of policy makers, ecologists, and economists. Policies such as payments for ESs, sustainable agroforestry landscape design, and ecological hotspot conservation are more concerned about the synergy of ecological and economic benefits at the landscape scale (Suwarno et al., 2018; Vaast and Somarriba, 2014; Vebrova et al., 2014). Ecological economists are making endeavors to assess the impact of economic development on the provision of ESs and social culture as well as on the feedback of economic, ecological, and social networks. The landscape structure is the outcome of complex social, ecological and economic interactions (Biasi et al., 2017; Jew et al., 2017). Land use policies are one of the influential driving forces of landscape structure change (Hua et al., 2018). In this paper, land use change under the implementation of the SLCP is expected by policy makers, as it is intended to control soil erosion by converting tea gardens on the steep slopes to forests and to improve adaptive land use management. It is argued that land use change polices should consider different social and economic contexts. Because rural farmers are most driven by economic benefits, forest plantations exist at the great expense of crop profits. It is likely that the compensation of the SLCP is too small to cover the forgone opportunity cost of farmers (Yin et al., 2010), and land use change contrasts with expectations. In addition, rural farmers are impacted by social networks (e.g., neighboring tree plantation decisions likely impact their choice of forest or grass) (Hua et al., 2018). Thus, it is uncertain if land use change under the impact of the SLCP is concomitant with policy makers’ expectations. Research should focus on the implementation of the SLCP at specific locations under different economic, social, and ecological contexts.
The synergy of ecological and economic benefits is likely realized under the implementation of the SLCP, as the economic benefits of converting tea crops to forests are not decreasing but increasing. The price of tea crops is twice as high in 2017 as the price in 2013 due to the great increase in the demand for tea consumption. It seems that the increasing economic benefits are not a barrier for converting monoculture tea crops lands to forest-tea landscapes. However, it should not be ignorant that the economic benefits of farmers who convert tea crops to forests are comparatively decreased, leading to an unfair distribution of economic benefits. It is possible that rural farmers are increasing farmland to compensate for their economic loss, and the forest-tea-agriculture landscape is a compromise of the SLCP. The results of the landscape metrics indicate a more fragmented composition of different land uses in a radius of 1000 m but less interspersion of different land use, which is concomitant with our field observation that tea crops are planted on the mountainside, while forests are planted on the tops of mountains and agricultural crops are cultivated at the foot of the mountain. The forest-tea-agricultural crop landscape improves economic benefits for farmers and increases the provision of ESs to local humans (Landis, 2017). Moreover, multifunctional agricultural landscapes have been proposed as a flexible approach to solve food crises and biodiversity conservation by encouraging small-scale farming (Perfecto and Vandermeer, 2010). It is promising that the forest-tea-agriculture landscape structure under the impact of the SLCP promotes economic and ecological benefits.
However, there is another possibility in that farmers further convert ecologically sensitive uncultivated land to farmland, and slippage effects have been recorded in the US conservation program (Alix-Garcia et al., 2012). Based on the land use change between agricultural land use and urban land use in Gande between 2013 and 2017, the proportion of agricultural land use increased but that of built-up land use decreased, especially that of residential land use. The increasing farmland is probably attributed to the implementation of policies, such as “linkage between urban land taking and rural land giving” and “village land consolidation”, used to protect basic farmland (the central government strictly retained 1.8 billion mu of farmland). As many farmers out-migrate to urbanized regions, hollowed villages are emerging (Long et al., 2012). Land use policies are implemented to reduce housing in villages by moving farmers to multi-story buildings and consolidating lands to make up for farmland quotas (Chen et al., 2014). Thus, it is suggested that integrated land use policies should be applied to balance different land uses and the trade-offs in benefits imposed by different policies.
The landscape approach is beneficial for monitoring land use change, assessing ecological and economic benefits, and enhancing adaptive management, while even transforming the top-down governing structure (Reed et al., 2016). It is suggested that different landscape structures should be measured at multiple scales to assess the impact on ecological, economic and social interactions. For example, the fragmentation of forests impacts animal livelihood, which indirectly influences the biological control services and pollination services of agriculture, causing a loss of economic benefits (Power, 2010). The overview of landscape structure adapting to ecological, economic and social interactions at multiple scales will provide more information for land use policy making. In this paper, the landscape structure under the impact of the SLCP was measured at a small scale, ignoring the landscape structure impact on the ecological and economic benefits of other areas, as well as the landscape structure’s widespread impact on ecological processes. The provision of ESs in such a landscape structure is dynamic with growing forests or iterative agricultural products; however, we discuss only static ES interactions. Therefore, we should further explore the relationships between landscape structure and ecological processes, landscape structure and economic transformation, and landscape structure and social evolution at multiple scales to reveal the landscape structure impact on ecological-economic and social interactions.
5 Conclusions
The influence of the SLCP on the interaction of ecological benefits and economic benefits depends on land use change under specific social, economic, and ecological contexts. The landscape structure, such as the increasing percentage of forestland with decreasing tea gardens on the steep slope in the case study, is most likely to indicate a synergistic relationship between ecological and economic benefits. When the forest-tea-agriculture landscape is formed to balance economic loss for the implementation of the SLCP, land use change improves fairness and steady transformation. The integrated framework combines land use change with the assessment of ES interactions. Its function as a black box of measuring the influence of land use policies on landscape management is of great importance to policy making. However, deep, and dynamic studies on the linkage of landscape structure and ES interactions are informative for adaptive landscape management.
Funding
This study is funded by Program of Fujian Provincial Key Laboratory of Agroecological Processing and Safety Monitoring (Fujian Agriculture and Forestry University) (Grant No. NYST-2021-04)” Fujian Chuanzheng Communications College Science and Education Development Fund Doctor Research Launch Special (No.20220109). The authors extend their appreciation to the Researchers supporting project number (RSP2023R306), King Saud University, Riyadh, Saudi Arabia.
Acknowledgments
We would like to thank Professor Wei Shui, Shuisheng, Fan for their suggestions on the paper, as well as language editors. The authors extend their appreciation to the Researchers supporting project number (RSP2023R306), King Saud University, Riyadh, Saudi Arabia.
Declaration of Competing Interest
The authors declare that they have no known competing financial interests or personal relationships that could have appeared to influence the work reported in this paper.
References
- Forest conservation and slippage: Evidence from mexico’s national payments for ecosystem services program. Land Econ 2012
- [CrossRef] [Google Scholar]
- Andres, C., Comoé, H., Beerli, A., Schneider, M., Rist, S., Jacobi, J., 2016. Cocoa in Monoculture and Dynamic Agroforestry. https://doi.org/10.1007/978-3-319-26777-7_3.
- Anonymous, 2019. Statistical Yearbook of Quanzhou in 2014/2018 [WWW Document].
- Understanding relationships among multiple ecosystem services. Ecol. Lett. 2009
- [CrossRef] [Google Scholar]
- Water conservation of forest ecosystem in Beijing and its value. Ecol. Econ. 2010
- [CrossRef] [Google Scholar]
- Towards sustainable rural landscapes? a multivariate analysis of the structure of traditional tree cropping systems along a human pressure gradient in a mediterranean region. Agrofor. Syst. 2017
- [CrossRef] [Google Scholar]
- The impact of rural out-migration on land use transition in China: Past, present and trend. Land Use Policy 2014
- [CrossRef] [Google Scholar]
- Changes in forest biomass carbon storage in China between 1949 and 1998. Science (80-.) 2001
- [CrossRef] [Google Scholar]
- Some general principles of landscape and regional ecology. Landsc. Ecol. 1995
- [CrossRef] [Google Scholar]
- Tree plantations displacing native forests: The nature and drivers of apparent forest recovery on former croplands in Southwestern China from 2000 to 2015. Biol. Conserv. 2018
- [CrossRef] [Google Scholar]
- Tobacco cultivation as a driver of land use change and degradation in the miombo woodlands of south-west Tanzania. L. Degrad. Dev. 2017
- [CrossRef] [Google Scholar]
- Landscape-scale modelling of agroforestry ecosystems services in Swiss orchards: a methodological approach. Landsc. Ecol. 2018
- [CrossRef] [Google Scholar]
- Designing agricultural landscapes for biodiversity-based ecosystem services. Basic Appl. Ecol. 2017
- [CrossRef] [Google Scholar]
- Accelerated restructuring in rural China fueled by “increasing vs. decreasing balance” land-use policy for dealing with hollowed villages. Land Use Policy 2012
- [CrossRef] [Google Scholar]
- Supporting and regulating ecosystem services in cacao agroforestry systems. Agrofor. Syst. 2018
- [CrossRef] [Google Scholar]
- The agroecological matrix as alternative to the land-sparing/agriculture intensification model. Proc. Natl. Acad. Sci. U. S. A. 2010
- [CrossRef] [Google Scholar]
- The impact of land-use change on ecosystem services, biodiversity and returns to landowners: A case study in the state of Minnesota. Environ. Resour. Econ. 2011
- [CrossRef] [Google Scholar]
- Ecosystem services and agriculture: Tradeoffs and synergies. Philos. Trans. R. Soc. B Biol. Sci. 2010
- [CrossRef] [Google Scholar]
- Towards productive landscapes: Trade-offs in tree-cover and income across a matrix of smallholder agricultural land-use systems. Land Use Policy 2016
- [CrossRef] [Google Scholar]
- Integrated landscape approaches to managing social and environmental issues in the tropics: learning from the past to guide the future. Glob. Chang. Biol. 2016
- [CrossRef] [Google Scholar]
- Developing spatial biophysical accounting for multiple ecosystem services. Ecosyst. Serv. 2014
- [CrossRef] [Google Scholar]
- Quantitative evaluation of the spatial resilience to the B. oleae pest in olive grove socio-ecological landscapes at different scales. Ecol. Indic. 2018
- [CrossRef] [Google Scholar]
- Determining eco-compensation standards based on the ecosystem services value of the mountain ecological forests in Beijing. China. Ecosyst. Serv. 2017
- [CrossRef] [Google Scholar]
- Examining fire-prone forest landscapes as coupled human and natural systems. Ecol. Soc. 2014
- [CrossRef] [Google Scholar]
- Using an agent-based model to examine forest management outcomes in a fire-prone landscape in Oregon. USA. Ecol. Soc. 2017
- [CrossRef] [Google Scholar]
- Land-use trade-offs in the Kapuas peat forest, Central Kalimantan, Indonesia. Land Use Policy 2018
- [CrossRef] [Google Scholar]
- A social-ecological analysis of ecosystem services supply and trade-offs in European wood-pastures. Sci. Adv. 2018
- [CrossRef] [Google Scholar]
- Trade-offs between crop intensification and ecosystem services: the role of agroforestry in cocoa cultivation. Agrofor. Syst. 2014
- [CrossRef] [Google Scholar]
- Tree diversity in cacao agroforests in San Alejandro. Peruvian Amazon. Agrofor. Syst. 2014
- [CrossRef] [Google Scholar]
- Assessing China’s ecological restoration programs: What’s been done and what remains to be done? Environ. Manage. 2010
- [CrossRef] [Google Scholar]
- Central–local conflicts in China’s environmental policy implementation: the case of the sloping land conversion program. Nat. Hazards. 2016
- [CrossRef] [Google Scholar]
- Temporal Evolution of Carbon Storage in Chinese Tea Plantations from 1950 to 2010. Pedosphere 2017
- [CrossRef] [Google Scholar]
Appendix A
Supplementary material
Supplementary data to this article can be found online at https://doi.org/10.1016/j.jksus.2023.102705.
Appendix A
Supplementary material
The following are the Supplementary data to this article:


