Translate this page into:
Synthesis of biodiesel from Carthamus tinctorius L. oil using TiO2 nanoparticles as a catalyst
⁎Corresponding authors. najm_saqib@yahoo.com (Najm Us Saqib), najam@ubuner.edu.pk (Najm Us Saqib), umar.sahibzada@gmail.com (Muhammad Umar Khayam Sahibzada), h.mohafez@um.edu.my (Hamidreza Mohafez)
-
Received: ,
Accepted: ,
This article was originally published by Elsevier and was migrated to Scientific Scholar after the change of Publisher.
Peer review under responsibility of King Saud University.
Abstract
Objectives
The present study aimed to synthesize Titanium dioxide (TiO2) nanoparticles and assess its catalytic role in the synthesis of biodiesel from Carthamus tinctorius L. (a non-edible plant source).
Methods
The precipitation approach was used to synthesize TiO2 nanoparticles, and the process was verified using X-ray diffraction (XRD) and scanning electron microscope (SEM). The synthesized biodiesel was analyzed qualitatively through NMR, GC-MS, and FT-IR spectroscopy.
Result
XRD result showed that the crystal structure of TiO2 nanoparticles was a biphasic mixture of rutile and anatase phases. SEM analysis revealed that the synthesized TiO2 nanoparticles had size from 42 nm to 58 nm and a surface area of 21–27 m2/g. The oil content in the feedstock was 43.9 % with free fatty acids contents of 0.37 mg KOH/g. The suitable condition for optimum yield (95 %) of biodiesel was 1:10 of oil to methanol using 25 g of catalyst at a temperature of 65 °C for 80–120 min of reaction time. Results obtained through 1H NMR for methoxy proton at 3.661 ppm, an alpha-methylene proton in triplet from 2.015 to 2.788 ppm, terminal methyl protons at 0.885 to 0.910 ppm, and beta-carbonyl methylene protons from 1.253 to 1.641 ppm confirmed the synthesis of biodiesel. Similarly, the peaks obtained through FT-IR spectroscopy for methoxycarbonyl at 1740.6 cm−1 and ether at 1012.6 cm−1 are the evidence for the validation of transesterification reaction. Furthermore, GC-MS analysis showed peaks for 17 different types of fatty acid methyl esters.
Conclusion
The chemical and physical properties of C. tinctorius showed that the oil of C. tinctorius could be a potential non-edible feedstock for the biodiesel industries.
Keywords
Green energy
Biodiesel
TiO2
Non-edible feedstock
Carthamus tinctorius L.
1 Introduction
Green energy is worldwide attracting the interest of researchers due to its harmlessness to the environment and the shrinkage of the reserves of petro-fuels (Bharti et al., 2019; Aarti et al., 2022a). Additionally, the global energy demand has been gradually rising day by day, it has resulted a rise in the usage of petroleum-based fuels (Karthikeyan et al., 2017). This rise in the energy demand is due to increase in the global population and expansion in the number of companies; as a consequence, researchers have focused to study on the discovery of renewable and ecologically friendly fuels (Kumar et al., 2019; Aarti et al., 2022b).
Biodiesel is considered valuable because of the reduction in demand for petro-fuels and it is economically important. Furthermore, biodiesel is eco-friendly because it reduces the emissions of greenhouse gases, and also it is important socially due to the generation of new employment and income opportunities (Zahed et al., 2021). Currently, biodiesel is synthesized from animal fats, plant oil, and algal oil by mixing with methanol or ethanol using different catalysts. But globally plant oil is the preferred raw material used for biodiesel synthesis because of its easy availability. The nature of catalyst(s) used in the synthesis process may be either heterogeneous or homogeneous. The common homogeneous catalysts used currently are NaOH and KOH, as they are economical (Bharti et al., 2019), but are non-recyclable and cause pollution.
Several heterogeneous catalysts have currently being studied by numerous researchers for the production of biodiesel. The most valuable characteristic of heterogeneous catalysts over homogeneous catalysts is that they can be recycled (Bharti et al., 2019). But the drawback of heterogeneous catalysts as compared to homogeneous catalysts is their low activity. Therefore, the main focus of the researchers is to synthesize such a novel catalyst that may overcome the limitations related to both heterogeneous and homogeneous catalysts. Because of the high ratio of surface to volume, the nano-catalysts currently have gained the attention of researchers. Nano-catalysts having low particle size and high surface area can accelerate the rate of reaction because of a large number of molecules with the lowest energy for a reaction to proceed (Borah et al., 2018; Aarti et al., 2022a).
Among different nanocatalysts, Titanium dioxide (TiO2) is an important catalyst that is environmentally friendly, cheap, and durable as compared to other nanomaterials. But the investigation on the catalytic activity of TiO2 nanoparticles for biodiesel synthesis is very limited (Zahed et al., 2021).
This study aimed to synthesize TiO2 nanocatalyst and study its physicochemical characteristics. Furthermore, it was aimed to assess the catalytic activity of TiO2 in the biodiesel synthesis from Carthamus tinctorius L. (a non-edible plant source) and analyze the physicochemical and various fuel properties of the synthesized biodiesel i.e. C. tinctorius-based biodiesel (CTB).
2 Materials and methods
2.1 TiO2 nanoparticles preparation
The precursor solution was a mixture of 5 ml of Titanium isopropoxide (C12H28O4Ti; 97 % Fluka) and 15 ml of isopropanol. Five ml of C12H28O4Ti was gradually added dropwise into 15 ml of isopropanol under constant stirring at 40 °C. Following the addition of 0.1 g of polyvinylpyrrolidone, it was then agitated for 20 min. Following that, 10 ml of distilled water was gradually added. To achieve the appropriate pH, nitric acid (HNO3) was added. Ti(OH)4 is produced as a white precipitate. Centrifugation was used to separate Ti(OH)4 and impurities were then removed by repeatedly washing the Ti(OH)4 with distilled water. In an oven set to 80 °C for 24 h, the cleaned precipitate was dried. By using thermo-gravimetric-differential thermal analysis at a temperature of 800 °C, the dried and fine powder of Ti(OH)4 was converted into TiO2 nanoparticles. At temperatures over 400 °C, a substantial transformation of Ti(OH)4 into TiO2 was observed. The TiO2 powder formed was further examined by scanning electron microscope (SEM) and then used for biodiesel synthesis (Buraso et al., 2018).
2.2 Characterization
To validate the formation of nanoparticles, catalyst was studied through X-ray diffraction (XRD; Model No. D8 Advance Bruker). All measurements fell between 20 and 70 2Θ. Using SEM, the morphology of TiO2 nanoparticles was examined (Model JSM-5910, JEOL, Japan). SEM field emissions were operated with an accelerating voltage of (20–40 kV) to produce the scanned pictures. It enabled the qualitative evaluation of the surface of catalysts and assisted in the explanation of the phenomena that emerged during calcining and pre-treatment.
2.3 Oil extraction from C. tinctorius L.
We used two methods for oil extraction i.e., the chemical (through soxhlet) method and the mechanical method. Before the oil extraction, the seeds of the feedstock were washed and rubbed gently using mild-warmed distilled water for the removal of dust particles.
2.3.1 Chemical extraction using soxhlet
Chemical extraction was carried out for the determination of oil quantity in the seeds of C. tinctorius L. The chemical extraction was performed using soxhlet according to the methodology of Ullah et al. (2020). The quantity of oil in seeds of feedstock was calculated using the equation as shown below: where, W1 is the weight of the empty flask, W2 is the weight of the fine powder sample, W3 is the weight of the flask and extracted oil, and W4 is the weight of the extracted oil.
2.3.2 Mechanical extraction of oil
Oil was bulk extracted from the feedstock using mechanical extraction with the help of expeller Model KEK P0015, 10127, Germany. The extracted oil was gathered to store in the glass jar.
2.4 Oil filtration
The technique adopted by Ullah et al. (2020) was used for the filtration and storage of crude oil.
2.5 Free fatty acids (FFA) content determination
Ullah et al. (2020) approach was used to calculate the quantity of FFA in the feedstock oil. The FFA percentage was estimated using the formula mentioned below: where
A = Potassium hydroxide (KOH) volume used in sample titration.
B = KOH volume used in the blank titration.
C = KOH (g/l) concentration.
V = Oil sample volume.
2.6 Biodiesel synthesis
TiO2 was used as a nanocatalyst to synthsize biodiesel via the transesterification method. The following formula was used for calculating the percentage yield of biodiesel after the experiments (Ullah et al., 2020).
2.7 Analysis of fuel properties
Different fuel properties of synthesised biodiesel, such as Flash Point (°C) (PMCC), Density at 15 °C (kg/l), Kinematic Viscosity at 40 °C (CST), Pour Point or PP (°C), Sulphur (% wt), Distillation at 90 % recovery (°C), Cloud point or CP (°C), Calorific Value (Kj/Kg), and Cetane no., were determined in accordance with the ASTM, and EN standards were taken into consideration for the assessment of the chemical and physical features of biodiesel (Antolın et al., 2002; Holser and O’Kuru, 2006).
2.8 Chemical assessment of biodiesel
TiO2 was utilised as a catalyst and C. tinctorius L. as used as a feedstock. To confirm the biodiesel synthesis, the Fourier-transform infrared (FT-IR), nuclear magnetic resonance (NMR), and gas chromatography-mass spectrometry (GC–MS) techniques were carried out (Ullah et al., 2020).
2.8.1 FT-IR analysis of CTB
To determine the concentration of various chemical species present in the CTB, FT-IR spectroscopy was carried out. FT-IR analysis was performed using Shimadzu IR- 460 (Japan) model in the range of 400–4000 cm−1.
2.8.2 NMR of CTB
The 1H and 13C NMR spectroscopes were performed at 20 °C using an 11.75T Avance NEO Bunker 600 MHz spectrometer furnished with a 5 mm BBF smart probe. Internal authentication standards comprised tetramethylsilane solvent and deuterated chloroform. The 1H NMR (300 MHz) spectra had a pulse length of 30°, a recycle delay of 1 scan, and a total of 8 scans. The 13C NMR (75 MHz) spectrum was acquired with a pulse duration of 30°, a recycle delay of 1.89 scans, and 160 scans. The ratio of Cocklebur plant triacylglyceride to fatty acid methyl esters was calculated mathematically by 1H NMR spectroscopy using the equation shown below (Knothe, 2000).
Percentage of biofuel, C = 100 × 2AMe/3ACH2.
where C is the proportion of oil converted to biofuel.
AMe = Methoxy proton integration value in biofuel.
ACH2 = α-methylene protons integration value in biofuel.
2.8.3 Fames determination using GC–MS
The chemical makeup of the fatty acid methyl esters (FAMEs) of CTB was determined using GC–MS. Hexane was used as the solvent to inject around 1 ml of CTB into the GC–MS (Model QP 2010 Plus; Shimadzu Japan). Helium served as the vector gas. The column's temperature was set at 50–300 °C. The injector and detector were set to 250 °C.
3 Results and Discussion
3.1 XRD of TiO2 nanocatalyst
The TiO2 nanoparticles are crystalline in nature and are a biphasic blend of the anatase and rutile phases. The Debye-Scherrer equation estimates that particles range in size from 42 to 58 nm. Furthermore, considerable diffraction with peaks at 24.7, 27.4, 35.3, 38.9, 41.2, 44.3, 48.8, 54.2, 56.4, 62.5, 64.2, 68.6 and 69.9° that are corresponding to the 101, 110, 101, 200, 111, 210, 211, 220, 022, 310, 301, and 112 Miller indices, respectively (Supplemantary data Fig. 1). Moreover, the diffraction peaks at 27.2, 36.0, and 54.2° support the rutile structure of the material. The size of the XRD sample's points showed that the intended nanoparticles remain crystalline, and broad diffraction peaks describe the very limited area of crystallite (Theivasanthi and Alagar, 2013).
3.2 SEM analyis of TiO2
SEM analysis revealed that the synthesized TiO2 nanoparticles had size from 42 nm to 58 nm and a surface area of 21–27 m2/g. TiO2 nanoparticles appeared spherical in shape (Fig. 1). Due to the accumulation of smaller nanoparticles, the bigger TiO2 aggregated particles were able to be seen (Theivasanthi and Alagar, 2013).
SEM analysis of TiO2 nanocatalyst.
3.3 Oil extraction and FFA content determination
We used two methods, chemical via soxhlet and mechanical for oil extraction, to compare our findings to the global best practises recommended by other studies (Ronald et al., 2012; Ullah et al., 2020). The soxhlet extraction technique is specified by European Union for oil extraction from the feedstock. Furthermore, the use of these techniques is cost-effective and easy to handle (Saka, 2005; Ullah et al., 2020).
The oil content in the feedstock was 43.9 %. Other researchers have also reported more or less similar results (Flemmer et al., 2015). Furthermore, the FFA contents were also determined through the acid titration method before the biodiesel synthesis process which was estimated as 0.37 mg KOH/g. This is below the limit values as specified internationally. If the feedstock has FFA contents of more than 3 %, the oil to biodiesel conversion efficacy declines gradually (Anggraini and Wiederwertung, 1999; Ullah et al., 2020).
3.4 Mechanism of transesterification reaction using TiO2 nanoparticles
Previous studies suggested that both acid/base catalyzed processes are equally valuable for triglycerides transesterification. Titanium atoms of TiO2 nanoparticles act as Lewis acid and are exposed to the oxygen atoms of triglycerides, hence oxygens atoms attach to Titanium, which consequently enhances the carbonyl group electrophilicity. Meanwhile, methanol attacks the electrophile carbonyl sites to form tetrahedral intermediates (Borah et al., 2018). Hence, the shifting of proton charges breaks down the triglyceride molecule to diglyceride and one mole of methyl ester is formed. Furthermore, the addition of methanol to the reaction activates TiO2 nanoparticles and the carbonyl group, which leads to the formation of glycerol and two methyl esters.
3.5 Biodiesel synthesis and optimization
To conclude conditions suitable for maximum biodiesel yield, a series of experiments were intended by considering four main variables of reactions i.e., Oil to methanol ratio, catalyst concentration, reaction time, and temperature.
3.5.1 Oil to methanol ratio
Ullah et al. (2020) assessed that the ratio of oil to methanol had a substantial influence on biodiesel yield. As a consequence, we employed the following oil-to-methanol ratios: 1:4, 1:6, 1:8, 1:10, and 1:12. The findings clearly revealed that the optimum yield was achieved at a ratio of oil to methanol of 1:10. (Fig. 2). Our results were found more or less similar to the findings of Worapun et al. (2012) and Ullah et al. (2020).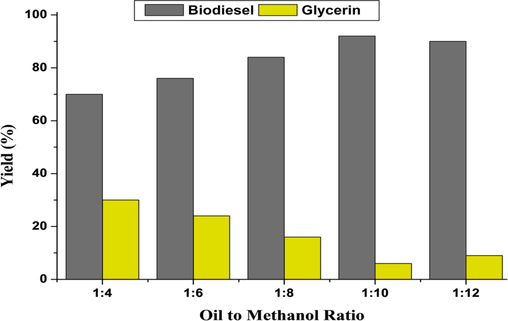
Biodiesel yield (%) at various oil to methanol ratio.
According to the published research, the transesterification process is reversible and has a stoichiometric alcohol to oil molar ratio of 3:1. As a result, a larger molar ratio improves the miscibility and interaction of the molecules of alcohol and triglycerides. According to the reports of various researchers, the molar ratio would be kept more than the stoichiometric ratio for the completion of the reaction or maximum yield of biodiesel (Uzun et al., 2012; Ullah et al., 2020).
The presence of sufficient methanol is required, according to Kumar (2013) and Ullah et al. (2020), for the transesterification process to break the bonds between the glycerin fatty acids. Additionally, a high concentration of methanol (greater than 1:7 M ratio) in the biodiesel synthesis process slows down the separation of glycerol and ester (Miao and Wu, 2006).
3.5.2 Catalyst concentration
An important factor in biodiesel output is the catalyst (Worapun et al., 2012; Ullah et al., 2020). To achieve the optimum biodiesel production, several catalyst concentrations (0.1, 0.15, 0.2, 0.25, and 0.3 g) were employed. The yield was achieved at 0.25 g of catalyst concentration (Fig. 3). According to Bojan and Durairaj (2012), a high concentration of catalyst causes the formation of soap because of emulsification. According to Ullah et al. (2020), a high amount of catalyst increases the reactants' viscosity, which results in the reduction of biodiesel yield.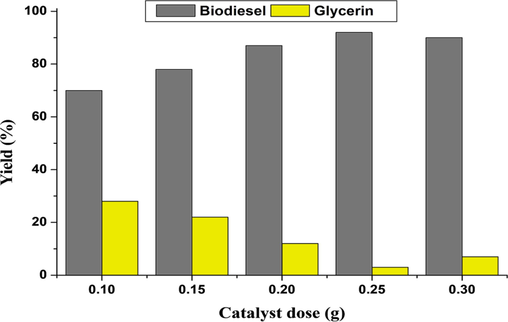
Biodiesel yield (%) at various concentrations of catalyst.
3.5.3 Reaction temperature
For the determination of the ideal temperature at which maximum biodiesel yield can be attained, the temperature was set at 50, 55, 60, 65, and 70 °C. The production of biodiesel increased to 95 % when the temperature was raised from 50 °C to 65 °C, but it decreased when the temperature was raised to 70 °C (Fig. 4). Our findings were consistent with those of Ullah et al. (2020) and Uzan et al (2012). The decrease in biodiesel yield at high temperatures (more than 65 °C) may be due to the high miscibility that results in the reduction of phase separation as well as yield (Ullah et al., 2020).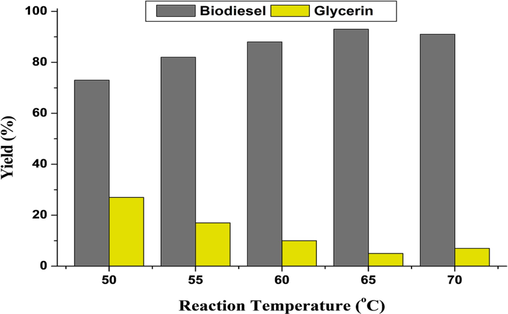
Biodiesel yield (%) at various temperatures.
3.5.4 Reaction time
Mathiyazhagan and Ganapathi (2011) found that when response time increased, the biodiesel yield was improved too. While keeping the other parameters constant, we also changed the reaction time (20, 40, 60, 80, and 120 min) to find the best time for the highest biodiesel yield. The results revealed that at 80 and 120 min reaction duration, the biodiesel yield was raised to 95 % (Fig. 5). Similar findings were stated by Ullah et al. (2020) too.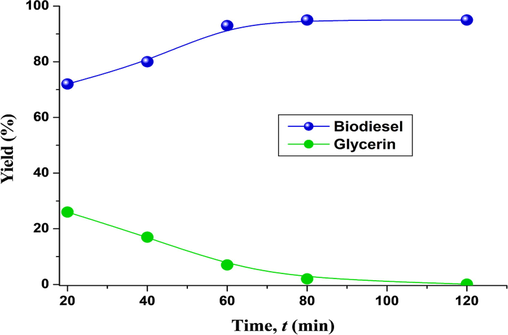
Biodiesel yield (%) at different time interval.
3.6 Physical and fuel properties of CTB
The CTB had a 0.37 mg KOH/g acid value, which was less than the 0.5 mg KOH/g standard range, as specified by EN-14214. The acid value of the CTB was comparable to those reported by Ullah et al. (2020) and Shalaby and El Gendy (2012). The quality of biodiesel's purification also affects how acidic it is (Shalaby and El Gendy, 2012). Additionally, the kinematic viscosity of CTB at 40 °C was determined to be 4.32 mm2/s (Table 1). It falls within the ASTM D 445 standard's range. CTB's kinematic viscosity was found to be closed to that of fossil diesel (Ullah et al., 2020). Additionally, 0.8519 g/cm3 of CTB density was measured (Table 1), which is within the permitted range of EN 14214 criteria (Wang et al., 2011; Ullah et al., 2020). According to Kaisan et al. (2020) and Ullah et al. (2020), biodiesel has a lower calorific value than fossil diesel because of its high oxygen concentrations. According to this research, fossil diesel has a higher calorific value than CTB (Table 1).
Fuel property
Method
CTB-B100%
HSD
Colour
Visual
2
2.O
Flash Point (°C)
ASTM D-93
78
60–80
Density at 15 °C (Kg/l)
ASTM D-1298
0.8519
0.8343
Kinematic Viscosity at 40 °C (cSt)
ASTM D-445
4.32
4.223
Pour Point (°C)
ASTM D-97
−8
(−15 to −35)
Cloud Point (°C)
ASTM D-2500
−10
5 to −15
Sulphur (% wt)
ASTM D-4294
0.00038
0.05
Distillation at 90 % recovery (°C)
ASTM D-86
349
356.9
Calorific Value (Kj/Kg)
ASTM-240
16,327
17,893
Cetane no.
ASTM-976
48
48–52
While the ASTM D-93 standard permits the range to be under 130 °C, the EN 14214 standard specifies that biodiesel must have a flashpoint of more than 120 °C. The flashpoint of any biodiesel is significantly influenced by its methanol concentration (Ullah et al. 2020). According to Ullah et al. (2020), when the methanol content of biodiesel is increased by 0.5 %, its flash point is decreased by 50 °C. The flashpoint of CTB in this study was calculated as 78 °C (Table 1). This is within the EN 14214 and ASTM D 6751-02 standards range. According to the previous studies, the range of flashpoints for biodiesel is 160–202 °C (Refaat et al., 2008; Dias et al., 2008).
In this study, the cetane number of CTB was reported as 48 (Table 1), which was found below the limits mentioned in EN 14214 standards. If the cetane number is above the limit, we can adjust it by adding a small amount of nitric acid Isooctyl for the quality conformation (Knothe, 2009, Ullah et al., 2020). The above statement indicates that there is inversely proportionality between the degree of unsaturation of fatty acids and cetane number (Ullah et al., 2020).
In the current study, the CP and PP for CTB were documented as −8 °C and −10 °C, respectively (Table 1). But there is no limit for CP and PP according to ASTM D 6751 standard; however, Mofijur et al. (2015) specified the value for CP and PP. In the present study, the sulfur content was determined as 0.00038 ppm (Table 1), which is in the range limit of ASTM D 4294 (0.05 ppm). Therefore, the CTB is considered an eco-friendly fuel (Kumar, 2013; Ullah et al., 2020).
3.7 FT-IR analysis of CTB
Soon et al. (2013) found that both the substituent effects and the molecular structure have an impact on where the carbonyl group is located. The methoxycarbonyl group was found at 1740.6 cm−1 in the CTB’s FT-IR spectroscopy. Furthermore, the peak for ether (C—O) was obtained at 1012.6 cm−1. These two peaks are evident for the validation of transesterification (methyl esters) reaction. Methyl and methylene stretching bands were achieved at 2852.9 and 2923.1 cm−1, respectively. For the methyl group, the bending peak was measured at 1357.8 cm−1, whereas for the methylene group, it was measured at 1437.2 cm−1. Furthermore, for methylene —(CH2)n— rocking (n ≥ 3), the peak was obtained at 724.1 cm−1. The peak for C—H aromatic was obtained at 1168.1 cm−1. Similarly for aromatic ethers, the aryl —O stretching peak was obtained at 1241.1 cm−1. The peak obtained at 836.9 cm−1 confirmed the presence of the C—O—O stretch. The band for C⚌C (alkene) was obtained at 3009.1 cm−1 (Fig. 6).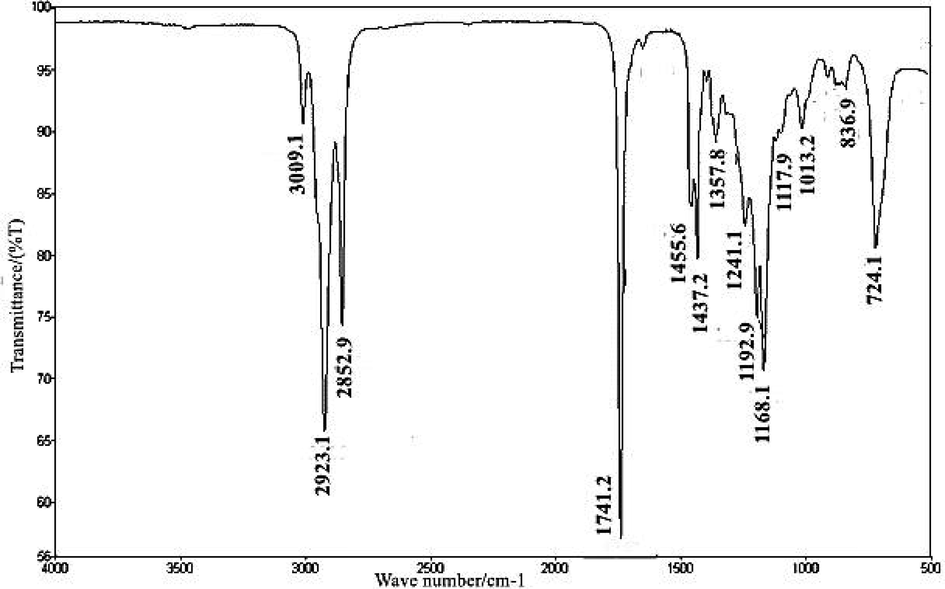
FT-IR spectrum of CTB.
FT-IR spectroscopic study was done to confirm the biodiesel synthesis and for confirming various functional groups formed during the transesterification process. There are two main peaks for ester formation; one is carbonyl for which the peak range is 1730–1750 cm−1 and the other is C—O for which the peak range is 1000–1300 cm−1. In the present study, in CTB, the peak for carbonyl (ѵC⚌O) was noted at 1741.2 cm−1, while the peak for C—O was observed at 1013.2 cm−1. Peaks of C—H aromatic, alcohol stretching, and C⚌C aromatic were observed at 3009.1, 1013.2, and 1437.2 cm−1, respectively (Christie, 2003).
3.8 1H NMR of CTB
The characteristic singlet peak obtained at 3.661 ppm confirmed the presence of methoxy proton (—OCH3). Furthermore, for alpha-methylene proton (α-CH2), the peaks were obtained in triplet from 2.015 to 2.788 ppm. These two peaks confirmed the formation of FAMEs from triglycerides. The other important peaks observed were for terminal methyl protons (—CH3) at 0.885–0.910 ppm. The next strong indication was the peak obtained from 1.253 to 1.641 ppm for beta-carbonyl methylene protons (Supplementary data Fig. 2). Furthermore, the peaks obtained at 5.301–5.401 ppm confirmed the olefinic hydrogen, (Killner et al., 2015; Dutra et al., 2018; Ullah et al., 2020). The peaks were obtained to confirm the transformation of triglycerides into FAMEs (Laskar et al., 2020; Ullah et al., 2020).
3.9 13C NMR of CTB
In the present study, the peaks obtained at 24.83–34.16 ppm confirmed the presence of long-chain ethylene carbons (—CH2—). The peaks at 174.26 and 130.15 ppm confirmed the carbonyl carbon (-C⚌O) and also unsaturation position in the CTB. Furthermore, the peak at 128.04 ppm is an indication of vinylic (C⚌H) (Supplementary data Fig. 3). The peaks for the same functional groups in the specified range were reported in other studies too (Shanmugam et al., 2016; Kalanakoppal Venkatesh et al., 2018).
3.10 GC–MS analysis of CTB
GC–MS results showed 17 peaks of different types of FAMEs. Every single peak represents a specific FAME and was confirmed through No. NIST 02 library match software. The retention time data identifies each FAME after mass spectrometric analysis (Table 2). The analysis showed that linoleic acid methyl ester (C18:2c), oleic acid methyl ester (C18:1c), palmitic acid methyl ester (C16:0), and stearic acid methyl ester (C18:0) are the major FAMEs identified in the CTB. GC chromatogram showed that most of the FAMEs were saturated and monounsaturated. The mass fragmentation patterns and retention time of the eluted components were used for the confirmation of various FAMEs. It is evident from the GC–MS data that the CTB is primarily composed of various FAMEs (Fig. 7).
Identified compound
Formula of FAMEs
Retention time
Concentration %
Caprylic acid methyl ester
C8:0
4.739
1.024
Capric acid methyl ester
C10:0
6.476
1.009
Lauric acid methyl ester
C12:0
8.077
0.671
Myristic acid methyl ester
C14:0
10.168
0.324
Pentadecanoic acid methyl ester
C15:0
11.627
0.109
Palmitic acid methyl ester
C16:0
13.424
9.143
Palmitoleic acid methyl ester
C16:1
13.878
1.049
Heptadecenoic acid methyl ester
C17:1
15.943
0.027
Stearic acid methyl ester
C18:0
17.897
4.367
Oleic acid methyl ester
C18:1c
18.375
17.728
Linoleic acid methyl ester
C18:2c
19.659
56.395
Linolenic acid methyl ester
C18:3n3
21.743
2.235
Arachidic acid methyl ester
C20:0
24.661
0.841
Heneicosanoic acid methyl ester
C21:0
28.368
1.007
Erucic acid methyl ester
C22:1n9
33.91
2.045
13, 16-Locosadienoic acid methyl ester
C22:2c
35.03
1.205
Lignoceric acid methyl ester
C24:0
38.08
0.821
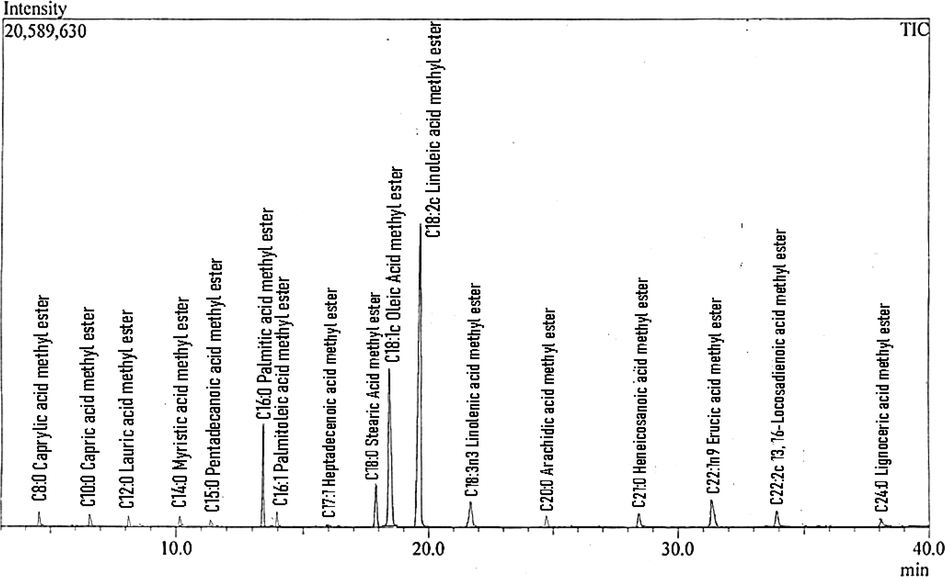
GC–MS chromatogram of CTB.
FAMEs composition of plant-based biodiesel revealed the presence of 8–16 different types of FAMEs (Kouame, 2011). In the present study, 17 different types of FAMEs in CTB were reported (Table 2). Vieira et al. (2021) reported 8 different FAMEs, Rashid and Farooq (2008) reported three different FAMEs, and Gecgel et al. (2007) reported 9 different fatty acids.
4 Conclusions
Biodiesel is no doubt less pollution-causing fuel with a soft chemical nature of FAMEs. Currently, various numbers of techniques are being applied for biodiesel production. This work used C. tinctorius L. as the feedstock and TiO2 as the catalyst to synthesis biodiesel utilising the transesterification method. It was discovered that the FFA level of 0.37 mg KOH/g was viable for the production of biodiesel. A 1:10 oil-to-methanol molar ratio, 0.25 g of TiO2 catalyst, 65 °C reaction temperature, and 120 min reaction time were the ideal transesterification conditions for maximum yield of biodiesel. The biodiesel produced in this research met the essential requirements for petro-diesel, according to its physicochemical qualities. Therefore, it may be a viable alternative to fossil fuels. The chemical and physical properties of C. tinctorius L. clearly showed that the oil of C. tinctorius L. could be a potential non-edible feedstock in the biodiesel industry. Also, this feedstock is economic, indigenously available, and can be cultivated easily in various environments.
Acknowledgment
The authors like to thank Taif University, Taif, Saudi Arabia, for their support (Taif University Researchers Supporting Project number: TURSP-2020/80). This research was also funded by the Universiti of Malaya Research Grant (RU013AC-2021).
Declaration of Competing Interest
The authors declare that they have no known competing financial interests or personal relationships that could have appeared to influence the work reported in this paper.
References
- Synthesis of gold nanoparticles using bacterial cellulase and its role in saccharification and bioethanol production from aquatic weeds. J. King Saud Univ.-Sci.. 2022;34(4):101974.
- [CrossRef] [Google Scholar]
- Saccharification of alkali pre-treated aquatic weeds biomass using partially purified cellulase immobilized on different matrices. Biocatal. Agric. Biotechnol.. 2022;39:102283.
- [CrossRef] [Google Scholar]
- Speiseolen/fetten im Energetisch Technischen Bereichein Verfahren und Kassel. Germany: Witzenhausen; 1999. p. :193.
- Optimisation of biodiesel production by sunflower oil transesterification. Bioresour. Technol.. 2002;83:111-114.
- [CrossRef] [Google Scholar]
- Process optimization of biodiesel production catalyzed by CaO nanocatalyst using response surface methodology. J. Nano. Chem.. 2019;9:269-280.
- [CrossRef] [Google Scholar]
- Producing biodiesel from high free fatty acid jatropha curcas oil by a two step method-an indian case study. J. Sust. Ener. Environ.. 2012;3:63-66.
- [Google Scholar]
- Biodiesel production from waste cooking oil catalyzed by in-situ decorated TiO2 on reduced graphene oxide nanocomposite. Energy. 2018;158:881-889.
- [CrossRef] [Google Scholar]
- Lipid Analysis (third ed.). Bridgewater UK: Oily Press; 2003.
- Comparison of the performance of different homogeneous alkali catalysts during transesterification of waste and virgin oils and evaluation of biodiesel quality. Fuel. 2008;87:3572-3578.
- [CrossRef] [Google Scholar]
- Characterization of fat and biodiesel from mango seeds using 1HNMR spectroscopy. Bio. Con. Bioref.. 2018;8(1):135-141.
- [Google Scholar]
- Description of safflower (Carthamus tinctorius) phenological growth stages according to the extended BBCH scale. Ann. App. Biol.. 2015;166(2):331-339.
- [CrossRef] [Google Scholar]
- Transesterified milkweed (Asclepias) seed oil as a biodiesel fuel. Fuel. 2006;85:2106-2110.
- [CrossRef] [Google Scholar]
- Calorific value, flash point and cetane number of biodiesel from cotton, jatropha and neem binary and multi-blends with diesel. Biofuels. 2020;11(3):321-327.
- [Google Scholar]
- Preparation of a CaO nanocatalyst and its application for biodiesel production using butea monosperma oil: An optimization study. J. Am. Oil Chem. Soc.. 2018;95(5):635-649.
- [CrossRef] [Google Scholar]
- Production of biodiesel from waste cooking oil using MgMoO4 -supported TiO2 as a heterogeneous catalyst. Energy Sources, Part A Recover. Util. Environ. Eff.. 2017;39:2053-2059.
- [CrossRef] [Google Scholar]
- Compact NMR spectroscopy for real-time monitoring of a biodiesel production. Fuel. 2015;139:240-247.
- [CrossRef] [Google Scholar]
- Monitoring a progressing transesterification reaction by fiber optic NIR spectroscopy with correlation to 1H NMR spectroscopy. J. Am. Oil Chem. Soc.. 2000;77:489-493.
- [Google Scholar]
- Improving biodiesel fuel properties by modifying fatty ester composition. En. Environ. Sci.. 2009;2:759-766.
- [CrossRef] [Google Scholar]
- Comparative characterization of Jatropha, soybean and commercial biodiesel. J. Fuel Chem. Technol.. 2011;39:258-264.
- [CrossRef] [Google Scholar]
- Biodiesel production from hybrid non-edible oil using bio-support beads immobilized with lipase from Pseudomonas cepacia. Fuel. 2019;255:115801.
- [Google Scholar]
- Zinc oxide supported silver nanoparticles as a heterogeneous catalyst for production of biodiesel from palm oil. Environ. Prog. Sust. Energy. 2020;39(3):e13369.
- [Google Scholar]
- Biodiesel production from heterotrophic microalgal oil. Bioresour. Technol.. 2006;97:841-846.
- [CrossRef] [Google Scholar]
- Effect of biodiesel-diesel blending on physico-chemical properties of biodiesel produced from Moringa oleifera. Procedia Eng.. 2015;105:665-669.
- [CrossRef] [Google Scholar]
- Production optimization and quality assessment of biodiesel from waste vegetable oil. Int. J. Environ. Sci. Technol.. 2008;5:75-82.
- [CrossRef] [Google Scholar]
- Extraction of oil from microalgae for biodiesel production: A review. Biotech. Adv.. 2012;30:709-732.
- [CrossRef] [Google Scholar]
- Production of biodiesel: current and future technology. In: JSPS/VCO Core University Program Seminar. Universiti Sains Malaysia; 2005. p. :67-102.
- [Google Scholar]
- Two steps alkaline transesterification of waste cooking oil and quality assessment of the produced biodiesel. Int. J. Chem. Biochem. Sci.. 2012;1:30-35.
- [Google Scholar]
- Transesterification of waste chicken fat oil using Mesoporous Mg-KIT-6 catalyst. Adv. Sci. Eng. Med.. 2016;8(3):196-202.
- [CrossRef] [Google Scholar]
- Continuous biodiesel production using ultrasound clamp on tubular reactor. Inter. J. Auto. Mech. Eng.. 2013;8:1396-1405.
- [Google Scholar]
- Synthesis and structural characterization of biofuel from Cocklebur sp., using zinc oxide nano-particle: A novel energy crop for bioenergy industry. Front. Bioeng. Biotechnol.. 2020;8
- [CrossRef] [Google Scholar]
- Biodiesel production from waste frying oils: Optimization of reaction parameters and determination of fuel properties. Energy. 2012;44(1):347-351.
- [CrossRef] [Google Scholar]
- Production and selected fuel properties of biodiesel from promising non-edible oils: Euphorbia lathyris L., Sapium sebiferum L. and Jatropha curcas L. Bioresour. Technol.. 2011;102:1194-1199.
- [CrossRef] [Google Scholar]
- Two-step biodiesel production from crude Jatropha curcas L. oil using ultrasonic irradiation assisted. J. Oleo Sci.. 2012;61:165-172.
- [CrossRef] [Google Scholar]
- Modeling and optimization of biodiesel synthesis using TiO2–ZnO nanocatalyst and characteristics of biodiesel made from waste sunflower oil. Curr. Res. Green Sust. Chem.. 2021;4:100223.
- [CrossRef] [Google Scholar]
Appendix A
Supplementary data
Supplementary data to this article can be found online at https://doi.org/10.1016/j.jksus.2022.102317.
Appendix A
Supplementary data
The following are the Supplementary data to this article:


