

Translate this page into:
Synthesis of 2-mercaptopropionic acid/hydrous zirconium oxide composite and its application for removal of Pb(II) from water samples: Central composite design for optimization
⁎Corresponding authors. nafisurrahman05@gmail.com (Nafisur Rahman), amenizi@ksu.edu.sa (Abdullah M. Al-Enizi)
-
Received: ,
Accepted: ,
This article was originally published by Elsevier and was migrated to Scientific Scholar after the change of Publisher.
Peer review under responsibility of King Saud University.
Abstract
Abstract
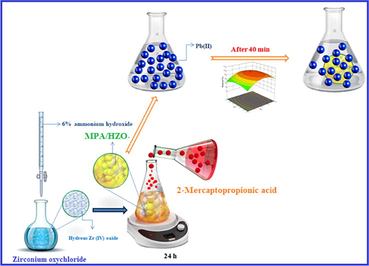
In this study, 2-mercaptopropionic acid was incorporated into hydrous zirconium oxide matrix to prepare 2-mercaptopropionic acid/ hydrous zirconium oxide (MPA/HZO) composite and applied to eliminate Pb(II) from aqueous environment. MPA/HZO was characterized by FTIR, TGA-DTA and SEM with EDX. Response surface methodology (RSM) was utilized for optimizing the independent variables affecting the uptake of Pb(II)). The maximum efficiency was reached at an equilibrating time of 40 min. At the optimum conditions (pH:6.8; contact time: 40 min; adsorbent dose: 0.016 g; initial concentration: 60 mg/L), 99.37% Pb(II) was successfully eliminated. Nonlinear regression analysis was applied for the investigation of isotherm and kinetic equations. Langmuir isotherm model with R2 > 0.99 was best fit model to demonstrate the adsorption of Pb(II) onto MPA/HZO. The maximum Langmuir adsorption capacity (qm) was 128.50 mg/g. Pseudo-second order kinetic model with R2 > 0.999 illustrated its best fitting to the kinetic data.
Keywords
2-Mercaptopropionic
Pb(II)
CCD
Adsorption
Error function
Isotherm
Kinetic

1 Introduction
The presence of non-degradable heavy metals in aquatic environment poses a serious hazard to living species. They have been discharged into superficial water from a number of industries such as electroplating, battery manufacturing, metal plating, textiles, mining, etc. (Jiang, et al., 2020). Among the heavy metals, Pb (II) is the first recognized metal pollutant in soft water due to the use of lead service pipes (Boudrahem et al., 2011). The acceptable limit of Pb (II) in drinking water according to World Health Organization (2017) is 10 µg/L. The elevated concentration of Pb(II) poses serious health problems such as nerves and renal breakdown, kidney damage, hypertension, behavioral disorders and, convulsions (Kumar et al., 2020). Therefore, it is very important to develop effective, simple and integrated technique to decontaminate Pb (II) from contaminated water. Several techniques such as solvent extraction (Halli et al., 2020), reverse osmosis (Thaci and Gashi, 2019), coagulation (Bora and Dutta, 2019), ion exchange (Gupta et al., 2005; Lutfullah et al., 2012a, 2012b) and adsorption (Gupta et al., 2004; Rahman, et al., 2020) have been extensively investigated to remove Pb(II) from water. Adsorption is an effective technique for the elimination of Pb(II) due to its environment friendly property, excellent performance, low cost, without releasing reaction by-product and reusable. Recently, various adsorbents such as clay mineral (Azamfire, et al., 2020) biochar (Boni, et al., 2020), biosorbent (Azmi et al., 2020) chitosan (Moja, et al., 2020) and carbon nanofibers (Nordin et al., 2020) were applied for the remediation of Pb(II) from water. Moreover, attempts have been made to prepare organic–inorganic hybrid materials to eradicate Pb (II) from aqueous medium (Rahman and Haseen, 2014; Rahman et al., 2017, 2020). In the hybrid material, various functional groups of organic substance are combined with thermally stable and robust inorganic matrix with high binding affinity towards the selected metal ions.
Response surface methodology (RSM) is widely used to study the relationship between various process variables and desired responses simultaneously. Recently, the variables of adsorption processes were optimized by RSM via Box-Behnken design (Rahman and Nasir, 2018; Rahman and Varshney, 2020; Rahman et al., 2021) or central composite design (Rahman and Nasir, 2019; Rahman and Nasir, 2020a, 2020b). In RSM, less number of experiments is required for optimization of variables as compared to conventional method of optimization. In this study, 2-mercaptopropionic acid/ hydrous zirconium oxide (MPA/HZO) composite was synthesized. Central composite design (CCD) was tried to optimize the variables of adsorption process (pH, adsorbent dose and initial concentration) for obtaining the highest removal of Pb(II). Various isotherm and kinetic models were subjected to experimental data to find out the nature of adsorption.
2 Experimental
2.1 Reagents
For the synthesis of MPA/ HZO composite, 2-mercaptopropionic acid and ammonia solution (25%) were obtained from Merck Specialties Pvt. Ltd, India. Zirconium oxychloride and lead nitrate were procured from Otto Chemie Pvt. Ltd, India. All other materials used in the experiments were analytical grade.
2.2 Instruments
Atomic absorption spectrophotometer (GBC Scientific, model 932 Plus, Australia) and pH meter (Cyberscan pH 2100) have been used to estimate the Pb(II) concentration and pH, respectively. PerkinElmer FTIR spectrophotometer (Spectrum 2) was used to obtain FTIR spectra. Simultaneous thermogravimetry–differential thermal analysis (TGA-DTA) were performed using Shimadzu thermal analyzer (DTG 60H) in nitrogen atmosphere with heating rate of 10 °C/min. SEM images with EDX spectra were obtained with JEOL scanning electron microscope (JSM-6510LV). The temperature and shaking speed was monitored in water bath shaker (Narang Scientific Works, India).
2.3 Synthesis of 2-mercaptopropionic acid/hydrous zirconium(IV) oxide (MPA/HZO) composite
The MPA/HZO was synthesized in two steps. In the first step, hydrous zirconium oxide (HZO) was prepared at room temperature by slow addition of 6% ammonium hydroxide to aqueous solution of zirconium oxychloride (0.10 mol/L) in equal proportion. In the second step, 2-mercaptopropionic acid (0.10 mol/L in ethanol) was mixed with HZO in 3:1 proportion with maintaining the pH 6 and stirred for 24 h and filtered after washing with distilled water and ethanol. The material was kept in an oven at 40 0C for drying. The schematic diagram for the preparation of MPA/HZO is given in Scheme 1.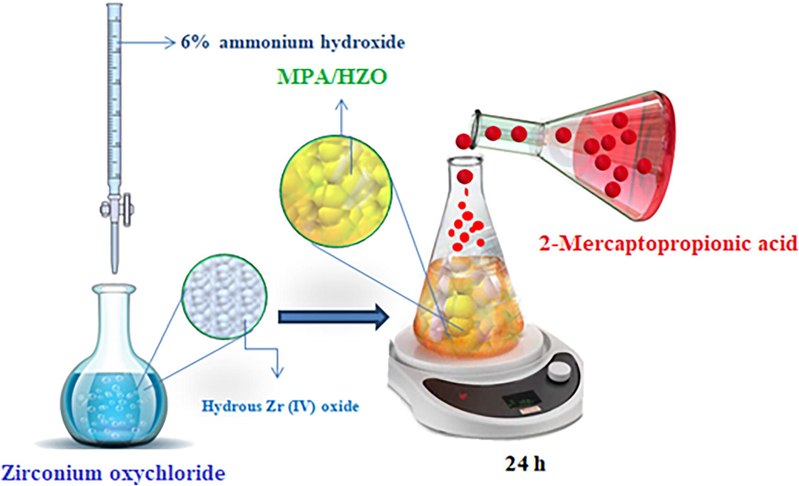
Schematic routes for synthesis of MPA/HZO composite.
2.4 Design of experiment and statistical analysis
CCD was used to study the impact of the independent variables on the removal of Pb (II). Three process variables such as pH (X1), adsorbent dose (X2) and initial concentration (X3) were examined to obtain the highest Pb (II) removal efficiency. The ranges and levels of variables used in CCD are given in Table S1 (Supplementary material). The CCD matrix was generated by Design Expert software (free trial version 12.0.0) for three factors, each factor at five levels (-α, −1, 0, +1 and + α) and the total number of experimental runs can be computed using Eq. (1) (Rahman and Nasir, 2018):
Exp. Run
Space type
Coded factors
Uncoded factors
Observed response (%)
Predicted response (%)
X1
X2
X3
pH
Adsorbent dose (g)
Initial concentration (mg/L)
1
Axial
0
0
+α
6.8
0.016
110.5
57.36
57.52
2
Center
0
0
0
6.8
0.016
60
99.71
99.37
3
Factorial
−1
+1
−1
3.2
0.020
30
46.94
46.97
4
Factorial
−1
−1
−1
3.2
0.012
30
40.25
40.28
5
Axial
0
0
−α
6.8
0.016
9.5
65.47
65.38
6
Factorial
+1
+1
+1
10.4
0.020
90
65.26
65.19
7
Factorial
+1
+1
−1
10.4
0.020
30
81.21
81.24
8
Axial
0
−α
0
6.8
0.009
60
66.36
66.39
9
Factorial
−1
−1
+1
3.2
0.012
90
47.06
46.98
10
Center
0
0
0
6.8
0.016
60
99.71
99.37
11
Center
0
0
0
6.8
0.016
60
99.71
99.37
12
Axial
+α
0
0
12.9
0.016
60
36.79
36.82
13
Factorial
+1
−1
+1
10.4
0.012
90
47.29
47.21
14
Axial
−α
0
0
0.75
0.016
60
7.78
7.81
15
Center
0
0
0
6.8
0.016
60
99.71
99.37
16
Center
0
0
0
6.8
0.016
60
99.71
99.37
17
Axial
0
+α
0
6.8
0.022
60
87.1
87.13
18
Center
0
0
0
6.8
0.016
60
99.71
99.37
19
Factorial
+1
−1
−1
10.4
0.012
30
43.74
43.77
20
Factorial
−1
+1
+1
3.2
0.020
90
34.26
34.18
2.5 Isotherm studies
Adsorption studies were conducted in batch mode at different temperatures (305, 310, 315 and 320 K). The solution pH was adjusted with HCl or NaOH solution. A known amount of MPA/HZO (0.016 g) was kept in a series of 50 mL flasks having Pb (II) solution (20 mL) of varying concentrations (9.5–110.5 mg/L) at pH 6.8 and then agitated (150 rpm) in a water bath shaker for 40 min. After filtration the concentration of Pb (II) in the filtrate was measured using AAS. The removal efficiency (%) and sorption capacity (qe; mg/g) were obtained from Eqs (3) and (4), respectively:
2.6 Kinetic studies
The adsorption kinetic studies were performed by adding 0.016 g MPA/HZO in a series of 50 mL flasks having 20 mL of Pb(II) solutions (60 mg /L, pH 6.8). The resulting mixtures were agitated (150 rpm) at 305, 310, 315 and 320 K in water bath shaker for different time intervals. The flasks were removed from the shaker at the desired time interval and the residual concentration of Pb(II) in solution was obtained by AAS. Finally, the adsorbed amounts of Pb(II) (qt) at different time interval were calculated and used in the investigation of different kinetic models.
2.7 Nonlinear regression analysis and error functions
In this study, all the kinetic and isotherm model parameters were evaluated by nonlinear regression analysis using the reported method (Hossain et al., 2013; Rahman and Varshney, 2020). Error functions were used to judge the best kinetic and isotherm models to describe the interface interactions and nature of adsorption process. Statistical error functions such as sum of squares of the error (SSE), sum of the absolute error (SAE), chi-square test (χ2) and Spearman’s correlation coefficient (rs) were evaluated using the following equations.
The terms qe,cal and qe,exp are the simulated and experimental adsorption capacity (mg/g), respectively. N represents total number of data points.
3 Results and discussion
3.1 Characterization
FTIR spectra of HZO and MPA/HZO are shown in Fig. 1a (I & II). Fig. 1aI displayed a broad absorption band peaking at 3429 cm−1 which defines the O–H stretching vibration of coordinated water. The absorption band appearing at 1629 cm−1 signifies the H-O–H bending mode (Rahman et al., 2015). The absorption peak at 1400 cm−1 indicated the O–H bending vibration of Zr-OH group (Zong et al., 2013). The lattice vibration of Zr-O was confirmed by the absorption bands at 848 cm−1, 676 cm-1and 469 cm−1. The FTIR spectrum of MPA/HZO (Fig. 1aII) exhibited absorption band between 3600 and 3200 cm−1 centred at 3406 cm−1 is attributed to O–H vibrations. The band appearing at 2933 cm−1 defines the vibration of C–H of CH3 group. A sharp peak at 1565 cm−1 was designated to
stretching vibration (Sakellari et al., 2020). The absorption band at 1075 cm−1 can be assigned to C-S stretching (Scorates, 1980). The bands peaking at 1417 cm−1 and 1278 cm−1 were due to O–H in-plane and C–O–H stretching vibrations, respectively. The thermal stability of MPA/HZO material was examined and thermogravimetric curves are shown in Fig. 1b. The TGA curve shows 15.55% weight loss between 40 °C and 120 °C that can be assigned to the elimination of water molecules. The endothermic peak at 90 °C (DTA curve, Fig. 1b) confirmed the dehydration of MPA/HZO. The second weight loss (17.11%) occurred in the temperature range 100 °C to 340 °C which may be due to the thermal degradation of thiol group of organic moiety and is also confirmed by exothermic peak at 325 °C in DTA curve. The continuous weight loss (12.69%) from 300 °C to 520 °C may be due to breakdown of remaining organic moiety and also confirmed by the presence of an exothermic peak in DTA curve at 490 °C. Fig. 1c (I-IV) shows the SEM images of HZO, MPA, MPA/HZO and Pb(II) sorbed MPA/HZO, respectively. It was apparent that SEM image of HZO (Fig. 1cI) exhibited the irregular surfaces. The surface morphology of MPA (Fig. 1cII) pointed towards rugged surface consisting of particles of different sizes and shapes with voids spaces. The surface morphology was changed when MPA was impregnated on the surface of HZO. The surface of MPA/HZO was slightly changed on Pb(II) adsorption. The presence of Zr, C, S and O in the EDX spectrum (Fig. S1) also confirmed the synthesis of MPA/HZO.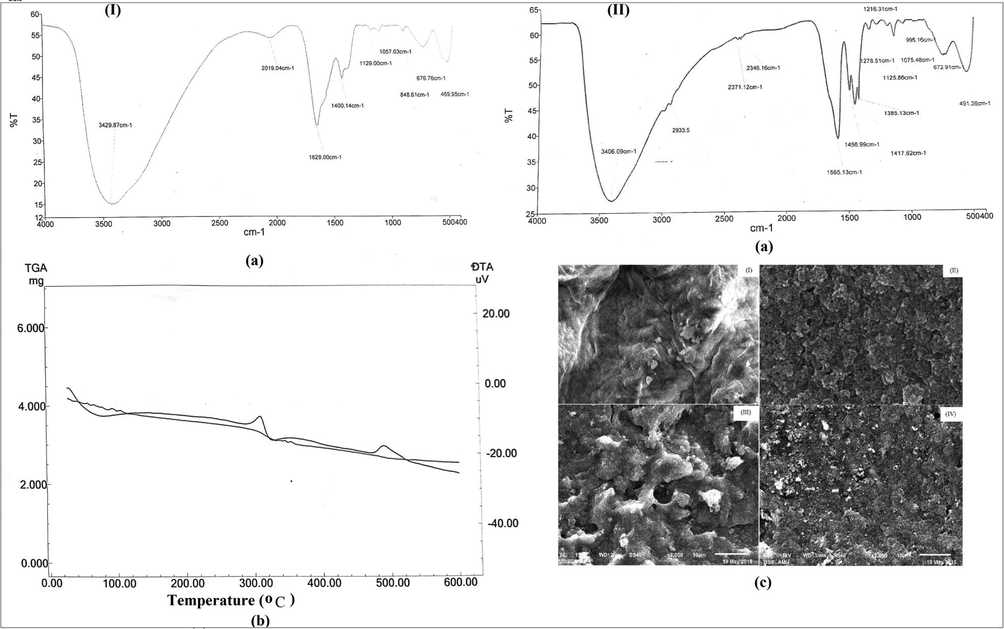
(a) FTIR spectra, of (I) HZO (II) MPA/HZO (b) TGA-DTA of MPA/HZO and (c) SEM images of (I) HZO, (II) MPA, (III) MPA/HZO and Pb(II) sorbed MPA/HZO.
3.2 RSM and statistical analysis
The experiments were conducted following the CCD matrix and the results (Table 1) were fitted to quadratic model to generate the regression equation. The correlation between the predicted response (% Removal) and the selected variables is expressed as: Removal (%) = + 99.37 + 8.62 X1 6.17 X2 −2.34 X3 + 7.69 X1 X2 −0.8162 X1 X3 −4.87 X2 X3 −27.24 X12 −7.99 X22 −13.41 X32(9)
Results of analysis of variance (ANOVA) are presented in Table 2. The larger magnitude of F-values and smaller p-values (<0.05) illustrate the adequacy of model and model terms. In this study, the higher F-value (14916.48) and lower p-value (<0.0001) of quadratic model and the lowest F-value (0.0195) and high p-value (0.9997) of lack of fit confirmed that quadratic model is highly significant with insignificant lack of fit. Moreover, all model terms have p- values < 0.05 and hence, all these terms are significant.
Source
Sum of square
df
Mean square
F-value
P-value
Remarks
Sequential sum of square
Mean vs total
87533.65
1
87533.65
Linear vs Mean
1609.55
3
536.52
0.6449
0.5973
2FI vs Linear
668.91
3
222.97
0.2293
0.8743
Quadratic vs 2FI
12638.02
3
4212.67
12396.85
< 0.0001
Suggested
Residual
3.34
6
0.5574
Total
1.025E + 05
16
5122.66
Analysis of variance (ANOVA)
Model
14916.48
9
1657.39
4877.28
<0.0001
Significant
X1-pH
1015.74
1
1015.74
2989.08
<0.0001
X2-Adsorbent dose
519.25
1
519.25
1528.04
< 0.0001
X3-Initial Concentration
74.56
1
74.56
219.40
<0.0001
X1X2
473.55
1
473.55
1393.54
<0.0001
X1X3
5.33
1
5.33
15.69
0.0027
X2X3
190.03
1
190.03
559.20
<0.0001
X12
10696.25
1
10696.25
31476.42
< 0.0001
X22
921.03
1
921.03
2710.35
<0.0001
X32
2591.19
1
2591.19
7625.22
<0.0001
Residual
3.40
10
0.3398
Lack of Fit
0.0648
5
0.0130
0.0195
0.9997
Not significant
Pure Error
3.33
5
0.6667
Cor Total
14919.88
19
Goodness of fit
Std. Dev.
0.5829
R2
0.9998
Mean
66.16
Adjusted R2
0.9996
C.V. %
0.8812
Predicted R2
0.9996
PRESS
5.29
Adeq Precision
222.1264
VIF
1.0
The high values of R2 (0.9997), adjusted R2 (0.9996) and predicted R2 (0.9996) for the quadratic model demonstrated that an excellent relationship existed between the experimental and the predicted responses. The low values of coefficient of variation (C.V = 0.8812%) and standard deviation (0.5829) suggested that degree of precision was satisfactory. The lowest predicted residual error sum of squares (PRESS) value (9.13) indicated that the quadratic model fits each point in the design (Fig. S2). The value of adequacy precision is used to measure signal to noise ratio and if its value is greater than 4, then this adequate signal is capable to navigate the design space. In the present study higher adequacy precision value (222.1264) confirmed that quadratic model was used to direct the design space. The variance inflation factor (VIF) examines the degree of correlation between the coefficients of independent variables (Zhang et al., 2020). The value of VIF equal to 1.00 indicated that all three factors are orthogonal to each other.
3.3 Effects of variables and response surface plots
Regression equation is graphically represented by 3D-response surface plots. From 3D-response surface plots, it can be easily deduced the importance of binary interactions between the selected process variables on the response. The influence of equilibrating time on the adsorption process is displayed in Fig S3 and found that the equilibrium was achieved at 40 min. Fig. 2a shows the interactive effects of pH and adsorbent mass on the removal efficiency while keeping the initial concentration at the centre level. At any fixed amount of adsorbent the uptake increased with pH and highest removal was observed at pH 6.8. At pH < 5, the adsorbent surface is positively charged due to the presence of SH2+ and Zr-OOH+ and hence, electrostatic repulsion between Pb(II) ions and the positively charged adsorbent surface resulted in decrease in removal efficiency. Above pH 7, the uptake of Pb(II) decreases. The maximum removal (99.37%) of Pb(II) was realized with 0.016 g of MPA/HZO at pH 6.8. The interactive effects of pH and initial concentration (Fig. 2b) suggested that at constant adsorbent dose (0.016 g) the sorption efficiency increased with increasing the Pb(II) concentration at any given pH value. The maximum uptake was observed when the initial concentration of Pb(II) was 60 mg/L. The combined effects of adsorbent mass and initial concentration on the uptake of Pb(II) (Fig. 2c) revealed that at constant pH (6.8) the Pb(II) removal efficiency was found to increase with increasing both adsorbent mass and initial concentration. At the optimum concentration (60 mg/L) the percentage removal increased from 42.69 to 99.37% when the adsorbent mass was altered from 0.009 to 0.016 g. These results revealed that the highest removal of Pb(II) (99.37%) was brought out when the pH, adsorbent mass and initial concentration were 6.8, 0.016 g and 60 mg/L, respectively.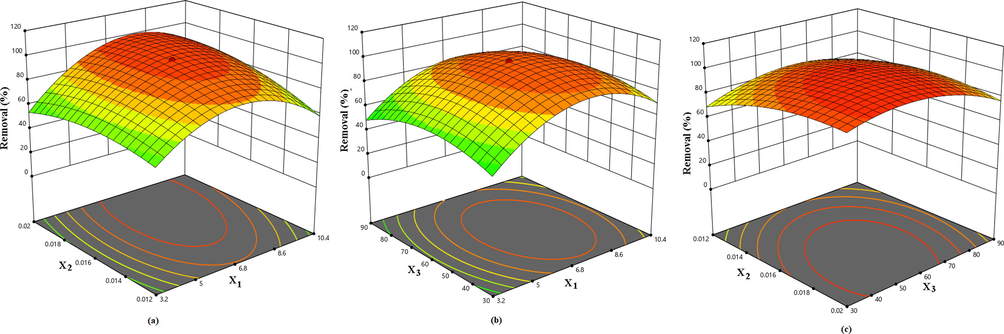
Response surface plots show the effects of (a) pH and adsorbent dose (b), pH and initial concentration (c) and adsorbent dose and initial concentration on the removal of Pb (II) by MPA/HZO.
3.4 Isotherm studies
In order to understand the nature of adsorption, the adsorption data were analyzed by (i) two- parameters isotherm models namely Langmuir, Freundlich, and Temkin and (ii) three- parameters isotherm models such as Redlich-Peterson, and Sips. The nonlinear equations of these isotherm models are given in Table 3. The isotherm parameters were computed using nonlinear regression approach. The error functions such as SSE, SAE,
and Spearman’s correlation coefficient (
were calculated for each isotherm model. where qe: experimental adsorption capacity(mg/g),
: calculated adsorption capacity (mg/g),
equilibrium concentration (mg/L),
: Langmuir isotherm constant (L/mg),
&
are Freundlich isotherm constants,
&
are Temkin isotherm constants related to equilibrium binding constant and adsorption heat, respectively, aR (L/mg) and KR (L/g): the Redlich-Peterson constant, g is the exponent; Ks (L/g) and B (L/g): Sip isotherm constant and α is exponent term, *qe,exp at 307, 312, 317 and 322 K are 128.530, 132.432, 134.897 and 136.231, respectively. Experimental conditions are adsorbent dose = 0.016 g /20 mL; pH = 6.5; contact time 40 min.
Two-parameters isotherm
Tem (K)
Parameters
Error function
model
Non-linear equation
*qe (mg/g)
KF
n
R2
SSE
SAE
rs
Freundlich
307
130.722
62.892
3.827
0.9999
4.805
2.192
0.987
0.037
312
137.167
71.289
4.527
0.9999
22.420
4.735
0.971
0.169
317
139.047
85.370
5.201
0.9999
17.164
4.143
0.896
0.127
322
142.167
98.653
5.984
0.9999
35.236
5.936
0.786
0.258
KL
Langmuir
307
128.498
2.279
0.9999
1.000×10⁻³
0.032
0.999
7.962×10⁻⁶
312
132.412
4.304
0.9999
4.000×10⁻⁴
0.020
0.999
3.024×10⁻⁶
317
134.796
5.621
0.9999
0.012
0.101
0.999
7.562×10⁻⁵
322
136.101
6.987
0.9999
0.017
0.130
0.999
1.241×10⁻⁴
β
AT
Temkin
307
127.925
27.524
28.367
0.9998
2.298
1.516
0.986
0.017
312
130.684
24.362
36.987
0.9998
0.312
0.559
0.997
0.002
317
131.834
20.379
50.347
0.9999
3.470
1.863
0.988
0.025
322
132.729
15.358
70.628
0.9994
0.253
0.502
0.997
0.002
Three-parameters isotherm
Redlich-Peterson
KR
aR
g
307
128.142
8.341
127.397
0.987
0.9998
0.151
0.388
0.999
8.017×10⁻⁴
312
132.106
11.546
131.587
0.925
0.9999
0.106
0.327
0.999
6.132×10⁻⁴
317
134.012
15.375
133.985
0.957
0.9999
0.786
0.887
0.995
0.005
322
135.997
18.342
134.254
0.976
0.9998
0.0547
0.234
0.999
4.019×10⁻⁴
Sips
α
Ks
as
307
129.014
0.532
127.651
0.892
0.9998
0.234
0.481
0.998
0.002
312
132.875
0.501
132.089
0902
0.9997
0.196
0.443
0.999
0.001
317
134.999
0.476
134.582
0.909
0.9999
0.010
0.101
0.999
7.562×10⁻⁵
322
137.296
0.392
136.983
0.913
0.9998
1.132
1.064
0.993
0.0083
Two-parameters isotherm models
Fig. 3 represents Ce versus qe, predicted by nonlinear method, plots for (a) Langmuir, (b) Freundlich and (c) Temkin models at 305, 3010, 315 and 320 K. In case of Langmuir model, the low values of SSE, SAE and
with high rs values (0.999) suggested that Langmuir isotherm equation was fitted well to experimental equilibrium data. On the basis of low error values with high values of rs (0.999), the order of best fit of two-parameters equation was Langmuir > Temkin > Freundlich. The results indicated that the homogeneous surface of MPA/HZO is involved in the uptake of Pb(II). Moreover, a dimensionless constant (RL) was evaluated from the Langmuir isotherm constant (KL) using Eq.(10).
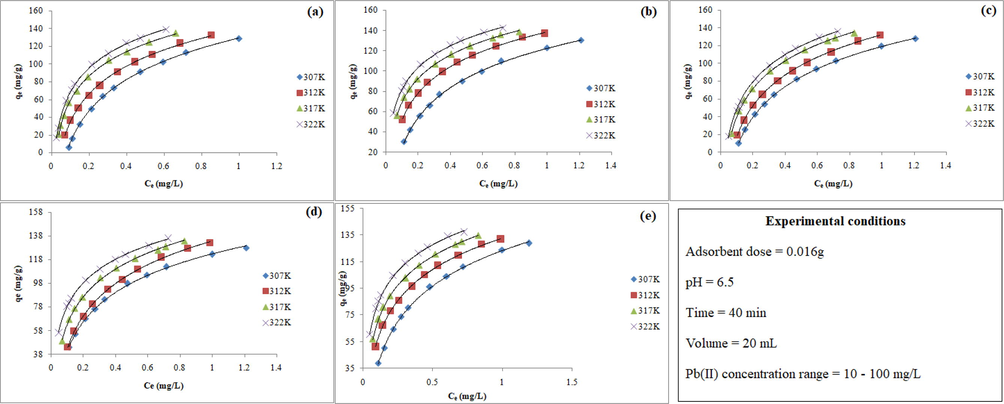
Nonlinear isotherm plots of (a) Langmuir, (b), Freundlich (c) Temkin, (d) Redlich-Peterson, and (e) Sips for the adsorption of Pb (II) onto MPA/HZO.
Three-parameters isotherm models
The Redlich-Peterson isotherm model (Redlich and Peterson, 1959) is a hybrid form of Langmuir and Freundlich isotherm models and applied for both homogenous and heterogeneous systems. The exponent term of Redlich-Peterson (g) should lie between 0 and 1. If the value of g is closed to unity or equal to unity, then Redlich-Peterson isotherm model behave like Langmuir isotherm model (Choi and Lee, 2020). The plots of Redlich-Peterson isotherm model at four different temperatures (305, 310, 315 and 320 K) are presented in Fig. 3d. The high values of rs (>0.99) and low error values (Table 3) confirmed the applicability of this model. Furthermore, the values of exponent terms (g) was very close to unity (0.925–0.987), indicated that the sorption process was most likely occurred on homogeneous surface.
Sips isotherm model (Sips, 1948) is also known as Langmuir–Freundlich isotherm model. At low adsorbate concentration it takes the form of Freundlich model (N’diaye and Kankou, 2020), while at high adsorbate concentration it behaves as Langmuir model., Sips model (Table 3, Fig. 3e) shows low error values with high rs-values (>0.99) at all studied temperatures. The exponent values were found close to unity (0.913–0.892). Further, it is suggested that Langmuir model was the most suitable to describe the adsorption of Pb (II) onto MPA/HZO. It was judged that adsorption of Pb(II) occurred on homogeneous surface with monolayer coverage most preferably as compared to those on heterogeneous surface with multilayear coverage.
3.5 Adsorption kinetics
To gain an insight into mechanism of the uptake of Pb (II) onto MPA/HZO, pseudo-first order, pseudo-second order, Elovich and intraparticle diffusion models were applied to the experimental kinetic data. The kinetic equations of various models are given in Table 4. The suitability and adequacy of the kinetic model was judged on the basis of high Spearman’s correlation coefficient (rs) and low values of error functions. where qe and qt are adsorption capacities of adsorption (mg/g) at equilibrium and time t, respectively. K1; rate constant (min−1) of the model (PFO), k2; PSO rate constant (g/mg/min), α; initial adsorption rate (mg/g min) and β; desorption constant (mg/g) and activation energy for chemisorption, *PSO and PFO are the abbreviation of pseudo-first order and pseudo -second order kinetic models, respectively. **qe, exp at 305, 310, 315 and 320 K are 27.035, 30.078, 33.723 and 36.347, respectively. Experimental conditions are Co = 30 mg/L; adsorbent dose = 0.016 g /20 mL; pH = 6.8.
Kinetic models*
Non-linear equation
Temp (K)
Parameters
Error Values
**qe (mg/g)
k1
R2
SSE
SAE
rs
PFO
307
25.623
0.059
0.9991
1.993
1.412
0.762
0.073
312
28.348
0.072
0.9994
2.992
1.73
0.714
0.992
317
32.371
0.098
0.9990
1.827
1.352
0.797
0.054
322
35.067
0.121
0.9991
1.638
1.280
0.849
0.049
k2
PSO
307
27.001
0.002
0.9999
0.001
0.034
0.999
4.274 × 10⁻⁵
312
30.040
0.004
0.9999
0.001
0.038
0.999
4.800 × 10⁻⁵
317
33.702
0.008
0.9999
4.410 × 10⁻⁴
0.021
0.999
1.307 × 10⁻⁵
322
36.339
0.012
0.9999
3.240 × 10⁻⁵
0.018
0.999
8.901 × 10⁻⁶
α
β
Elovich
307
27.274
139.324
0.268
0.9999
0.057
0.239
0.996
0.002
312
30.330
248.960
0.259
0.9999
0.063
0.252
0.993
0.002
317
33.914
298.642
0.234
0.9999
0.036
0.191
0.997
0.001
322
36.435
387.963
0.221
0.9999
0.007
0.088
0.999
2.130 × 10⁻⁴
3.5.1 Surface based kinetics
The pseudo-second order kinetic model (Fig. 4a) exhibited lower values of error functions with high rs-values (0.9991–0.9995) as compared to those obtained for the pseudo-first order kinetic model (Fig. 4b) at all studied temperatures. Furthermore, the value of rate constants (both pseudo first and pseudo second order kinetic models) increases with increasing temperatures, suggested that the mobility of Pb(II) was- increased with rise in temperature. Therefore, the results recommended that the adsorption of Pb(II) onto MPA/HZO might be chemisorption. To confirm the chemisorption behaviour of the adsorption process, the experimental data were further examined by Elovich model (Fig. 4c). As can be seen in the Table 4, Elovich model exhibits low error and high rs-values (0.9979–0.9991) at all studied temperatures and hence, illustrated that chemisorption also takes place in addition to ion exchange. The value of α increases with increasing the temperature whereas a slight change was observed in case of β, suggested that the sorption rate of Pb(II) onto MPA/HZO was increased with increasing the temperature but the desorption process was negligibly affected.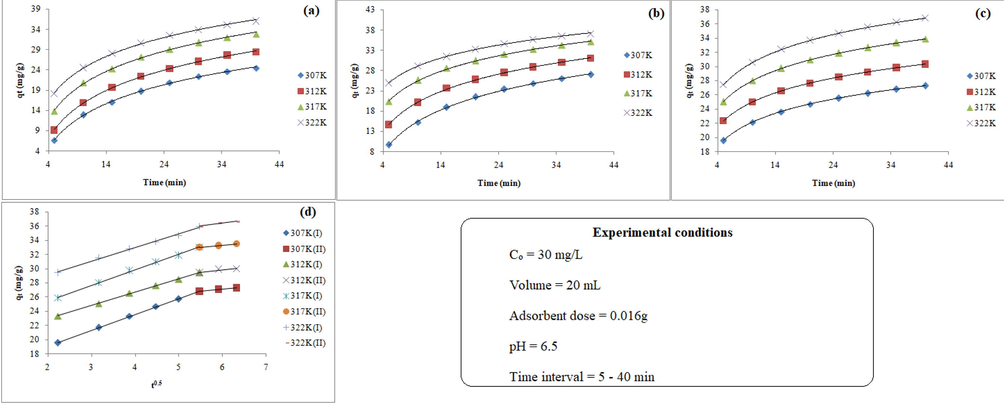
Noninear kinetic plots of (a) pseudo-first order, (b) pseudo second order (c) Elovich models and (d) plots of Weber-Morris intraparticle diffusion model for the adsorption of Pb(II) onto MPA/HZO.
3.5.2 Diffusion based kinetics
The diffusion mechanism of Pb(II) into MPA/HZO was investigated by using Weber-Morris intrapartcle diffusion model. The plots of qt vs t0.5 (Fig. 4e) showed two distinct linear segments (I and II) suggesting that two stages were involved during the sorption process. The first linear portion (stage I) shows that the adsorption rate was rapid upto 25 min which was due to external surface adsorption (boundary-layer diffusion) from aqueous phase to surface of the adsorbent. Second linear portion (stage II) shows the slow adsorption rate which pointed towards intraprticle diffusion. The values of intraparticle diffusion constant (kid) and the boundary layer thickness (Cid) were calculated from the slope and intercept of the intraparticle diffusion plots. It is evident from the Table 5 that the value of Kid decreases in the first stage whereas increases in second stage with increasing temperature. The contribution of boundary layer (Cid) increased during the mass transfer and decreased during the intraparticle duffusion with increasing the temperature. Therefore, it is concluded that during the mass transfer the sorption of Pb(II) can be controlled by two mechanisms: external surface adsorption (boundary-layer diffusion); and intraparticle diffusion. where kid and Cid are intraparticle diffusion constant and the mass transfer across the boundary layer constant, respectively.
Diffusion model
Equation
Plot
Temperature (K)
Parameters
Linear portion
Kid
Cid
R2
Intraparticle diffusion
qt vs t0.5
307
I
2.234
14.610
0.999
II
0.559
23.741
0.997
312
I
2.194
19.153
0.997
II
0.609
25.701
0.998
317
I
1.907
21.042
0.999
II
0.690
29.364
0.995
322
I
1.883
25.324
0.998
II
0.822
29.698
0.997
4 Conclusions
MPA/HZO was synthesized and used as sorbent for Pb(II) removal. Under the optimum conditions (pH: 6.8; adsorbent dose: 0.016 g; initial Pb(II) concentration: 60 mg/L), 99.37% Pb(II) was removed from the aqueous solution. The experimental equilibrium data were analyzed by two- and three- parameters isotherm models using nonlinear regression analysis.
High values of Spearman’s correlation coefficient (rs) and low values of various statistical error functions suggested that Langmuir isotherm was the best fitted model followed by Temkin and Freundlich isotherm models in case of two-parameters models. In case of three-parameters model, fitting of the experimental data followed the order Redlich-Peterson > Sips. The kinetic data followed the pseudo second order model. Therefore, it is concluded that MPA/HZO could be a potential and efficient adsorbent in the remediation of Pb(II) from contaminated water.
Acknowledgments
The authors extend their appreciation to the Deputyship for Research & Innovation, “Ministry of Education” in Saudi Arabia for funding this research work through the project number IFKSURG-1435-010.
Declaration of Competing Interest
The authors declare that they have no known competing financial interests or personal relationships that could have appeared to influence the work reported in this paper.
References
- Efficient removal of toxic metal ions (Pb(II) and Hg(II) ions in single component systems by adsorption on Romanian clay material. Rev. Chim.. 2020;71:37-47.
- [CrossRef] [Google Scholar]
- Adsorptive removal of Pb(II) ions from groundwater samples in Oman using carbonized Phoenix dactylifera seed (Date stone) J. King Saud University – Sci.. 2020;32(7):2931-2938.
- [CrossRef] [Google Scholar]
- Remediation of lead-contaminated water by virgin coniferous wood biochar adsorbent: batch and column application. Water Air Soil Pollut.. 2020;231:171-186.
- [CrossRef] [Google Scholar]
- Removal of metals (Pb, Cd, Cu, Cr, Ni, and Co) from drinking water by oxidation-coagulation-absorption at optimized pH. J. Water Process Eng.. 2019;31:100839.
- [CrossRef] [Google Scholar]
- Adsorption of Lead(II) from Aqueous Solution by Using Leaves of Date Trees As an Adsorbent. J. Chem. Eng. Data. 2011;56(5):1804-1812.
- [CrossRef] [Google Scholar]
- Adsorption kinetic and isotherm characteristics of Mn ions with zeolitic materials synthesized from industrial solid waste. J. Environ. Sci. Int.. 2020;29:827-835.
- [Google Scholar]
- Synthesis, characterization, and analytical application of zirconium(IV) selenoiodate, a new cation exchanger. Anal Bioanal Chem. 2005;381(2):471-476.
- [CrossRef] [Google Scholar]
- Adsorption behavior of Hg(II), Pb(II), and Cd(II) from aqueous solution on Duolite C-433: a synthetic resin. J. Colloid Interface Sci.. 2004;275(2):398-402.
- [CrossRef] [Google Scholar]
- Recovery of Pb and Zn from a citrate leach liquor of a roasted EAF dust using precipitation and solvent extraction. Sep. Purif. Technol.. 2020;236:116264.
- [CrossRef] [Google Scholar]
- Introductory of Microsoft Excel SOLVER function spread sheet method for isotherm and kinetics modelling of matelsbiosorption in watstewater. J. Water Sustainability. 2013;3:223-227.
- [Google Scholar]
- Construction of a Lignosulfonate–Lysine Hydrogel for the Adsorption of Heavy Metal Ions. J. Agric. Food Chem.. 2020;68(10):3050-3060.
- [CrossRef] [Google Scholar]
- Lead toxicity: health hazards, influence on food chain, and sustainable remediation approaches. Int. J. Environ. Res. Public Health. 2020;17:2179.
- [CrossRef] [Google Scholar]
- Synthesis, Characterization and Sorption Characteristics of a Fibrous Organic—Inorganic Composite Material. Adv. Sci. Lett.. 2012;17(1):136-142.
- [CrossRef] [Google Scholar]
- Zirconium(IV) Phosphosulphosalicylate as an Important Lead(II) Selective Ion-Exchange Material: Synthesis, Characterization and Adsorption Study. Adv. Sci. Lett.. 2012;17(1):184-190.
- [CrossRef] [Google Scholar]
- Melt processing of polypropylenegrafted-maleic anhydride/chitosan polymer blend functionalized with montmorillonite for the removal of lead ions from aqueous solutions. Sci. Rep.. 2020;10:217-231.
- [CrossRef] [Google Scholar]
- Modeling of adsorption isotherms of pharmaceutical products onto various adsorbents: A Short Review. J. Mater. Environ. Sci.. 2020;11:1264-1276.
- [Google Scholar]
- Effective removal of Pb(II) ions by electrospun PAN/sago lignin-based activated carbon nanofibers. Molecules. 2020;25:3081.
- [CrossRef] [Google Scholar]
- Equilibrium Modeling, Kinetic, and Thermodynamic Studies on Adsorption of Pb(II) by a Hybrid Inorganic–Organic Material: Polyacrylamide Zirconium(IV) Iodate. Ind. Eng. Chem. Res.. 2014;53:8198-8207.
- [Google Scholar]
- Cyclic tetra[(indolyl)-tetra methyl]-diethane-1,2-diamine (CTet) impregnated hydrous zirconium oxide as a novel hybrid material for enhanced removal of fluoride from water samples. RSC Adv.. 2015;5:39062-39074.
- [Google Scholar]
- Synthesis and characterization of polyacrylamide zirconium(IV) iodate ion exchanger. Its application of selective removal of lead (II) from wastewater. Arabian J. Chem.. 2017;10:S1765-S1773.
- [CrossRef] [Google Scholar]
- Application of Box–Behnken design and desirability function in the optimization of Cd(II) removal from aqueous solution using poly(o-phenylenediamine)/hydrous zirconium oxide composite: equilibrium modeling, kinetic and thermodynamic studies. Environ Sci Pollut Res. 2018;25:26114-26134.
- [Google Scholar]
- N -(((2-((2-Aminoethyl)amino)ethyl)amino)methyl)-4-sulfamoylbenzamide Impregnated Hydrous Zirconium Oxide as a Novel Adsorbent for Removal of Ni(II) from Aqueous Solutions: Optimization of Variables Using Central Composite Design. ACS Omega. 2019;4:2823-2832.
- [Google Scholar]
- Experimental design approach for optimization of Pb(II) removal from aqueous solution using poly-o-toluidine/stannic(IV) triethanolamine as adsorbent. Environ. Technol. Innovation. 2020;17:100634.
- [Google Scholar]
- Efficient removal of Pb(II) from water using silica gel functionalized with thiosalicyclic acid: Response surface methodology for optimization. J. King Saud Univ. Sci.. 2021;33:101232.
- [Google Scholar]
- Facile synthesis of thiosalicylic acid functionalized silica gel for effective removal of Cr(III): Equilibrium modeling, kinetic and thermodynamic studies. Environ. Nanotechnol. Monit. Manage.. 2020;14:100353.
- [CrossRef] [Google Scholar]
- Effective removal of acetaminophen from aqueous solution using Ca (II)-doped chitosan/β-cyclodextrin composite. J. Mol. Liq.. 2020;301:112454.
- [CrossRef] [Google Scholar]
- Assessment of ampicillin removal efficiency from aqueous solution by polydopamine/zirconium(IV) iodate: optimization by response surface methodology. RSC Adv.. 2020;10:20322-20337.
- [CrossRef] [Google Scholar]
- Factors influencing the surface functionalization of citrate stabilized gold nanoparticles with cysteamine, 3-mercaptopropionic acid or L-selenocystine for sensor applications. Chemosensors. 2020;8:80.
- [CrossRef] [Google Scholar]
- Infrared characteristic group frequencies. New York: John Wiley & Sons:; 1980. p. :112.
- Reverse osmosis removal of heavy metals from wastewater effluents using biowaste materials. Pol. J. Environ. Stud.. 2019;28:337-341.
- [CrossRef] [Google Scholar]
- Guidelines for drinking-water quality. Geneva: Fourth edition incorporating the first addendum; 2017.
- Removal of heavy metals in aquatic environment by graphene oxide composites: a review. Environ Sci Pollut Res. 2020;27:190-209.
- [CrossRef] [Google Scholar]
- Adsorptive removal of phosphate ions from aqueous solution using zirconia-functionalized graphite oxide. Chem. Eng. J.. 2013;221:193-203.
- [CrossRef] [Google Scholar]
Appendix A
Supplementary data
Supplementary data to this article can be found online at https://doi.org/10.1016/j.jksus.2020.101280.
Appendix A
Supplementary data
The following are the Supplementary data to this article:


