

Translate this page into:
Study of a new piperidone as an anti-Alzheimer agent: Molecular docking, electronic and intermolecular interaction investigations by DFT method
⁎Corresponding authors. rarulraj108@gmail.com (Arulraj Ramalingam), omar@ksu.edu.sa (Omar Al-Dossary), issaoui_noureddine@yahoo.fr (Noureddine Issaoui)
-
Received: ,
Accepted: ,
This article was originally published by Elsevier and was migrated to Scientific Scholar after the change of Publisher.
Peer review under responsibility of King Saud University.
Abstract
Abstract
Experimental spectroscopic and theoretical calculation were performed. The non-covalent interactions were investigated. Molecular electrostatic potential, NLO, and NBO studies were performed. Molecular docking study show the inhibitors in treating Alzheimer's diseases.
Abstract
In this work, experimental spectroscopic and theoretical methods as quantum chemical calculation were performed for 3-chloro-r(2),c(6)-bis(4-fluorophenyl)-3-methylpiperidin-4-one (abbreviated as CFMP). The CFMP was synthesized and analysed using FT-IR, 1H NMR, 13C NMR, and UV–Vis spectroscopy. Standard functional B3LYP/6–311++G(d,p) density functional theory (DFT) calculations were utilized for the CFMP compound. Molecular electrostatic potential, non-linear optical, and natural bond orbital studies were performed. The charge transfer inside the molecule was demonstrated using HOMO-LUMO energy calculations and Mulliken atomic charges. The vibrational frequency was computed using the DFT/B3LYP/6–311++G(d,p) method. The non-covalent interactions were investigated using the Hirshfeld surface analysis. Furthermore, molecular docking was studied to discover novel inhibitors and drugs in treating Alzheimer's diseases. Further, docking studies were performed to predict and describe the interactions of four proteins with the ligand. This result demonstrates that the CFMP has an inhibitor effect against Alzheimer's diseases.
Keywords
DFT
Vibrational spectra
Hirshfeld surface analysis
Fingerprint plots
Molecular docking study
Anti-Alzheimer

1 Introduction
High-profile biological activity molecules are present in piperidine-4-ones and their derivatives. Its biological functions, piperidone, and its derivatives are commonly synthesis in the pharmacological industry (Soldatenkov et al., 2003). These compounds have essential structural properties like anti-bacterial, anti-fungal, anticancer, anti-tuberchlostic, anti-oxidant, anti-inflammatory, depressant and central nervous system antitumor (Rameshkumar et al., 2003; Aeluri et al., 2012). Earlier studies have shown that biological activity in piperidone systems with aromatic substitutions is important in positions 2-and/or 6 (Prostakov and Gaivoronskaya, 1978). A chair conformation is generally adopted by 2,6 disubstituted piperidine-4-one compounds (Anitha et al., 2020; Arulraj et al., 2016; Arulraj et al., 2016), although the conformation can change depending on the phenyl ring substitution (Arulraj et al., 2017; Arulraj et al., 2016; Rajkumar et al., 2018). Substituted piperidine-4-one, on the other hand, considerably aided the study of computational characteristics accessible for these compounds (Arulraj et al., 2020; Ramalingam et al., 2021). On structures such as large organic molecules, DFT calculations provide precise result (Arulraj et al., 2020). Quantum chemical simulations can provide vital information on the vibrational spectrum, molecule characteristics, and functionalities.
In this regard, our research team resolved to develop novel piperidine based medicines. The p-fluorophenyl group is incorporated into the piperidine ring at the 2 and 6-position, and the research is extended to 3-chloro-r(2),c(6)-bis(4-fluorophenyl)-3-methylpiperidin-4-one [CFMP], C18H16ClF2NO. The theoretically calculated optimized molecular geometry of CFMP compared with molecular geometric parameters of X-ray diffraction.The energy gap (ΔE), molecule electrostatic potential, and HOMO-LUMO were all calculated and discussed.Vibrational frequencies were determined using molecular structural optimization and standard coordinate force field measurements based on the DFT/B3LYP/6–31++G(d,p) method. The complete vibrational assessment of the vibrational spectra of the CFMP compound was explored by the potential energy distribution (PED). Furthermore, in our work we are focused on the treatment of Alzheimer based on the inhibitions of the four proteins VEGFR2, hAChE, DRD2 and DHFR. These proteins are described in the literature as potential inhibitors of the treatment of Alzheimer. Herein, we have docked these proteins with the ligand CFMP using the MOE.2015.10 program.
2 Computation and experimentation
2.1 General
2.1.1 IR spectra
The IR spectra were collected using a PerkinElmer Frontier FT-IR spectrophotometer. The synthesized crystal compounds were powdered with potassium bromide, and the diffuse reflectance technique was used to capture the spectra.
2.1.2 1H NMR spectrum
The proton NMR spectrum was captured using a Bruker 400 MHz NMR spectrometer adjusted at 400 MHz. To make the samples, dissolve 20 mg of the compounds in 0.5 ml of CDCl3 containing 0.03 percent TMS and the spectral parameters, 16 scans were used.
2.1.3 13C NMR spectrum
Proton decoupled 13C NMR spectra were captured using a Bruker 400 MHz spectrometer set to 100 MHz. Spectra were measured using solutions made by dissolving 20 mg of the substance in 0.5 ml of CDCl3 adding a few drops of TMS as an internal reference. A number of scans, 1024, are utilized as spectral parameters.
2.1.4 UV–visible spectra
UV–visible spectra were measured quantitatively using a Varian, 5000 spectrophotometers.The spectral sample was prepared by dissolving 20 mg of the analyte in 5.0 ml of pure ethanol. 175 nm to 3300 nm wavelength range; maximum absorption 8 (abs); resolution 0.1 nm.
2.1.5 Theoretical studies
The Gaussian 09 software was utilized to do the theoretical computations (Frisch, et al., 2009), using the 6–311++G(d,p) basis set and the DFT theory with the hybrid functional B3LYP. The molecular visualization software GaussView was used (Dennington et al., 2009). All of the computations have resulted in an optimized geometry with the lowest energy.The optimized geometries exhibited positive vibrational frequencies, showing that they were stable.Vibrational assignments were determined using the VEDA4 software (Jamroz and Analysis, 2004) while accounting for possible energy distribution components (PED) ≥ 10%. The band assignments were confirmed using the GaussView program. Inside this study, NBO simulations were utilized to calculate the energies of intermolecular interactions. In order to investigated the biological activities of our molecule, a molecular docking was carried out. The X-ray crystal structure and structural data for the proteins have been deposited in Protein Databank (rcsb, xxxx) and imported into the modeling program Molecular Operating Environment (MOE) (Environment, 2015). The drawn picture of proteins-ligand is minimized and build in MOE using the MMFF94 force field Scheme 1.![Synthetic scheme of 3-chloro-r(2),c(6)-bis(4-fluorophenyl)-3-methylpiperidin-4-one [CFMP].](/content/185/2021/33/8/img/10.1016_j.jksus.2021.101632-fig2.png)
Synthetic scheme of 3-chloro-r(2),c(6)-bis(4-fluorophenyl)-3-methylpiperidin-4-one [CFMP].
2.2 Synthesis of 3-chloro-r(2),c(6)-bis(4-fluorophenyl)-3-methylpiperidin-4-one
Arulraj et al. described the synthesis of the CFMP molecule (C18H16ClF2NO) (Arulraj et al., 2016) 0.3-chloro-2-butanone, p-flurobenzaldehyde, and ammonium acetate are obtained with 99 percent purity from Sigma-Aldrich chemical manufacturer and utilized as such any additional refining.A composition of 0.1 mol, ammonium acetate, 0.2 mol, p-flurobenzaldehyde, and 20.4 ml, 3-chloro-2-butanone in ethanol was gently heated at room temperature. After allowing it to cool to ambient temperature, we obtained the colloidal suspension, which is dissolved in diethyl ether (250 ml). The dissolved solution is mixing with 100 ml concentrated HCl. The solidified hydrochloride of 3-chloro-r(2),c(6)-bis(4-fluorophenyl)-3-methylpiperidin-4-one was extracted by filtering and rinsed with a 1:1 mixture of ethanol and diethyl ether. The yellowish-based solution was extracted from an alcoholic solution was prepared by addition of a quantity of aqueous ammonia equal to 30 ml. The solution was diluted with 200 ml distilled water. The portion of crude sample was dissolved in absolute alcohol (100 ml), warmed till the sample dissolved, and animal charcoal (2.0 g) was added to the resulted solution. The heated solution was filtered using Whatman filter paper to achieve a pure solution. The filtered solutions were allowed to settle down for 48 h. The newly formed white crystals are carefully gathered.
13C NMR (CDCl3, 500 MHz): 21.93 (methyl carbon), 45.25 (C-5 carbon), 60.52 (C-6 carbon), 68.85 (C-2 carbon), 71.58 (C-3 carbon), 137.87–114.85 aromatic carbons, 163.92, 163.44, 161.95, 161.48 aromatic carbons (ipso), 201.97 (C = O); 1H NMR (500 MHz, CDCl3): 1.42 (CH3 proton, s), 2.07 (NH proton, s), 2.53–2.49 (dd, H(5a) proton), 3.45–3.40 (dd, H(5e) proton), 3.94 (H(2) proton, s), 4.06–4.03 (H(6) proton, dd), 7.54–7.03 (Aromatic protons, m). Melting point 136.1 °C.Elemental analysis: C: 64.28 (64.39); H: 4.76 (4.80); N: 4.05 (4.17)
3 Results and discussion
3.1 Conformational and molecular geometric analysis
Piperidin-4-one chair conformers are the most stable conformers. It will have two chair conformations that vary in the NH group's axial (A) and equatorial (E) orientations (Sivakumar and Manimekalai, 2011). The chair conformer's equatorial type of NH is perhaps the more stable in the piperidin-4-one molecule. For the CFMP compound, a comprehensive conformational study was investigated to find the most stable conformers. The computational calculations were performed to evaluate the CFMP molecule, and then DFT method was utilized to optimize the overall geometry of these structures.
Arulraj et al (Arulraj et al., 2016) [CCDC: 1508672] described the single-crystal structure of synthesized 3-chloro-r(2),c(6)-bis(4-fluorophenyl)-3-methylpiperidin-4-one [CFMP]. Distorted chair conformation shows in the piperidine-4-one ring of CFMP molecule, [puckering parameters and φ, θ and Q = 182.7 (19)°, 166.5 (4)°, and0.548 (4)Å, respectively], except for chlorine, all substituents have an equatorial orientation. The experimental analysis shows that the mean planes of two fluoro-substituent attached in the benzene rings have a dihedral angle of 49.3 (3)°. The Molecular geometric structure of CFMP as determined using DFT/B3LYP/6–311++G(d,p) level as shown in Fig. 1a. Table 1 shows the bond lengths, angles of the XRD analysis by experimentally and Optimised DFT of CFMP structure. The theoretically predicted structural parameters are much nearer to the values obtained from XRD observations.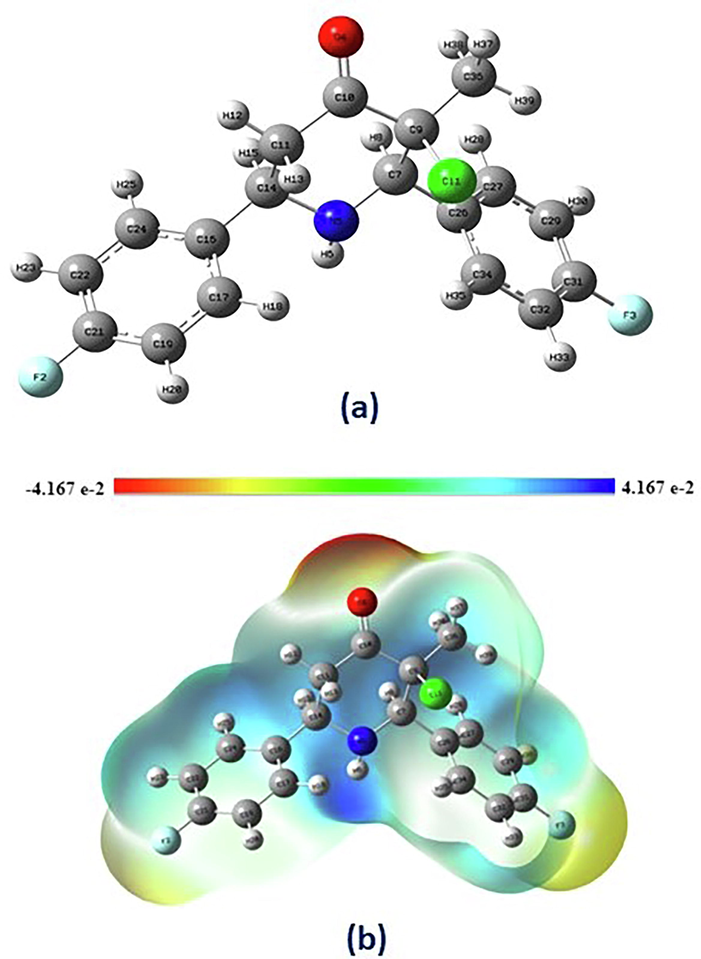
a & b: a) Molecular geometric structure of CFMP obtained by DFT/B3LYP/6–311++G(d,p) level. b) The molecular electrostatic potential (MEP) of CFMP.
Bond lengths (A°)
Bond angles (°)
Atom position
B3LYP/6–311++G(d. p)
Exp.
Atom position
B3LYP/6–311++G(d. p)
Exp.
Cl1-C9
1.8478
1.824(4)
H6-N5-C7
109.5327
–
F2-C21
1.3554
1.360(6)
H6-N5-C14
110.2056
–
F3-C31
1.355
1.359(5)
C7-N5- C14
114.1742
–
O4-C10
1.2085
1.213(5)
N5-C7-H8
110.8407
–
N5-H6
1.0147
0.860
N5-C7-C9
110.5563
–
N5-C7
1.4621
1.457(5)
N5-C7-C26
110.5328
–
N5-C14
1.4658
1.462(5)
H8-C7-C9
102.579
–
C7-H8
1.1071
1.000
H8-C7-C26
106.8351
–
C7-C9
1.5625
1.549(4)
C9-C7- C26
115.1428
–
C7-C26
1.518
1.506(5)
Cl1-C9-C7
111.1394
–
C9-C10
1.5488
1.535(6)
Cl1-C9-C10
104.628
–
C9-C36
1.5194
1.514(6)
Cl1-C9-C36
107.8975
–
C10-C11
1.5137
1.495(6)
C7-C9-C10
108.0668
–
C11-H12
1.0904
0.990
C7-C9-C36
112.9607
112.7(3)
C11-H13
1.0929
0.990
C10-C9-C36
111.8533
112.4(3)
C11-C14
1.5475
1.551(6)
O4-C10-C9
120.8978
120.1(3)
C14-H15
1.1046
1.377(7)
O4-C10-C11
122.984
123.5(4)
C14-C16
1.5166
1.505(6)
C9-C10-C11
116.026
116.4(3)
C16-C17
1.4003
1.384(6)
C10-C11-H12
108.5479
109.1
C16-C24
1.3971
1.390(6)
C10-C11-H13
109.0865
109.2
C17-H18
1.0836
0.950
C10-C11-C14
110.4843
112.1(3)
C17-C19
1.3919
1.378(7)
H12-C11-H13
109.0165
107.9
C19-H20
1.083
0.951
H12-C11-C14
111.0924
109.1
C19-C21
1.387
1.376(7)
H13-C11-C14
108.579
109.2
C21-C22
1.3846
1.362(8)
N5-C14-C11
108.2712
108.4(3)
C22-H23
1.0828
0.950
N5-C14-H15
111.0703
108.9
C22-C24
1.3943
1.387(7)
N5-C14-C16
110.7981
110.8(3)
C24-H25
1.0851
0.950
C11-C14-H15
107.2553
109.0
C26-C27
1.3988
1.397(6)
C11-C14-C16
111.8174
110.6(3)
C26-C34
1.4004
1.393(5)
H15-C14-C16
107.5921
109.0
C27-H28
1.0848
0.949
C14-C16-C17
120.8598
120.6(4)
C27-C29
1.3932
1.372(6)
C14-C16-C24
120.4023
121.1(4)
C29-H30
1.0828
0.949
C17-C16-C24
118.729
118.3(4)
C29-C31
1.3852
1.377(7)
C16-C17-H18
119.4289
119.6
C31-C32
1.3859
1.368(6)
C16-C17-C19
120.9175
120.8(4)
C32-H33
1.0829
0.950
H18-C17-C19
119.6513
119.6
C32-C34
1.3924
1.384(6)
C17-C19-H20
121.6556
120.7
C34-H35
1.0815
0.949
C17-C19-C21
118.5872
118.7(5)
C36-H37
1.0888
0.980
H20-C19-C21
119.7573
120.6
C36-H38
1.0934
0.980
F2-C21-C19
118.8462
118.4(4)
C36-H39
1.0897
0.980
F2-C21-C22
118.9128
119.0(5)
C19-C21-C22
122.2405
122.6(5)
C21-C22-H23
119.9305
120.9
C21-C22-C24
118.3521
118.3(5)
H23-C22-C24
121.7165
120.8
C16-C24-C22
121.1726
121.3(4)
C16-C24-H25
119.7035
119.3
C22-C24-H25
119.1239
119.4
C7-C26-C27
120.0877
121.0(3)
C7-C26-C34
121.3018
120.7(3)
C27-C26-C34
118.5992
118.2(4)
C26-C27-H28
119.7829
119.3
C26-C27-C29
121.2869
121.4(4)
H28-C27-C29
118.9295
119.3
C27-C29-H30
121.7052
120.7
C27-C29-C31
118.3229
118.4(4)
H30-C29-C31
119.97
120.8
F3-C31-C29
118.8704
119.3(4)
F3-C31-C32
118.9311
118.4(4)
C29-C31-C32
122.1968
122.4(4)
C31-C32-H33
119.7829
120.6
C31-C32-C34
118.6948
118.8(4)
H33-C32-C34
121.5223
120.6
C26-C34-C32
120.8942
120.8(4)
C26-C34-H35
119.4553
119.6
C32-C34-H35
119.6504
119.6
C9-C36-H37
110.2216
109.4
C9-C36-H38
109.8612
109.4
C9-C36-H39
110.5695
109.5
H37-C36-H38
107.6428
109.5
H37-C36-H39
109.4084
109.4
H38-C36-H39
109.0786
109.5
3.2 Molecular electrostatic potential investigation
The MEP is a useful characteristic for determining a molecule's reactivity (Romani et al., 2020). It allows for the identification of nucleophilic and electrophilic sites that enhance hydrogen bond formation. The nucleophilic site implies a strong attraction, whereas the electrophilic site indicates a strong repulsion. (Scrocco and Tomasi, 1978). The Molecular electrostatic potential of 3-chloro-r(2),c(6)-bis(4-fluorophenyl)-3-methylpiperidin-4-one (CFMP) and the 3D graphical surface have been developed and are shown in Fig. 1b. The MEP at the B3LYP/6–311++G(d,p) approach was computed to predict reactive sites for nucleophilic and electrophilic interactions on CFMP. In the sequence, the electrical potential diminishes: blue < yellow < orange < red. We can distinguish the electrophilic and nucleophilic sites of a molecule using these different colors. Further investigation indicates that the piperidin-4-one ring with in chemical structure has a red (negative charge) area that is sensitive to electrophilic attack.The color codes for these surfaces vary from −4.167e-2 (red color) to 4.167e-2 (blue color) (blue color). The extremely positive area is represented by the blue color zone observed surrounding the nitrogen atom. These findings might help to understand hydrogen bonding inside the molecule.
3.3 Analysis of natural bond order
NBO is the efficient approach for analyzing and identifying the particular bonds and energy connected with electrons of a single pair electrons, which are incredibly meaningful in physicochemical processes (Weinhold, 2001). This technique resulted in electronic exchanges, hydrogen bonding among donor–acceptor molecules, and interactions of hyperconjugative. The energy difference between interacting orbitals might be used to calculate the interaction energy among acceptor and donor electrons, as well as the overall stability of orbital interactions. Calculating the second-order stabilization energy E(2) can help you figure out which interaction is the most stable.
Where εi and εj represent the diagonal elements of orbital energies, qi represents the occupancy of the εi orbital, and F(i,j) represents the Fock matrix member outside diagonal. The intensity of the interaction between both the donor and the electron acceptor seems directly proportional to the size of E(2) energy; the greater the magnitude of E(2), the stronger the interaction between both the donor and the electron acceptor. The CFMP computed findings are tabulated in Table 2. In this work, the stabilizing energy E(2) is related to hyper conjugative interactions, LP(2) → π(C16−C24) → π*(C17−C19) and π(C16−C24) → π*(C21−C22), is determined to be 21.34 and 19.26 kJ/mol, respectively. Anti-bonding orbitals of its acceptor π*(C26−C27) and π*(C32–C34), the bond π(C29–C31) stabilizes the energy of 21.19 and 18.11 kJ/mol, respectively. The intramolecular hyperconjugative contacts are caused by the overlap of the π(C−C) and π*(C−C) orbitals, resulting in intramolecular charge transfer within the molecular system (Arulraj, 2022). According to our calculations, the E(2) energy between π(C29–C31) and π*(C32–C34) is about 18.11 kJ/mol. Likewise, the π–π* interaction of C26−C27 → C32−C34, C26−C27 → C29−C31, C32−C34 → C26−C27, and C32−C34 → C26−C27 and C32−C34 → C29−C31 bonds exhibited lower electron densities than phenyl rings with the highest hyperconjugative interaction energy E(2). The NBO characteristic of the CFMP molecule was caused by the polarized mobility of the π–electron cloud inside the molecule and internal charge transfer.
Donor (i)
Acceptor (j)
E(2) kcal/mol
E(j)-E(i) (a.u)
F(i. j) (a.u)
σ (C7-H8)
σ*(Cl1-C9)
7.16
0.59
0.058
σ (C7-H8)
σ*(C26-C34)
4.39
1.07
0.061
σ (C11-H13)
π*(O4-C10)
6.43
0.52
0.052
σ (C14-H15)
σ*(C16-C17)
4.45
1.07
0.062
π (C16-C24)
π *(C17-C19)
21.34
0.28
0.069
π (C16-C24)
π *(C21-C22)
19.26
0.27
0.065
σ (C17-H18)
σ*(C16-C24)
4.80
1.09
0.065
σ (C17-C19)
σ (F2-C21)
4.26
0.97
0.057
π (C17-C19)
π *(C16-C24)
19.26
0.29
0.067
π (C17-C19)
π *(C21-C22)
23.00
0.28
0.072
σ (C19-C21)
σ*(C21-C22)
4.10
1.28
0.065
σ (C21-C22)
σ*(C19-C21)
4.10
1.28
0.065
π (C21-C22)
π *(C16-C24)
20.58
0.30
0.070
π (C21-C22)
π *(C17-C19)
18.47
0.30
0.066
σ (C22-C24)
σ*(F2-C21)
4.32
0.97
0.058
σ (C24-H25)
σ*(C16-C17)
4.81
1.09
0.065
π (C26-C27)
π *(C29-C31)
18.87
0.28
0.065
π (C26-C27)
π *(C32-C34)
21.62
0.29
0.070
σ (C27-H28)
σ*(C26-C34)
4.77
1.09
0.065
σ (C27-C29)
σ*(F3-C31)
4.28
0.97
0.058
σ (C29-C31)
σ*(C31-C32)
4.08
1.28
0.065
π (C29-C31)
π *(C26-C27)
21.19
0.30
0.071
π (C29-C31)
π *(C32-C34)
18.11
0.30
0.066
σ (C31-C32)
σ*(C29-C31)
4.09
1.28
0.065
σ (C32-C34)
σ*(F3-C31)
4.28
0.97
0.057
π (C32-C34)
π *(C26-C27)
19.18
0.28
0.066
π (C32-C34)
π *(C29-C31)
23.85
0.27
0.073
σ (C34-H35)
σ*(C26-C27)
4.86
1.08
0.065
σ (C36-H37)
σ*(C7-C9)
4.33
0.82
0.054
σ (C36-H38)
σ*(Cl1-C9)
6.61
0.58
0.056
LP2 (F2)
σ*(C19-C21)
5.88
0.97
0.068
LP2 (F2)
σ*(C21-C22)
5.89
0.98
0.068
LP3 (F2)
π *(C21-C22)
18.08
0.43
0.085
LP2 (F3)
σ*(C29-C31)
5.90
0.98
0.068
LP2 (F3)
σ*(C31-C32)
5.88
0.98
0.068
LP3 (F3)
π *(C29-C31)
18.16
0.43
0.086
LP2 (O4)
σ*(C9-C10)
22.48
0.62
0.106
LP2 (O4)
σ*(C10-C11)
19.29
0.67
0.103
LP1 (N5)
σ*(C7-H8)
8.05
0.67
0.067
LP1 (N5)
σ*(C14-H15)
7.63
0.68
0.065
π*(C21-C22)
π *(C16-C24)
248.55
0.01
0.081
3.4 Non-linear optical properties
The study of how a material's optical properties change when it is subjected to high-intensity radiation is known as nonlinear optics (NLO). These characteristics properties are applied in a wide range of areas, including medical, data processing and storage, sensors, and so on.The values of hyperpolarizability and polarizability are important for determining optical connections and interactions. (Prasad and Williams, 1991). Table S1 shows the optical characteristics of several materials, including the hyperpolarizability (β), the polarizability (α) and the dipole moment (μ). These parameters (β), (α) and (μ) are calculated using the formulae below.
Hyper polarizability
The hyperpolarizability (β) and polarizability (α) values are in atomic units (a.u.), the computed values were converted to electrostatic units (esu) (1 a.u. = 0.148 × 10⁻²⁴ esu and: 1 a.u. = 8.6393 × 10⁻³³ esu). μ = 0.900 Debye, α = 3.388 × 10⁻²³ esu, and β = 3.416 × 10⁻³⁰ esu are the computed values for CFMP compound. Urea (β = 3.72810-33esu) is a sample molecule used in research on the NLO characteristic of organic chemicals that would be optimized and calculated using the DFT/B3LYP/6–31++G(d,p) technique. That's why, urea was frequently used as a prototype quantity for comparative purposes. Since the molecule has a greater hyperpolarizability (β) value than urea, it could be used in the scientific investigation of nonlinear optical characteristics.
3.5 Frontier molecular orbital analysis
Gaussian 09 software and the TD-DFT/B3LYP technique with basis set 6–311++G(d,p) were used to compute the detected excited states of a synthesized compound. Table 3 displays the absorption Oscillator force (f), wavelength (λ), and excitation energies, as well as the primary contribution of transitions. Using this method, we identified three absorption peaks on analysed UV–Visible spectra. In our case, of the CFMP compound, the experimental spectrum was obtained with 100 percent ethanol at 293 K (Fig. S1).The examination of this spectrum show that the strong absorption peak was observed at 306 nm. The electronic transition from the ground to excited states was associated to the HOMO → LUMO (94%) excitation at 294 nm (33982 with f = 0.0061). Moreover, the HOMO + 5 → LUMO (32%) and HOMO + 5 → LUMO (19%) and oscillator strengths, wavenumbers, transitions energies are 0.0340 and 0.0240, 306 and 258 nm, 32604.156 and 38413.768 eV respectively. The structure of our compound allows for a robust π–π* transition with a significant extinction coefficient throughout the UV–Visible range. The experimental findings match well with the transition excitation energies.
Excitation energy (ev)
Absorption wavelength (nm)
Oscillator force (u,a)
Major contribution (%)
Calculated
Experimental
32604.156
306.709
306.000
0.0034
HOMO + 5 → LUMO (32%)
HOMO + 3 → LUMO (18%)
HOMO + 1 → LUMO (43%)
33982.558
294.269
294.000
0.0061
HOMO → LUMO (94%)
HOMO + 5 → LUMO (3%)
38413.768
260.323
258.000
0.024
HOMO + 5 → LUMO (19%)
HOMO + 3 → LUMO (15%)
HOMO + 2 → LUMO (10%)
HOMO + 1 → LUMO (53%)
The frontier molecular orbitals affect the electric and optical properties, as well as the chemical processes. The energy gap for CFMP was calculated using the DFT/B3LYP technique and the 6–311++G(d,p) level. The energy gap and HOMO-LUMO eigenvalues regulate the molecule's bioactivity and chemical environment. As an electron acceptor, the LUMO indicates the capacity to obtain an electron, and the LUMO as a donor shows the tendency to donate an electron. Fig.S2 depicts the HOMO–LUMO orbital of the studied CFMP compound. The calculated energy gap is around 5.11 eV. Table 4 shows the CFMP electronic parameters like global electrophilicity index (w), global softness (S), global hardness (η), chemical potential (μ), electronegativity, energy gap (ΔEHOMO-LUMO), and frontier molecular orbitals (EHOMO, ELUMO) were computed using the DFT method. Those calculated EHOMO and ELUMO using the equations shown below. I = − EHOMO. A= − ELUMO. W = μ2/2η. S = 1/2 η. η = I - A/2. ΔΝ max= - μ/ η
Parameters
B3LYP / 6–311 ++ G(d. p)
EHOMO (eV)
−6.83
ELUMO (eV)
−1.72
|ΔEHOMO-LUMO|(eV)
5.11
Electronic affinity (A) (eV)
1.72
Ionization potential (I) (eV)
6.83
Electronegativity (eV)
4.28
Chemical potential (μ) (eV)
−4.28
Chemical hardness (η) (eV)
2.56
Softness(S) (eV)-1
0.19
Electrophilicity (W) (eV)
3.29
Additional electronic charges ΔΝ max
1.67
HOMO energy (EHOMO) = -6.83 eV
LUMO energy (ELUMO) = -1.72 eV
Energy gap (ΔEHOMO-LUMO) = 5.11 eV
The molecule's stability improves as the band gap energy decreases. The molecular charge distribution was estimated using the DFT method. This computation takes into account the charges of each atom in a molecule. According to the diagram, HOMO is placed over the phenyl piperidine ring and has a delocalized electron charge density, whereas LUMO, on the other hand, is located across the piperidine ring and has an electron density that is centred at the ring surface. The negative and positive phases are denoted by the colors red and green, respectively. The molecule's overall softness and hardness, which is a good sign of determines its chemical stability. The value of the energy gap was used to assess if a molecule is hard or soft. The CFMP compound hardness value (η) is 2.56 eV. The CFMP compound is classed as a hard material as a result of this finding, and the electrophilicity index (w) defines the molecule's bioactivity.
3.6 Mulliken atomic charges
The electronegativity normalization and charge transfer mechanisms in the reactions were detected using the atomic charge. Mulliken atomic charges were calculated to analyse the increase in electropositivity owing to its electronegative neighbor and vice versa in brief charge transit in a molecule. Charge transfer and atomic charges are fundamental to molecule activity and chemistry (Mulliken, 1955). The Mulliken population analysis, total atomic charges of CFMP computed using DFT-B3LYP level are shown in Table 5. The MA charges for CFMP are shown in Fig. S3. The negative values −0.552, −0.517, −0.632, −0.266, and −0.277 on the aromatic phenyl rings' C7, C10, C11, C17, and C27 atoms cause electron density redistribution. Because of their major negative charges, the atoms C9, C16, and C26 can accept higher positive charges of 0.875, 0.779, and 1.102, respectively, and thus become more acidic. It's worth mentioning that its O4 atom in the CFMP molecule seems to have a negative atomic charge of −0.216.
Atoms
Mulliken charges
Atoms
Mulliken charges
Cl1
−0.589
C21
−0.504
F2
−0.172
C22
−0.044
F3
−0.166
H23
0.205
O4
−0.216
C24
−0.183
N5
−0.027
H25
0.168
H6
0.245
C26
1.102
C7
−0.552
C27
−0.277
H8
0.253
H28
0.158
C9
0.875
C29
0.082
C10
−0.517
H30
0.212
C11
−0.632
C31
−0.744
H12
0.235
C32
−0.051
H13
0.169
H33
0.211
C14
−0.213
C34
−0.458
H15
0.154
H35
0.164
C16
0.779
C36
−0.192
C17
−0.266
H37
0.205
H18
0.185
H38
0.174
C19
−0.125
H39
0.146
H20
0.203
3.7 Vibrational IR spectra and assignments
The FT-IR vibrational wavenumbers were calculated using the DFT/B3LYP/6–31++G(d,p) method. To evaluate the vibrational properties of CFMP, we perform vibrational research utilizing infrared spectroscopy at ambient temperature. The discrepancies between estimated and experimental wavenumbers were addressed by adding a scaled field or simply scaling the wavenumbers computed with appropriate factor (Scott and Random, 1996). To adequately conform with experimental results, the normal mode vibration frequencies were calculated at the B3LYP level. Such that, above 1700 cm−1 wavenumbers are scaled by 0.958, whereas below 1700 cm-1 wavenumbers are scaled by 0.983.
Table S2 displays the scaled wavenumbers that were calculated and experimentally observed. Fig. S4 depicts the calculated FT-IR spectrum and experimental FT-IR spectrum. This table shows the computed complete PED assignments, infrared intensity, and fundamental vibrational frequencies in both unscaled and scaled forms. In our investigation, the calculated wavenumbers range from 4000 to 400 cm−1. The vibrational assignment was completed with the assistance of a scaled quantum mechanical software and a total energy distribution calculation technique. To get theoretical values nearer to calculated values, we used a scaling factor of 0.9608 (Palafox, 2000).
3.7.1 N−H Vibrations
The N−H stretching vibration occurs extensively in the 3500–3300 cm−1 range. νN−H mode was assigned by Erdogdu et al. to the 3500–3300 cm−1 range (Erdogdu and Güllüoğlu, 2009). In FT-IR spectra, the amino group stretching vibration was identified as a very prominent band at 3468 cm−1, with a calculated value of 3326.5 cm−1 (IIR: 2.37) for the symmetric NH2 mode. Furthermore, the NH stretching vibration seems to be pure mode, with calculated values of 3528 and 3396 cm−1 that match the observed FT-IR value of 3326.5 cm−1. The PED of this vibration corresponds to a perfect mode that provides about 100%. τHNCC(33) has an bending mode (out-of-plane) at 759.8 cm−1 (FT-IR strong), which is in suitable harmony with the predicted frequency of 739 cm−1. δHNH(11), δHNH(57), 1409.9 and δHCN(49), δHCN(21), 1337.4 both have in-plane bending modes that are supported by the literature.
3.7.2 Vibration of C=O, C−N and C−Cl
The C=O (carbonyl) stretching vibration should arise between 1680 and 1715 cm−1. The carbonyl group stretching was observed as a prominent band in the FT-IR spectra at 1718.6 cm−1 in this study, and the same band was calculated around 1718 cm−1 (IIR: 232.01). Both calculated and observed values accord well with one another. The deviation is caused by delocalization of the π-electron inside the molecule. The deviation is caused by the delocalization of the π-electron within the molecule (Roeges, 1994; Panicker et al., 2007). The intensity of the carbonyl group can be increased by conjugation or the formation of hydrogen bonds. The value in the literature matches well with the proposed assignment. Detecting C−N vibration is challenging since multiple bands may be mixed at this place. In contrast, the C−N stretching vibrations were calculated using a theoretical calculation (B3LYP) approach. In the 1300 cm−1 range, the stretching vibration of C−N is moderate to strongly active, accompanied by N−H scissoring (Roeges, 1994). The C−N bending vibration, measured at 1337.4 cm−1, was investigated in this study. It's worth looking at the vibrations of the ring's link to the halogen atom, and the vibrational mixing that's conceivable due to the molecule's reduced molecular symmetry and the presence of bulky atoms around it. In this work, the stretching vibration (C−Cl) is attributed towards the bands at 1296.8 cm−1 in FT-IR spectra and 1319 cm−1 in calculated spectra.
3.8 Hirshfeld surface analysis
Hirshfeld surface (HS) analysis aims to investigate intermolecular interactions, determine inter-nuclear distances, bond angles, crystal packing, and close contact atoms. Fingerprint plots, Hirshfeld surfaces measuring the space occupied by a molecule, and intermolecular interaction were all created with the Crystal Explorer 3.1 tool, which was supported by crystallographic data files (CIF) (Agarwal et al., 1245). Hirshfeld surface analysis gives a great graphical representation of the interactions of hydrogen bonding. HS analysis visually investigates intermolecular interactions in crystal structures by using 2D fingerprint plots and molecular surface contours. The contoured form of a molecule inside a crystal structure produces a van der Waals (vdW) surface. The various vdW radii of atoms define the distances between locations on the surface and nuclei (atom) outside (de) and within (di) the mean surface, whereby the contact distances di and de may be dnorm(standardized) (Turner et al., 2017; Sagaama and Issaoui, 2020).The van der Waals radii of the external ( ) and internal ( ) and atoms on the surface, van der Waals radii and normalized contact distance dnorm, is represented as (Ben Issa et al., 2020).
Fig. 2a displays Hirshfeld analysis plotted with the dnorm and two neighbouring molecules outside the surface for the complex. In this work, the Hirshfeld surfaces for our compound dnorm, de, di, curvedness, and shape index are showed in Fig. 2b.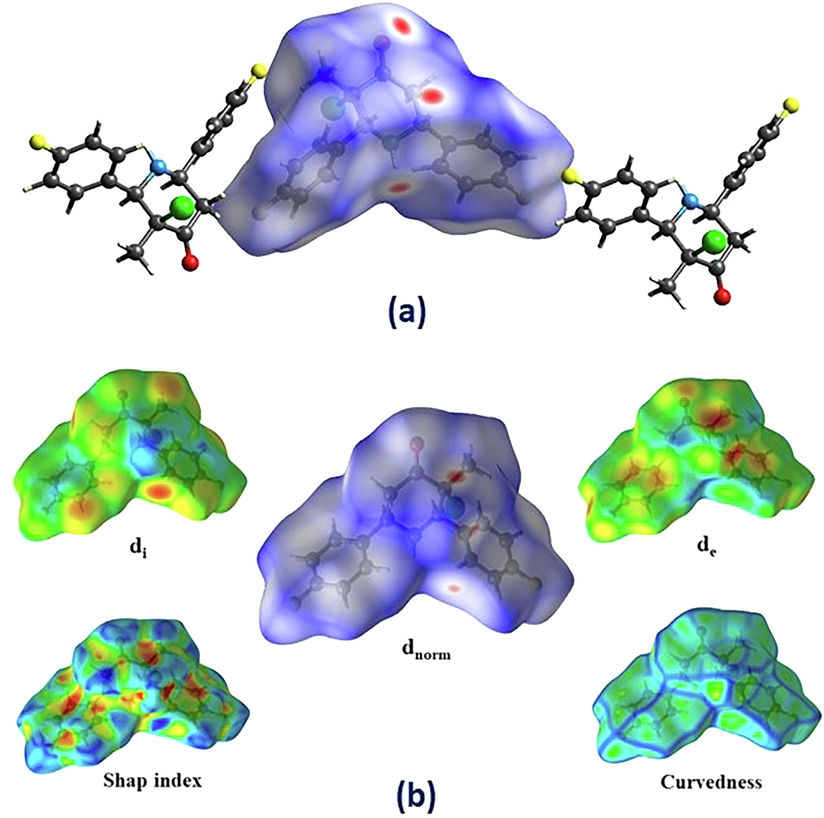
a & b: a) Hirshfeld analysis mapped with dnorm and showing two adjacent molecules outside the surface for the CFMP. The red colors indicate contacts with distances shorter than the van der Waals radii, and indicate weak inter/intramolecular interactions. b) Hirshfeld surface for CFMP with di, de, dnorm, shape index, and curvedness.
Intermolecular distances were depicted as a white color near ) connections with a dnorm of zero. Blue surfaces are contacts with high dnorm values that are bigger than the sum of ).
Two-dimensional fingerprint plots of the Hirshfeld surface contact that contributes 100% of CFMP (Fig. S5). The de versus di plot revealed the existence and amount of several types of intermolecular interactions. The de and di are also used to generate the 2D fingerprint plot and a summary of intermolecular interactions in the CFMP crystal compound. 2D fingerprint plots illustrating main intermolecular contacts and percentages of different intermolecular interactions. It leads to the Hirshfeld surfaces in the CFMP compound (Fig. S6). Total intermolecular interactions in CFMP, including reciprocal connections: The relative percentage of (a) = H∙∙∙H contacts (33.9%) (a1), (b) = H∙∙∙F contacts (22.2%,) (b1), (c) = C∙∙∙H contacts (19.2%) (c1), (d) = H∙∙∙Cl contacts (11.1%) (d1), (e) = O∙∙∙H contacts (9.0%) (e1), (f) = F∙∙∙F contacts (1.1%), (g) = C∙∙∙F contacts (0.9%), (h) = C∙∙∙O contacts (0.6%), (i) = C∙∙∙Cl contacts (0.6%) and (j) = O∙∙∙O contacts (0.1%). A1 through E1 indicate decomposed views of the weak intermolecular interactions in each of the first five (a1 – e1) 2-D represented views of the molecule. Fig. S7 depicts the significant percentage additions to the Hirshfeld surface area of the CFMP compound's numerous near intermolecular interactions.
3.9 Molecular docking study
Molecular docking is a powerful method used to show the binding activities of drug molecules with protein. The main purpose of this tool has helped us in designing a new inhibitor and drugs in the treatment of Alzheimer illness. These diseases are a degenerative disorder of the brain which affect a large number of people in the world. The exact cause of this disease is still unknown, but it is believed that environmental and genetic factors contribute to it. Therefore, there are some drugs that may delay its progress. In this context, a bibliographic study shows that these proteins VEGFR2 (code :6lvm), hAChE (code: 4ey7), DRD2 (code: 6CM4) and DHFR (code:1DRF) are important targets for developing a new drug against Alzheimer disease (Youssef et al., 2017; Dawood and Dayl, 2020). Molecular docking simulations were performed using MOE.10 software to get detailed information about ligand-receptor binding energy. The CFMP compound was chosen as the ligand and docking studies were done taking 6lvm, 4ey7, 6CM4 and 1DRF as the proteins. For this reason, the native ligand CFMP was re-docked in the binding sites of these enzymes. The 2D and 3D pictorial presentation of the compounds helped us to find the active sites (Fig. 3). This figure shown the best conformations which corresponds to the lowest energy of each complex ligand-proteins. Also, the calculation results such as the binding energy score (S), RMSD, E-config and E-place are summarized in Table 6. The coordinates of interaction parameters of ligand with proteins are tabulated in Table 7. Analysis of Table 6 reveals that all the proteins presented good docking score. In addition, the root mean square deviation (RMSD) values of these compounds range from 0.84 to 1.53 A°. The binding score values for 6LVM, 4ey7, 6CM4 and 1DRF are −5.59, −7.19, −5.93 and −6.72 kcal/mol, respectively. However, the better binding energy score and RMSD value has been obtained from the protein 4EY7 (S = -7.19 kcal/mol, RMSD = 0.84 A°). In addition, The RMSD values facilitates the stability of the system if it is lower than 3 (Ahmad et al., 2017). Furthermore, the RMSD values allow to confirm the reliability of our docking results (Arshad et al., 2020). Also, it is found from the Table 7 that the key contributing amino acid in CFMP with the target complexes are ALA 9, ASP 114, HIS 393, ASP 94, ASP 635, LYS 508 and LEU 478. These interactions allow to stabilize the molecules on the active sites. We note also that the measured distances for both complexes studied vary between 2.62 and 4.36 Å. The 6lvm shows two conventional H-bonds of LEU 478 and LYS 508 at a distance of 4.36 A° (energy value of 0.6 kcal/mol) and 2.86 A° (energy value of 4.0 kcal/mol), respectively. Similarly, the docked conformation 1DRF and 4ey7has two conventional H-bond (3.01 A°/ ALA 9 and 2.62 A°/ ASP 114) and (3.46 A°/ASP 74 and 3.51 A°/ASP 74), respectively. Thus, the docking results show that CFMP has a lot biological activities. Finally, we can conclude that the different interactions observed between the complexes makes it clear that our compound can be a potential inhibitor against Alzheimer's disease.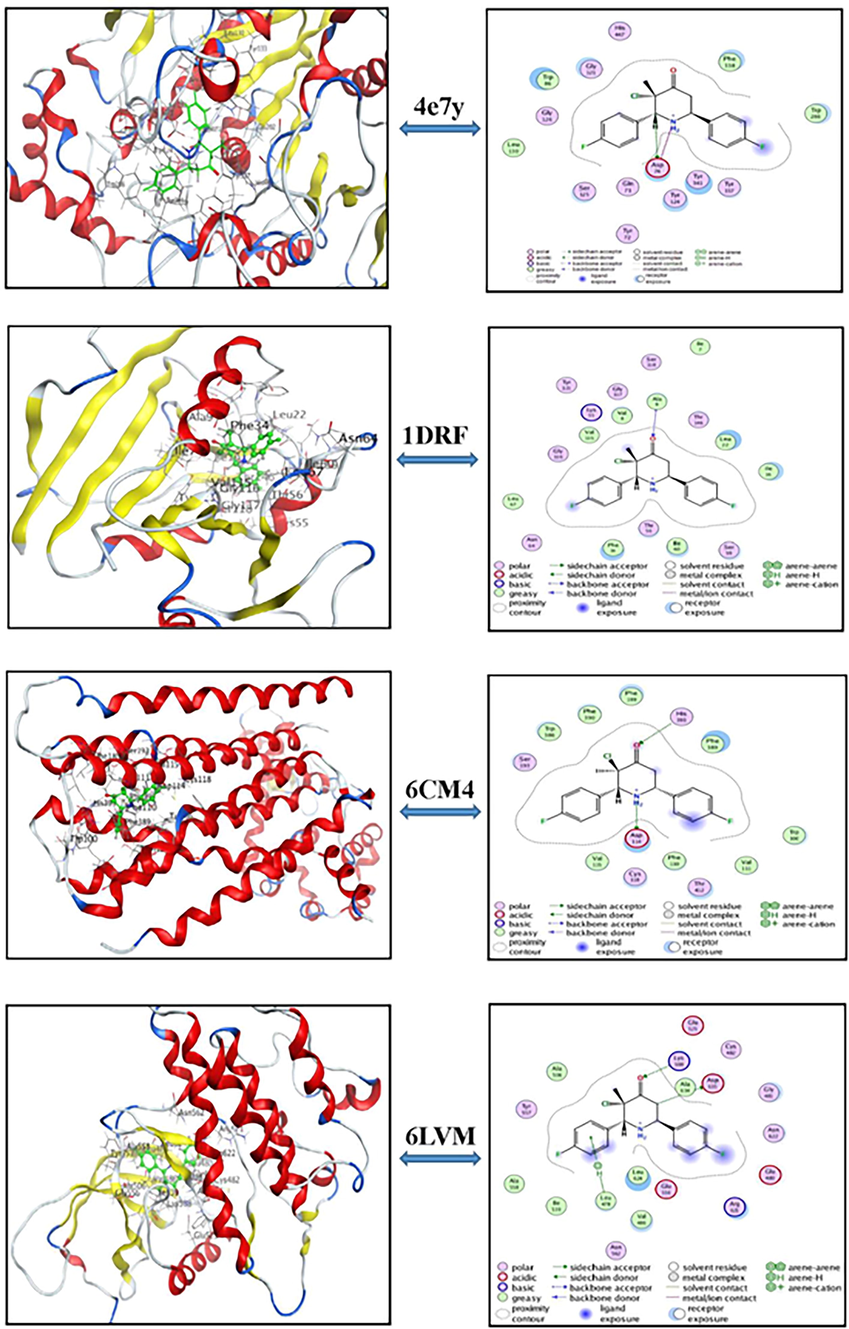
3D (left) and 2D (right) molecular docking of CFMP ligandwith 4e7y, 1DRF, 6CM4, and 6LVM proteins.
Ligand
Proteins
RMSD
Binding energy score (S)
E-config
E-place
CFMP
1DRF
1.53
−6.72
−25.87
−81.95
4ey7
0.84
−7.19
−20.99
−85.25
6CM4
1.18
−5.93
–22.22
−85.66
6LVM
1.53
−5.59
−20.87
−55.55
Proteins
Compound part
Interacting amino acid
Type of interaction
Distance (A°)
E (kcal/mol)
1DRF
O1
ALA 9
H-acceptor
3.01
−3.1
6CM4
N1
ASP 114
H-donor
2.62
14.7
O1
HIS 393
H acceptor
3.57
0.6
N1
ASP 114
ionic
2.62
−7.6
4ey7
C1
ASP 74
H-donor
3.46
−0.9
N1
ASP 74
ionic
3.51
−1.8
6LVM
C4
ASP 635
H-donor
3.65
0.6
O1
LYS 508
H-acceptor
2.86
4.0
6-ring
LEU 478
pi-H
4.36
0.6
4 Conclusion
The 3-chloro-r(2),c(6)-bis(4-fluorophenyl)-3-methylpiperidin-4-one, CFMP was optimized in this work using DFT/B3LYP/6–311++G(d,p) method. This approach demonstrates that the theoretical parameters correspond well with the experimental results. The MEP map was visualized to understand the nucleophilic and electrophilic sites of CFMP. The intermolecular delocalized interactions were identified from the NBO analyses. Although CFMP has a greater hyperpolarizability (β) value than urea, it is a suitable molecule for studying nonlinear optical characteristics. The HOMO-LUMO of the frontier molecular orbital can be used to analyze and forecast the responsive behavior of the investigated molecule. The DFT theory was used to calculate the vibrational frequency studies and Mulliken atomic charges. HS studies and fingerprint plots were used to well understand the contributions of various inter-contacts that aid in the stabilization of the CFMP molecular structure. Furthermore, a molecular docking analysis indicates that the CFMP molecule is an effective inhibitor of Alzheimer's disease.
Acknowledgements
Researchers Supporting Project number (RSP-2021/61), King Saud University, Riyadh, Saudi Arabia.
Declaration of Competing Interest
The authors declare that they have no known competing financial interests or personal relationships that could have appeared to influence the work reported in this paper.
References
- Synthesis and Biological Activity ofN- And O-Acyl derivatives of 2,6-diphenyl-4- hydroxypiperidinesandtetrahydropyridines. Pharm. Chem. J.. 2003;37(10):526-528.
- [Google Scholar]
- Synthesis and Biological Activities of 2,6-Diaryl-3-methyl-4-piperidone Derivatives. Biol. Pharm. Bull.. 2003;26(2):188-193.
- [Google Scholar]
- Synthesis and Antiproliferative Activity of PolysubstitutedTetrahydropyridine and Piperidin-4-one-3-carboxylate Derivatives, Asian. J. Org. Chem.. 2012;1(1):71-79.
- [Google Scholar]
- Synthesis, crystalstructure, DFT calculations andHirshfeld surface analysis of 3-butyl-2,6-bis(4-fluorophenyl)piperidin-4-one. Acta Cryst E.. 2020;76(5):651-655.
- [Google Scholar]
- X-Ray Crystal Structure, Molecular Structure, Spectral And Antimicrobial Activity of t-(3)-Benzyl-r-(2), c-(6)-diphenylpiperidin-4-one. ChemSci Rev Lett.. 2016;5(18):99-105.
- [Google Scholar]
- Crystal structures of three 3-chloro-3-methyl-2,6-diarylpiperidin-4-ones. Acta. Cryst. E.. 2017;E73:107-111.
- [Google Scholar]
- Crystal structures of two new 3-(2-chloroethyl)-r(2), c(6)-diarylpiperidin-4- ones. Acta Cryst., E. 2018;74:483-486.
- [Google Scholar]
- Synthesis, vibrational spectra, DFT calculations, Hirshfeldsurfaceanalysis and molecular docking study of 3-chloro-3-methyl-2,6-diphenylpiperidin-4-one. SpectrochimicaActa Part A. 2020;232:118166
- [Google Scholar]
- Synthesis, crystal Structure, DFT calculations and Hirshfeld surface analysis of 3-chloro-2,6-bis(4-chlorophenyl)-3-methylpiperidin-4-one. J. ChemCrystallogr. 2021;51(2):273-287.
- [Google Scholar]
- Synthesis, Crystal Structure, DFTCalculations and Hirshfeld SurfaceAnalysisof 3-Chloro-3-methyl-r(2), c(6)-bis(p-methoxyphenyl)piperidin-4-one. J. Chem. Crystallogr. 2020;50(1):41-51.
- [Google Scholar]
- M.J. Frisch et al. Gaussian 09, Revision A.02, Gaussian Inc 2009 Wallingford CT
- R. Dennington, T. Keith, J. Millam, GaussView, Version 5, Semichem. Inc, Shawnee Mission, KS, (2009).
- M.H. Jamroz, Vibrational Energy Distribution Analysis, vol. 4, Computer Program, Poland, (2004) VEDA.
- http://www.rcsb.org/pdb/
- Molecular Operating Environment (MOE), 2015.10; Chemical Computing Group Inc., 1010 Sherbooke St. West, Suite #910, Montreal, QC, Canada, H3A 2R7, 2015.
- R. Arulraj, S. Sivakumar, A. Thiruvalluvar, M. Kaur, J.P.Jasinski,3-Chloro-r-2,c-6- bis(4-fluorophenyl)-3-methylpiperidin-4-one,IUCrData, (2016) x161580.
- Synthesis, spectral and conformational studies of some N-arylsulfonyl-t(3)-isopropyl-r(2), c(6)- diarylpiperidin-4-ones. Magn. Reson. Chem.. 2011;49(12):830-834.
- [Google Scholar]
- Properties and Reactivities of Niclosamide in Different Media, a Potential Antiviral to Treatment of COVID-19 by Using DFT Calculations and Molecular Docking. Biointerface Res. Appl. Chem.. 2020;10:7295-7328.
- [Google Scholar]
- Electronic Molecular Structure, Reactivity and Intermolecular Forces: AnEuristic Interpretation by Means of Electrostatic Molecular Potentials. Adv. Quant. Chem.. 1978;11:115-193.
- [Google Scholar]
- Hirshfeld surface analysis, Interaction energy calculation and spectroscopical study of 3-chloro-3-methyl-r(2), c(6)-bis(p-tolyl)piperidin-4-one using DFT approaches” J. Molecular. Structure. 2022;1248:131483.
- [CrossRef] [Google Scholar]
- Introduction to nonlinear optical effects in molecules andpolymers. New York: Wiley; 1991.
- R.S. Mulliken, Electronic Population Analysis on LCAOMO Molecular Wave Functions. I, J. Chem. Phys., 23 (1955) 1833-1840.
- Harmonic Vibrational Frequencies: An Evaluation of Hartree- Fock, Møller-Plesset, Quadratic Configuration Interaction, Density Functional Theory, and Semiempirical Scale Factors. J. Phys. Chem.. 1996;100:16502-16513.
- [Google Scholar]
- Scaling Factors for the Prediction of Vibrational Spectra. I. Benzene Molecule. Int. J. Quant. Chem.. 2000;77:661-684.
- [Google Scholar]
- Analysis of vibrational spectra of 2 and 3-methylpiperidine based on density functional theory calculations. Spectrochim. Acta. 2009;74(1):162-167.
- [Google Scholar]
- A Guide to the Complete Interpretation of Infrared Spectra of Organic Structure. New York: Wiley; 1994.
- Raman, IR and SERS spectra of methyl(2-methyl-4,6-dinitrophenylsulfanyl)ethanoate. Spectrochim. Acta.. 2007;67:1313-1320.
- [Google Scholar]
- (a) N. Agarwal, I. Verma, N. Siddiqui, S. Javeda, Experimental spectroscopic and quantum computational analysis of pyridine-2,6-dicarboxalic acid with molecular docking studies, J. Mol. Struct, 1245,(5) (2021) 131046.(b) S. Savita, A. Fatima, Km. Garima, Km.Pooja, I. Verma, N. Siddiqui, S. Javed, Experimental spectroscopic, Quantum computational, Hirshfeld surface and molecular docking studies on 3-Pyridinepropionic acid, J. Mol. Struct., 1243, (5) (2021) 130932. (c) A. Fatima, J. Bhadoria, S. K. Srivastava, I.Verma, N. Siddiqui, S. Javed, Exploration of experimental and theoretical properties of 5,5-dimethyl 3-amino-cyclohex-2-en-1-one (AMINE DIMEDONE) by DFT/TD-DFT with ethanol and DMSO as solvents and molecular docking studies, J. Mol. Liq. 338, (2021) 116551
- M.J. Turner, J.J. McKinnon, S.K. Wolff, D.J. Grimwood, P.R. Spackman, D. Jayatilaka, M.A. Spackman, CrystalExplorer 17.5,University of Western Australia, (2017) http://hirshfeldsurface.net.
- Design, molecular docking analysis of an anti-inflammatory drug, computational analysis and intermolecular interactions energy studies of 1- benzothiophene-2-carboxylic acid. Comput. Biol. Chem.. 2020;88:107348
- [Google Scholar]
- Computational study of 3-thiophene acetic acid: Molecular docking, electronic and intermolecular interactions investigations. Comput. Biol. Chem.. 2020;86:107268.
- [CrossRef] [Google Scholar]
- N-substituted-piperidines as Novel AntialzheimerAgents: Synthesis, antioxidant activity, and molecular docking study. Fut. J. Pharm. Sci.. 2017;4(1):1-7.
- [Google Scholar]
- Synthesis, identification and molecular docking studies of Nfunctionalizedpiperidine derivatives linked to 1,2,3-triazole ring. Synth. Commun.. 2020;50(16):2422-2431.
- [Google Scholar]
- Molecular Modeling, Simulation and Docking Study of Ebola Virus Glycoproteins. J. Mol. Graph. Model.. 2017;72:266-271.
- [Google Scholar]
- Synthesis, structural properties, enzyme inhibition and molecular docking studies of (Z)-N'- (1-allyl-2-oxoindolin-3-ylidene) methanesulfono-hydrazide and (Z)-N'-(1-allyl-2-oxoindolin- 3-ylidene)-3-nitrobenzenesulfono-hydrazide. J. Mol. Struct.. 2020;1221:128880
- [Google Scholar]
Appendix A
Supplementary data
Supplementary data to this article can be found online at https://doi.org/10.1016/j.jksus.2021.101632.
Appendix A
Supplementary data
The following are the Supplementary data to this article:


