

Translate this page into:
Spectroscopic and in silico approach to probe the binding interactions of irbesartan and human serum albumin
⁎Corresponding author. mosalam@jazanu.edu.sa (Md Shamsher Alam)
-
Received: ,
Accepted: ,
This article was originally published by Elsevier and was migrated to Scientific Scholar after the change of Publisher.
Peer review under responsibility of King Saud University.
Abstract
Abstract
Objective
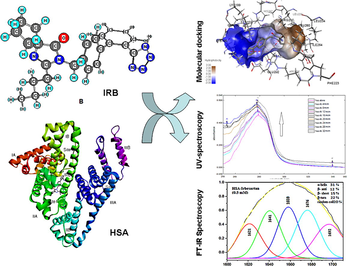
The free and active concentration of drugs and thereby their pharmacokinetic properties are controlled by their binding to human serum albumin (HSA) protein. Irbesartan (IRB), an antihypertensive drug was aimed to be investigated in terms of its binding interactions with different sites of HSA using in silico molecular docking technique along with the commonly employed spectroscopic techniques.
Methods
Using FT-IR spectroscopy, the spectral shifting and intensity variations before and after complexation with IRB were studied for amide A, amide-I as well as amide-II of HSA. The absorbance of HSA with and without increasing concentrations of IRB was studied at 280 nm and the binding constant was determined using UV-spectroscopy. Molecular docking study was performed, and the types of interactions were predicted.
Results
The IR spectra of IRB-HSA complex showed reductions in the intensities of amide-I and II bands as well as marked reduction in the α-helix content of HSA. The absorbance of HSA protein increased with increasing concentrations of drug. A binding constant value of 5.64 × 10⁴ M−1 was calculated indicating good interaction. Molecular docking studies showed that IRB interacts more effectively with site-I of HSA through greater number of hydrogen bonds and strong π–charge (electrostatic) interactions than with site-II.
Conclusions
The spectroscopic and molecular docking techniques proved to be effective tools to study the drug-protein interaction which provided accurate results as evident from these studies. Studying drug-albumin interaction is of utmost importance as it directly influences the overall pharmacokinetics of the drugs including its distribution, metabolism and therefore the duration of action.
Keywords
Binding interactions
Human Serum Albumin
Irbesartan
Molecular Docking
Spectroscopic Analysis

- CD
-
circular dichroism
- cm
-
Centimeter
- CIRB
-
concentrations of IRB
- CHSA
-
concentrations of HSA
- FT-IR
-
Fourier Transform-Infra Red
- HSA
-
human serum albumin
- IRB
-
Irbesartan
- mM
-
millimolar
- µM
-
micromolar
- mL
-
Milliliter
- nm
-
Nanometer
- PDB
-
protein data bank
- RCSB
-
Research Collaboratory for Structural Bioinformatics
- RMSD
-
root mean square deviation
- Trp
-
tryptophan
- Tyr
-
tyrosine
- UV–Vis
-
Ultraviolet–Visible
Abbreviations
1 Introduction
The HSA is a highly soluble, highly abundant (35–50 g/L; 0.6 mM) protein responsible for transportation of a vast array of chemically distinct molecules in the plasma (Yang et al., 2020; Curry 2009; Kratochwil et al., 2002). It is known for its high binding capacity with drugs which ultimately influences their pharmacokinetic properties. In the structure, 585 amino acids are arranged in a polypeptide chain with an overall molecular weight of 66.5 kDa (Carter and Ho, 1994). The homologous domains present in HSA protein can further be alienated into a six-helix sub-domain ‘A’ and a four-helix sub-domain ‘B’. The primary binding sites in HSA protein are site-I and site-II which are respectively present in subdomains-IIA and -IIIA (Sudlow et al., 1976). Recently, a third binding site-III present in sub-domain IB (Zsila, 2013) has also been identified. The ligands to the protein get associated with any of these two affinity sites with high association constant. The structural evaluation of ligands revealed that the ones which bind to site-I are generally bulkier heterocyclic derivatives having a delocalized negative charge at the center of non-polar moieties (Buttar et al., 2010; Ghuman et al., 2005; Petitpas et al.,2001; Ryan et al., 2011). Whereas, another binding site (site-II), also known as indole-benzodiazepine site, is known to accommodate mainly the aromatic carboxylic acid groups having a negative charge on α-carbon which is distant from the lipophilic center (Ghuman et al., 2005). However, apart from these molecules, HSA binding sites are reported to have interaction with many other ligands with different affinities. The incidence of multiple binding sites on the HSA molecule imparts it an exceptional ability to interact with a number of inorganic and organic substances, thereby stating it an imperative regulator of pharmacokinetic properties of a variety of drugs (Lee and Wu, 2015).
IRB belongs to a class of drugs known as Angiotensin II receptor antagonist, which lowers the blood pressure by relaxing the vascular smooth muscles. It is used to treat hypertension and helps to prevent kidney damage due to diabetes. The chemical structure and energy minimized conformation of IRB is shown in Fig. 1. The IRB is generally absorbed rapidly and completely after oral administration and has an average absolute bioavailability of 60–80%. The peak plasma concentration (Tmax) reaches at around 1.5–2 h of the administration of dose. The accumulation is limited (less than 20%) when administered as a single dose daily (Collaboration, 2011). It is an active drug and does not require biotransformation to get activated, however is metabolized in liver to its inactive forms via glucuronide conjugation and oxidation and to some extent by hydroxylation. It is mainly metabolized by CYP2C9 enzyme of the cytochrome P450 family and has an elimination half-life of 11–15 h. It shows a high protein binding of 90% and binds mainly to the serum albumin and α1-acid glycoprotein with a little interaction with other blood constituents. The average volume of distribution is in the range of 53–93 L and has good plasma and renal clearances (Collaboration, 2011).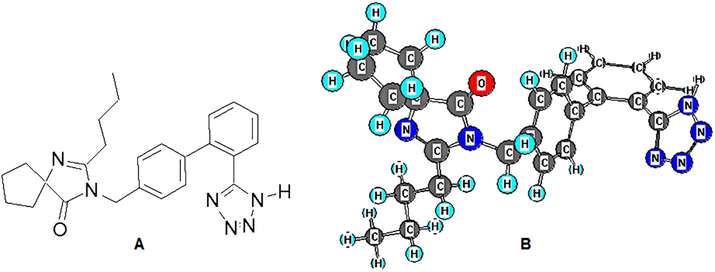
Structures of IRB (A) 2-D structure; (B) Energy minimized 3-D conformation showing placement of atoms and planes.
The interaction of drugs with freely circulating albumin protein has effects on its efficacy, transportation, and availability. This binding is reversible and influences the pharmacokinetic parameters of drug including absorption, distribution, metabolism as well as excretion (Singh, 2006; Carter et al., 1994; Perry et al., 2003). Additionally, in case of more lipophilic drugs, binding with serum albumin increases its solubility in plasma which affects their cellular distribution and ultimately their disposition and efficacy. Upon protein binding, the clearance rate of drugs decreases, whereas the plasma half-life increases. Therefore, studying drug interactions with serum albumin protein is necessary to gain insight into transport, distribution, metabolism, and pharmaceutical dynamics (Gong et al., 2007). In a study conducted for the first time, the investigations of interactions of IRB with bovine hemoglobin (BHb) were successfully carried out by means of UV–Vis, circular dichroism (CD), fluorescence spectroscopy and in silico molecular docking techniques (Yang et al., 2012).
In the present study, IRB was made to interact with the HSA protein. The interactions were measured using simple spectroscopic techniques, Fourier Transform-Infra Red (FT-IR) and Ultraviolet–Visible (UV–Vis) spectroscopy. The confirmation of results was done by using in silico molecular docking technique, which gave the insight of binding sites and the type of interactions between IRB and HSA.
2 Materials and methods
2.1 Instruments and chemicals
IRB, HSA (>99% pure), sodium phosphate monobasic and sodium diphosphate dibasic were procured from Sigma-Aldrich (USA). The deionized water was produced in our laboratory and was used without further purification. The IR-spectroscopy was studied using an FT-IR spectrophotometer (Nicolet iS10, Thermo Fischer Scientific, USA), whereas the UV–Vis spectroscopy was studied using a double beam UV–Vis spectrophotometer (Shimadzu, Japan). For docking experiments, AutoDock Vina version 1.13.1 with UCSF Chimera version 1.13.1 was applied.
2.2 Preparation of buffer, drug and protein stock solutions
0.05 M NaCl solutions and 0.1 M phosphate buffer were prepared by dissolving appropriate salts in the deionized water. The pH (7.2) for the phosphate buffer was fixed using 0.2 M NaOH solution. 0.6 mM HSA stock solution was prepared by dissolving 40 mg of HSA powder in 1 mL of phosphate buffer. Similarly, 1 mM stock solution of IRB was prepared by dissolving 42.85 mg of IRB powder in 100 mL of the buffer. All the solutions were prepared fresh before each analysis.
2.3 FT-IR analysis
2.3.1 Method
For FT-IR analysis, IRB and HSA solutions were mixed in equal proportion to obtain the targeted drug (0.1 and 0.5 mM) and protein (0.3 mM) concentrations. Solutions were correctly mixed and kept for 2 h at 25 ± 3 °C accompanied by recording spectra using the FT-IR spectrophotometer by making hydrated films. The spectrum was taken at a resolution of 4 cm−1 and 100 scans over the absorbance range of 4000–400 cm−1. A difference spectrum was obtained by subtracting the unbound HSA spectrum from HSA-IRB complex spectra (Dousseau et al., 1989).
2.4 UV- spectroscopy
2.4.1 Methodology
The HSA absorption spectra with and without IRB were achieved using UV–visible spectrophotometer. The measurements were performed at 200–400 nm wavelength range. The spectrophotometer was equipped with deuterium lamp as a source of ultraviolet light. Quartz cuvettes (path length 1 cm) were used to record the spectrum. For titration experiment, a specific HSA concentration (12 µM) showing optimum absorbance was selected and mixed with serially increasing amounts of IRB stock solution to achieve working solution possessing concentrations in the range of 0–32 µM (9 points), while the final volume of the solutions was kept constant (2 mL). All the solutions were gently vortexed followed by incubation at laboratory temperature (25 ± 3 °C) for 2 h. Solutions were shaken occasionally, and the spectrum were recorded followed by measurement of absorbances at λmax 280 nm. Owing to the possibility of absorption at 280 nm by IRB, the correction of spectra was made through subtraction of IRB-alone spectrum from the spectra obtained from HSA-IRB complex.
2.4.2 Determination of drug-protein binding constant
The binding constant (K) of IRB-HSA interaction was measured using the UV absorbance titration data, as per earlier methods (Bratty, 2020; Zhong et al., 2004). Assuming a single mode of interaction between test protein and IRB in the solution, the following equation (1) can be derived:
A0 represents absorbance of HSA without IRB at 280 nm wavelength;
A denotes the absorbance of HSA with IRB at the same wavelength;
εHSA is molar extinction coefficient of HSA;
εB represents molar extinction coefficient for bound IRB;
whereas, is 1 cm path length.
Further deduction can be carried out by substituting the CHSA and CB values and the following equation (2) can be obtained
By using equation (2), and the variables of (Y-axis), and (X-axis), a plot (double reciprocal) was drawn, which exhibited a linear relationship. Slope and intercept of the plot were simulated and the calculation of intercept: slope ratio gave the binding constant (K).
2.5 In silico molecular docking studies
Independent docking (Stephanos, 1996) of IRB to two of the chief drug binding regions, site-I and -II (Sudlow’s sites) (Tayyab et al., 2019) of HSA was performed. Chimera software (University of California, San Francisco) coupled with AutoDock Vina plugin was utilized for the in silico molecular docking analysis (Russell et al., 2016). Protein data bank (PDB) was used as the source of HSA protein X-ray crystal structure along with its binding sites. The HSA structure for site-I was obtained at a resolution of 3.2 Å having the PDB ID 2BXB, whereas the HSA structure for site-II was downloaded at a resolution of 2.95 Å from the PDB ID 2BXF. The PubChem ID of IRB (CID: 3749) was used to load its three-dimensional (3-D) structure to the Chimera window. The structures of HSA and IRB were energy minimized and stabilized using AMBER force field in Chimera. The surface binding analysis was performed in AutoDock Vina. The Sudlow’s binding site-I and site-II having coordinates (x, y, z = 5, 9, 9 Å and x, y, z = 12, 6, 18 Å, respectively) were applied to centralize the grid box on the ligand. The binding analysis parameters were set at highest difference of energy of 3 kcal/mol, search exhaustiveness at 8, and the number of binding modes at 10. Docking procedure was validated by redocking the co-crystallized ligand into the grid box with the above set parameters. A root mean square deviation (RMSD) of 2 Å was permitted. AutoDock Vina ranks the binding modes on the basis of least binding energy, number and length of hydrogen bonds, and RMSD. The top-ranked IRB-HSA complex was modeled in Discovery Studio 2016 for the interactions.
3 Results and discussion
3.1 FT-IR measurements
The intensity variations and spectral shifting of HSA protein in terms of amide A band (N-H str.), amide-I band (C = O str.), and amide-II band (due to coupling of C-N str. with N-H bend mode) at 3500, 1660–1650 and 1550 cm−1 respectively, were examined upon interaction with different concentrations of drug solutions. The band placed at 1660–1650 cm−1 corresponding to amide-I was analysed for the secondary structure of the protein (Byler and Susi, 1986). The spectra were resolved in the region of 1700–1600 cm−1 and properly enhanced using the self-deconvolution method followed by the second-derivative resolution enhancement technique with the help of OriginPro 2019b (Origin Lab Corporation, Massachusetts, USA) software. The Gaussian shape was fitted to the 1700–1600 cm−1 range using the curve-fitting method. Distinctive peaks of secondary structure components, α-helix, random coil, β-sheet, β-turn, and finally β-antiparallel, were made to adjust. Their corresponding area was determined using Gaussian functions. The amide-I band area was obtained by summing the areas of all secondary structure constituents. The division of the area of respective peaks by total amide-I band area gave the appropriate proportion of amide-I components (Ahmed et al., 1995; Bratty, 2020).
IRB interacted with HSA protein at a concentration of 0.5 mM and found an apparent reduction in intensities of amide-I (1655 cm-1 for unbound HSA) and amide-II band (1543 cm-1 for unbound HSA) in IRB-HSA complex spectra (Fig. 2, IRB-HSA; 0.5 mM). These remarkable changes in the spectra were due to hydrogen bonding interactions between IRB and the functional groups of HSA (C-N, C=O, and N-H). Nevertheless, when 0.1 mM, a lower drug concentration is used, lesser variation in intensity was observed upon complex formation. IRB interacted with the C-N group present in HSA, which was also visible from shifting the amide A band to a higher wavenumber, from 3300 cm−1 (NHstr, unbound HSA) to 3460 cm−1. Furthermore, amide-I and II bands of free HSA shifted upon complex formation [1655 cm−1 → 1659 cm−1 (IRB-HSA complex; 0.5 mM) and 1543 cm−1 → 1541 cm−1 (IRB-HSA complex; 0.5 mM)]. FT-IR analysis may conclude that the amide-I and II bands shifting was because of the interaction (hydrogen bonding) of IRB with C-N and C=O groups of HSA protein. The quantitative analyses of secondary structure of HSA are presented in Fig. 3 and Table 1. The amide-1 band components of unbound HSA secondary structure are composed of β-antiparallel (10%), random coil (5%), β-sheet (13%), β-turn (17%), and α-helix (55%) which was in accordance to the reported literature (Huang et al., 2014; Boulkanz et al., 1995). Upon interaction with IRB, α-helix component considerably decreased from 55% to 31%, β-turn augmented from 17% to 22%, β-sheet increased from 13% to 15%, random coil remarkably increased from 5% to 20%, and β-antiparallel also increased from 10% to 12%. A substantial decrease in Amide I and II band intensities at higher drug concentrations were due to the drop of HSA α-helix content and the H-bonding interactions of C=O, N-H C-N groups of HSA protein with IRB. A pronounced reduction in α-helix and gain of other components (β-turn, β-sheet, random coil and β-antiparallel) in the secondary structure of HSA reflects the partial unfolding of protein in the presence of high IRB concentration. *Percentage variations in HSA α-helix upon complexation with IRB at physiological pH and room temperature.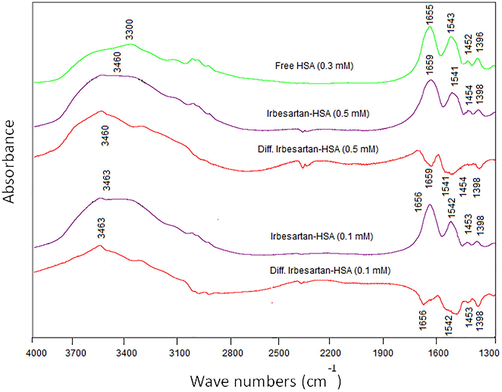
FT-IR spectra of free HSA and its IRB complexes, at drug concentrations (0.5 mM and 0.1 mM) and fixed HSA concentration (0.3 mM) in the range of 4000–1300 cm−1.
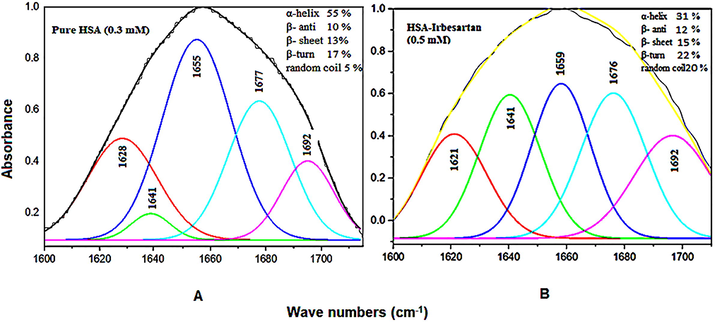
Curve fitting analysis of amide I (1700–1600 cm−1) on unbound HSA (A) and its IRB-complex (B) at physiological pH.
Components Amide I (cm−1)
Free HSA (%) (0.3 mM)
IRB-HSA 0.5 mM) complex (%)
β-sheet; 1640–1615 (±2)
13
15
Random coil; 1648–1641 (±2)
05
20
α-helix; 1660–1649 (±4)
55
31 (−43.63 %) *
β-turn; 1680–1660 (±2)
17
22
β-antiparallel; 1692–1680 (±1)
10
12
3.2 UV-Spectroscopic analysis
UV-spectroscopy is regarded as an uncomplicated and accurate technique to measure the structural changes which might be due to the complexation. It has been utilized to study the formation of complexes between proteins and ligand molecules such as drugs and absorption spectrum thus obtained used to explore the alteration in protein structure upon interaction (Siddiqui et al., 2021). Consequently, in the present investigation, solutions of HSA, IRB and HSA-IRB complexes were obtained to gather important information regarding the interaction between the two species. It was evident from Fig. 4, that, upon successively increasing the IRB level, absorbances of the corresponding complexes regularly enhanced. This increment in the HSA absorbance at 280 nm was attributed to the change in the α-helix and the microenvironment around tryptophan (Trp) and tyrosine (Tyr) residues (aromatic amino acids) present at the binding site upon binding to the IRB. Indeed, a specific pattern of UV-spectrum of HSA-IRB complex was observed and the absorption peak at 280 nm shifted slightly towards shorter wavelength (blueshift) upon increasing the drug concentration. This evidence clearly suggested the existence of interaction between the HSA and IRB. Furthermore, the peptide chain of HSA molecule has further extended upon addition of test drug to HSA solution and hence, indicated alteration in the conformation of the HSA structure (Al-Harthi et al., 2019; Lee and Wu, 2015; Cui et al., 2004; Tao et al., 1981).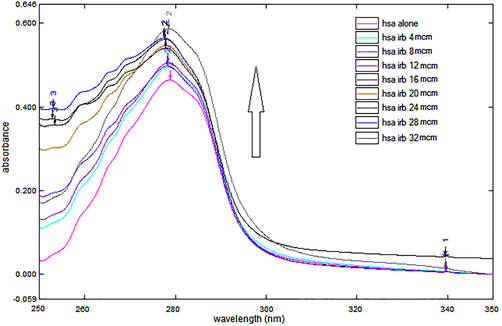
UV absorption spectra of HSA alone and in presence of IRB. The concentration of HSA was constant (12 µM), while successively increasing concentrations (4, 8, 12, 16, 20, 24, 28 and 32 µM) of IRB was added to record the spectrum.
A reciprocal plot, double feature (Fig. 5) was prepared between 1/(A0-A) and 1/CIRB. Where, A0 and A represent the absorbance of unbound protein and IRB-HSA complexes respectively, with different drug concentrations at 280 nm and CIRB corresponds to the molar concentrations of IRB in different IRB-HSA solutions. The plot was found to be linear (R2 > 0.93) and used for determination of binding constant (K) by finding out the intercept to slope ratio. The binding constant was calculated to be 5.64 × 10⁴ M−1 that indicated strong association between the test drug and protein. The considerable interaction between IRB and HSA is most likely attributed to hydrophobic interactions between aromatic regions of the drug and the hydrophobic pockets present in the IIA sub-domain of the peptide chain (Cui et al., 2004). Value of binding constant (K) provided an insight into the extent of interaction of IRB with HSA and hence, helped to understand the distribution of IRB into the systemic circulation. Binding constant, also known as the association constant of a ligand, is used to measure the interaction between protein and the ligand and it represents the speed at which the complex between protein and ligand forms. The binding constant of a drug should be sufficiently high so that it gets distributed throughout the body in considerable concentration and on the other hand, it should be low enough so that the drug can be released from the protein easily and the free drug can bind to the binding site at the receptor. The ideal range of binding constant for a ligand is reported to be 104–106 M−1 (Rajendiran et al., 2007) and drugs having binding constants in this range are ideal candidates to be used as drug molecules. The binding constant value for IRB was calculated to be 104 which denotes ideal value, and the drug is expected to be distributed effectively throughout the body in the protein-bound form and will easily get released at the receptor site.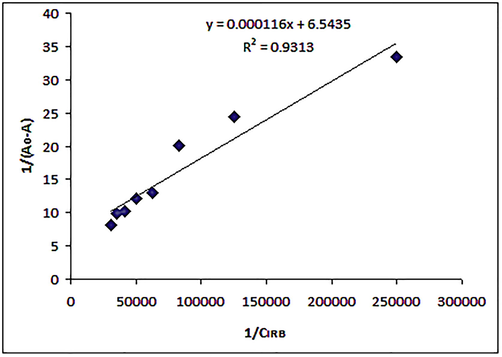
Double reciprocal plot between 1/(A0 − A) and 1/CIRB; A = absorbance of IRB-HSA complexes at different concentrations of IRB, A0 = Absorbance of free HSA and CIRB is the molar concentration of IRB.
3.3 In silico molecular docking studies
The HSA secondary structure is well established to possess three domains I, II, III, that are structurally homologous. It has been shown that most of the drugs interact with either of the highly hydrophobic binding sites, Sudlow’s site-I or site-II (Naik et al., 2015). An insight to the interaction of Angiotensin-II receptor antagonists with the serum albumin led us to the interpretation that this class of drugs for example, Valsartan, Azilsartan, Eprosartan, Olmesartan may bind to either of these sites (Nusrat et al., 2016; Alanazi et al., 2018). Therefore, docking investigation was performed to ascertain the nature of binding conformations that occupy the suitable sites, I and II of HSA.
The three-dimensional (3-D) structures of IRB bound to sites-I, II of HSA are depicted in Fig. 6 which indicated that IRB could interact with both the binding sites. A comparative analysis of the polar binding characteristics of IRB with site-I and -II, along with the binding energy, ΔG in (kcal/mol) is provided in Table 2. The Fig. 7A, 7B and 7C collectively represent the binding site-I of IRB defined by the charged residues of subdomain IIA, the Tyr150, Glu153, Lys195, Gln196, Lys199, Arg257 and Glu292 and the hydrophobic amino acid residues, Leu219, Arg222, Phe223, Leu234, Leu238, His242, Leu260, Ile264, Ala261, and Ala291. Fig. 7A is the 3-D representation of different interactions of IRB with site-I of HSA. Fig. 7B is the 2D depiction of hydrogen bonds, π-charged bonds, and hydrophobic bonds of IRB with HSA. The π -alkyl interactions with Ala291 and Lys195 were considered significant. The alkyl-alkyl interactions with Leu219, Leu234, Arg257, Leu260, Ala261, and Ile264 also influence the binding of IRB to site-I of HSA. Fig. 7C shows the hydrophobic nature of the binding site-I of HSA. Two hydrophobic interactions with Ala291 and one hydrophobic interaction with Phe223 may not contribute to IRB-HSA binding due to their bond lengths greater than 5 Å. The 3-D interaction diagram for IRB with Sudlow’s site-II of HSA is depicted in Fig. 8.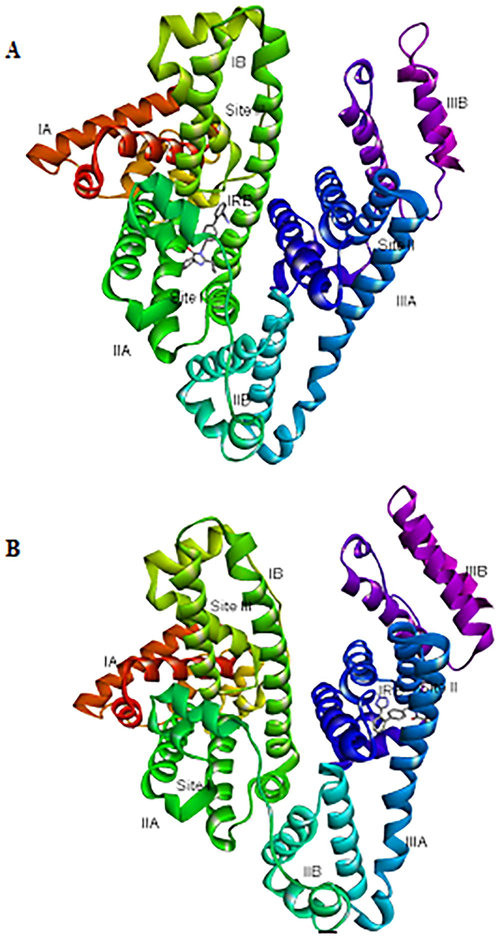
A) 3-D representation of IRB bound to Sudlow’s site I (subdomain IIA) B) 3-D representation of IRB bound to Sudlow’s site II (subdomain IIIA). HSA is shown as solid ribbons in rainbow colors labeled with its different domains; IRB = Irbesartan shown as sticks, colored by elements.
Polar interactions of IRB with Sudlow’s site I of HSA
ΔG (kcal/mol)
RMSD
Nature of interactions
Number of bonds
Binding site residue
IRB atom
Bond length (Å)
−10.9
0
Hydrogen bonds
3
Arg257
Arg257
Tyr150O1
O1
O11.81
2.41
2.21
π-anion interaction
2
Glu292
Glu153Phenyl
3.22
3.88
π-cation interaction
1
Lys199
Phenyl
4.44
Polar interactions of IRB with Sudlow’s site II of HSA
−8.6
0
Hydrogen bonds
2
Leu430
Lys414H28
O11.84
2.52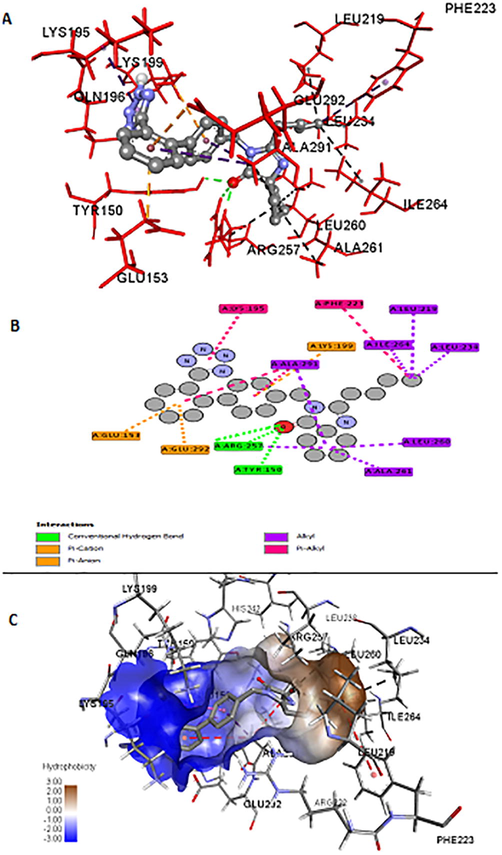
A) Binding interactions of IRB with Sudlow’s site I of HSA; Ball and stick model represents IRB; Red sticks are the binding site residues; green colour bonds are the hydrogen bonds displayed with the bond lengths in Å; Yellow bonds are the electrostatic interactions; Purple and black colour bonds are the hydrophobic Pi-alkyl, alkyl-alkyl interactions respectively. B) 2-D picture of IRB docked to site I of HSA is self-explanatory; Balls are the atoms of IRB and plates are the interacting amino acids. C) IRB (stick) occupies the hydrophobic cleft formed by the residues (wires) surrounding the brown colour region. The red colour hydrophobic interactions occurred at a distance greater than 5 Å, hence considered insignificant.
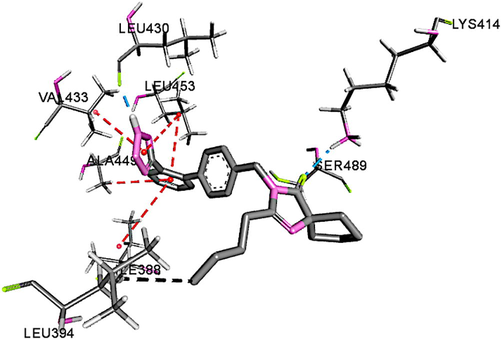
Binding interactions of IRB with site II of HSA. Green color bonds are the hydrogen bonds, purple and black bonds are π-alkyl and alkyl interactions respectively.
The number of hydrogen bonds and π–charge (electrostatic) interactions were more and stronger with site-I than site-II as indicated in Table 2. The strength of hydrogen bonds formed by IRB with site-I was greater than the electrostatic forces, which means that hydrogen bond attractions are the primary attractions involved in stabilization of the interaction of IRB with site-I. The site-I corresponded to the sub-domain IIA (Li et al., 2010). Therefore, IRB effectively occupied the hydrophobic Sudlow’s binding site-I of HSA. Based on the predicted inter-atomic distances, the strength of the interactions of IRB with HSA is in the following order: H-bonds > Electrostatic > Hydrophobic. This strong binding of IRB with HSA shall influence the pharmacokinetic properties of IRB, thus decreasing its free blood concentration (Chatterjee et al., 2012).
Docking experiment supports the results of IR and UV studies as it predicted the efficient binding of HSA with IRB. UV studies suggested hydrophobic interactions with IIA sub-domain. The intensity changes observed in IR studies suggested the existence of hydrogen between IRB and C=O and NH groups of the peptide. These results correlate well with the intermolecular hydrogen bond and hydrophobic interactions explored by docking. Telmisartan and Valsartan were predicted to interact with subdomain IIIA of site II of HSA. Hydrophobic and electrostatic interactions significantly influenced the binding stability of Telmisartan and Valsartan, respectively (Alanazi et al., 2018). IRB exhibits a binding pattern different from the above two drugs.
4 Conclusions
The binding of IRB with HSA was assessed using FT-IR, UV-spectroscopy and the in silico molecular docking techniques. These techniques have various advantages compared to others in being straightforward, easy-to-perform and cost-effective. Also, these techniques do not require much expertise and do not include tedious sample preparation techniques as compared to others. As evident from the spectroscopic studies, IRB showed good interaction with the serum protein. It showed the hydrophobic and H-bonding interactions between the two molecules. Upon interaction with IRB, the microenvironment around the aromatic amino acid and the α-helical content of the protein secondary structure changed considerably, which were detected by these spectroscopic techniques. These interactions were confirmed by the molecular docking technique, which exhibited similar results. Studying drug binding to the serum albumin protein is crucial to predict and compare drugs' pharmacokinetic and pharmacodynamic properties. The strong binding interaction would lead to lower plasma free drug concentration needed to produce the required level of pharmacological actions. On the other hand, weak interactions would lead to poor distribution and a shorter drug half-life due to faster biotransformation and elimination.
Declaration of interest
The authors announce no conflict of interest.
Funding
The current research did not receive any grant from the funding agencies.
Declaration of Competing Interest
The authors declare that they have no known competing financial interests or personal relationships that could have appeared to influence the work reported in this paper.
References
- A quantitative secondary structure analysis of the 33 kDa extrinsic polypeptide of photosystem II by FTIR spectroscopy. FEBS Lett.. 1995;363(1–2):65-68.
- [CrossRef] [Google Scholar]
- Spectroscopic and molecular docking studies of the binding of the angiotensin II receptor blockers (ARBs) azilsartan, eprosartan and olmesartan to bovine serum albumin. J. Lumin.. 2018;203:616-628.
- [Google Scholar]
- Towards the functional high-resolution coordination chemistry of blood plasma human serum albumin. J. Inorg. Biochem.. 2019;198:110716.
- [Google Scholar]
- FT-IR analysis for structural characterization of albumin adsorbed on the reversed-phase support RP-C 6. Appl. Spectrosc.. 1995;49(12):1737-1746.
- [Google Scholar]
- Spectroscopic and molecular docking studies for characterizing binding mechanism and conformational changes of human serum albumin upon interaction with Telmisartan. Saudi Pharm J.. 2020;28(6):729-736.
- [CrossRef] [Google Scholar]
- A combined spectroscopic and crystallographic approach to probing drug–human serum albumin interactions. Bioorg. Med. Chem.. 2010;18(21):7486-7496.
- [CrossRef] [Google Scholar]
- Examination of the secondary structure of proteins by deconvolved FTIR spectra. Biopolymers. 1986;25(3):469-487.
- [CrossRef] [Google Scholar]
- Preliminary crystallographic studies of four crystal forms of serum albumin. Eur. J. Biochem.. 1994;226(3):1049-1052.
- [Google Scholar]
- Interaction of virstatin with human serum albumin: spectroscopic analysis and molecular modeling. PLoS ONE. 2012;7(5):e37468.
- [CrossRef] [Google Scholar]
- Effects of telmisartan, irbesartan, valsartan, candesartan, and losartan on cancers in 15 trials enrolling 138 769 individuals. J. Hypertens.. 2011;29(4):623-635.
- [CrossRef] [Google Scholar]
- Interactions between 1-benzoyl-4-p-chlorophenyl thiosemicarbazide and serum albumin: investigation by fluorescence spectroscopy. Bioorg. Med. Chem.. 2004;12(1):151-157.
- [CrossRef] [Google Scholar]
- Lessons from the crystallographic analysis of small molecule binding to human serum albumin. Drug Metab. Pharmacokinet.. 2009;24(4):342-357.
- [CrossRef] [Google Scholar]
- On the spectral subtraction of water from the FT-IR spectra of aqueous solutions of proteins. Appl. Spectrosc.. 1989;43(3):538-542.
- [CrossRef] [Google Scholar]
- Structural basis of the drug-binding specificity of human serum albumin. J. Mol. Biol.. 2005;353(1):38-52.
- [CrossRef] [Google Scholar]
- A fluorescence spectroscopic study of the interaction between epristeride and bovin serum albumine and its analytical application. Talanta. 2007;73(4):668-673.
- [CrossRef] [Google Scholar]
- Enhancing UCSF Chimera through web services. Nucleic Acids Res.. 2014;42(1):478-484.
- [CrossRef] [Google Scholar]
- Predicting plasma protein binding of drugs: a new approach. Biochem. Pharmacol.. 2002;64(9):1355-1374.
- [CrossRef] [Google Scholar]
- Review: modifications of human serum albumin and their binding effect. Curr. Pharm. Des.. 2015;21(14):1862-1865.
- [Google Scholar]
- Characterization of the binding of angiotensin II receptor blockers to human serum albumin using docking and molecular dynamics simulation. J. Mol. Model.. 2010;16(4):789-798.
- [CrossRef] [Google Scholar]
- Non-covalent binding analysis of sulfamethoxazole to human serum albumin: fluorescence spectroscopy, UV–vis, FT-IR, voltammetric and molecular modeling. J. Pharm. Anal.. 2015;5(3):143-152.
- [Google Scholar]
- A comprehensive spectroscopic and computational investigation to probe the interaction of antineoplastic drug nordihydroguaiaretic acid with serum albumins. PLoS ONE. 2016;11(7):e0158833.
- [CrossRef] [Google Scholar]
- Binding of ochratoxin A derivatives to human serum albumin. J. Phys. Chem. B. 2003;107(27):6644-6647.
- [Google Scholar]
- Crystal structure analysis of warfarin binding to human serum albumin anatomy of drug site I. J. Biol. Chem.. 2001;276(25):22804-22809.
- [CrossRef] [Google Scholar]
- Mixed-ligand copper(II)- phenolate complexes: effect of coligand on enhanced DNA and protein binding, DNA cleavage, and anticancer activity. Inorg. Chem.. 2007;46:8208-8221.
- [CrossRef] [Google Scholar]
- Probing the Sudlow binding site with warfarin: how does gold nanocluster growth alter human serum albumin? Phys. Chem. Chem. Phys.. 2016;18(33):22874-22878.
- [CrossRef] [Google Scholar]
- Structural basis of binding of fluorescent, site-specific dansylated amino acids to human serum albumin. J. Struct. Biol.. 2011;174(1):84-91.
- [Google Scholar]
- Studying the interaction of drug/ligand with serum albumin. J. Mol. Liq.. 2021;336:116200.
- [CrossRef] [Google Scholar]
- Preclinical pharmacokinetics: an approach towards safer and efficacious drugs. Curr. Drug Metab.. 2006;7(2):165-182.
- [Google Scholar]
- Drug-protein interactions: two-site binding of heterocyclic ligands to a monomeric hemoglobin. J. Inorg. Biochem.. 1996;62(3):155-169.
- [CrossRef] [Google Scholar]
- Further characterization of specific drug binding sites on human serum albumin. Mol. Pharmacol.. 1976;12(6):1052-1061.
- [Google Scholar]
- Protein molecular basic. Beijing: The People’s Education Press; 1981.
- Molecular interaction study of an anticancer drug, ponatinib with human serum albumin using spectroscopic and molecular docking methods. Spectrochimica Acta Part A: Mol. Biomol. Spectrosc.. 2019;214:199-206.
- [Google Scholar]
- Interaction of irbesartan with bovine hemoglobin using spectroscopic techniques and molecular docking. Spectroscopy. 2012;27:119-128.
- [Google Scholar]
- Human serum albumin as an intrinsic signal amplification amplifier for ultrasensitive assays of the prostate-specific antigen in human plasma. Chem. Commun.. 2020;56(12):1843-1846.
- [Google Scholar]
- Subdomain IB Is the third major drug binding region of human serum albumin: toward the three-sites model. Mol. Pharm.. 2013;10(5):1668-1682.
- [Google Scholar]
- The interaction of human serum albumin with a novel antidiabetic agent—SU-118. J. Pharm. Sci.. 2004;93(4):1039-1046.
- [CrossRef] [Google Scholar]


