

Translate this page into:
Significance of core analysis and gamma-ray trends in depositional facies interpretation and reservoir evaluation of Cenomanian sequence, Alam El-Shawish East Oil Field, North Western Desert, Egypt
⁎Corresponding author. aabdelmoneim@sci.cu.edu.eg (Adel Abdelmoneim El-Tehiwy)
-
Received: ,
Accepted: ,
This article was originally published by Elsevier and was migrated to Scientific Scholar after the change of Publisher.
Peer review under responsibility of King Saud University.
Abstract
The present paper aims to evaluate the sedimentological model of the study Cenomanain sequence in terms of electrofacies interpretation and depositional facies architecture to reveal the spatial distribution of the reservoir facies characterization. The influence of depositional lithofacies types on reservoir characterization of the Cenomanian Bahariya Formation and Abu Roash “G” Member was investigated using the integration of available core data and petrophysical evaluation from seven wells in Alam El-Shawish East Oil Field, North Western Desert, Egypt. Careful log interpretation and correlation enable differentiation of the study sequence into ten sedimentary cycles. The stacking of the recognized facies types in the available cored interval, form fifteen depositional facies associations from which fluvial, estuarine and shoreline-shallow shelf models were constructed. This facies information has been used to calibrate the log response, particularly the gamma-ray trends, as an aid to interpret the depositional environment of the non-cored intervals. However, the generalized log pattern shows micro-variations in log shape and trend based on the location relative to depositional environment and consequently major modified gamma-ray patterns were proposed depending on the cored facies architecture. Therefore, precautions must be taken into consideration in extrapolating the present patterns to any similar heterogeneous sequence due to the effects of variable diagenetic and facies type constraints on log response. It is indicated that hydrocarbons could be accumulated within shoreface and barrier tidal inlet complex near or within the depositional sequence boundary surfaces along the Upper Bahariya Member and the upper unit of Abu Roash “G” Member. The associated fine siliciclastics (mudstone and shale) of tidal lagoon and/or shoreface delta facies may be acted as local source rock and trap seals. Based on reservoir characterization data supplemented by well logs interpretation of the cored and non-cored intervals, further reservoir beds could be recommended as potential prospecting targets.
Keywords
Cored facies architecture
Gamma-ray trends
Sedimentary cycles
Depositional environment
Reservoir evaluation

1 Introduction
The present research deals with facies analysis of Cenomanian sequence including Bahariya Formation and Abu Roash “G” Member as an important hydrocarbon reservoirs in North Western Desert, Egypt. This sequence is heterogeneous in lithofacies and possesses many challenges; because it mostly comprises reservoir rocks with several lateral and vertical seals which are characterized by erratic thickness and complicated geometrical and rapid facies changes. So, to assess the potential of this sequence, some petrophysical and core data were derived from seven wells in Alam El-Shawish East oil field which is considered as a part of Abu Sennan sub-basin in Abu Gharadig tectonic major basin in the North Western Desert (Fig. 1).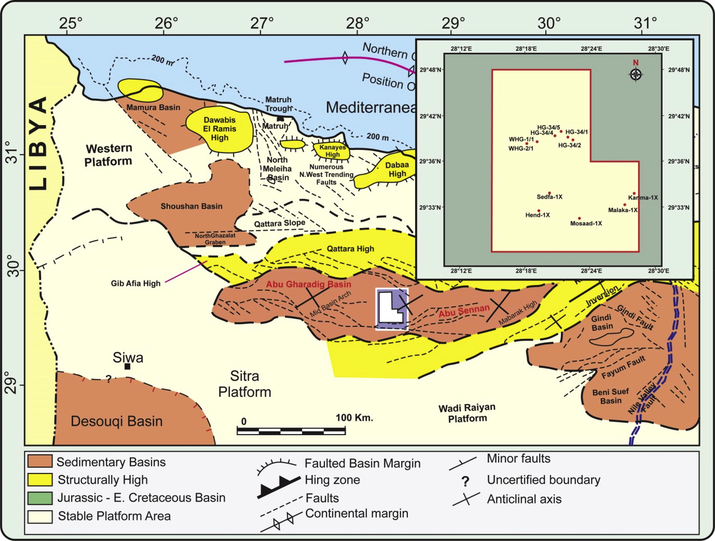
Index map showing the spatial distribution of the main sedimentary basins and major tectonics in the North Western Desert, modified after Bayoumi (1996) with location map for the study wells.
The facies identification was based on types of sedimentary structure, grain size distribution, mineralogical composition and other textural features. Well logs, particularly the gamma-ray trends (Van Wagoner et al., 1990; Slatt et al., 1992; Cant, 1992; Parkinson, 1996; Posamentier and Allen, 1999; Catuneanu, 2006; Siddiqui et al., 2013) are used to support the depositional environment interpretation of the recognized facies associations. The study succession comprises depositional facies sequences belonging to three proposed sedimentary models or mixture of them (Walker, 1984; Boyd et al., 2006).
Gamma-ray log patterns (electrofacies patterns) were basically interpreted approximately according to the models of Cant (1992) and Siddiqui et al. (2013) and others with major modification that based on the present facies architecture and facies types interpretation. The core information has been used to calibrate the log response which was used to interpret the non-cored wells.
The main objective of this paper is trying to build a model for depositional facies associations by calibration of gamma ray trends with the recognized facies types in the available cored intervals to expect or anticipate the different depositional environment of the non-cored intervals, we recommended some sandstone intervals within shoreface facies and clastic barrier inlet facies that are most promising reservoir beds and some non-cored intervals of tidal barriers in the Middle Bahariya Member and tidal sand flat and channel in the Lower Bahariya Member in some wells that could be recommended as potential prospecting targets.
2 Geological setting and petroleum system
Sedimentological and tectonical setting, hydrocarbon evaluation, surface and subsurface litho-stratigraphic sequence of the Bahariya and Abu Roash formations in the northern part of the Western Desert, have been studied by several authors, of them: Darwish et al. (1994), Ibrahim and Aly (1994), Bayoumi (1996), Moustafa et al. (2003), Catuneanu et al. (2006), Darwish et al. (2008), Moustafa (2013), Abd Elhady et al. (2014), Dolson et al. (2014) and El-Anbaawy et al. (2017). It is worth to mention that the most related recent study is that of El-Tehiwy (2018). He discussed the stratigraphic sequences, the rock typing, diagenetic history and the reservoir characteristics of the study sequence.
The Bahariya Formation is divided into Lower (Late Albian), Middle (Early Cenomanian) and Upper (Early-Middle Cenomanian) members respectively. The Abu Roash “G” Member is divided into: lower unit (Middle Cenomanian) and upper unit (Late Cenomanian). The study rock units are composed of siliciclastics-carbonate facies sequence showing general overall transgressive sedimentary cycles and system tracts (EL-Tehiwy, 2018).
Detailed study of seismic cross sections and structural maps of the study area as a part of Abu Gharadig basin, indicates that the study area has complex structural features with frequent faulting and folding that may be related to the rifting or inversion phases (El-Tehiwy, 2018). The faults are mostly normal faults with few strike slip movements. The majority of the folds are asymmetrical doubly plunging anticlines oriented in directions that are mainly controlled by the faults orientation (El-Tehiwy op. cit.). These anticlines, as well as tilted fault blocks form the main hydrocarbon traps in Bahariya Formation and Abu Roash “G” Member. In this respect the trap seal rocks are shale interbeds with the sandstone reservoir as well as the carbonate cap rock of Abu Roash “F” Member which prevents further upward migration of the hydrocarbons.
3 Aims and methods of the study
The composite well logs of the available seven wells, namely; WHG 2/1, WHG 1/1, HG 34/4 (northern sector), Sedfa-1X, Hend-1X, Mosaad-1X (southern sector) and Karima-1X (eastern sector) are shown in Fig. 1. Wireline log patterns and trends with the help of the conventional core information and facies interpretation were applied as a guide and starting point for construction of depositional models. Lithostratigraphic correlation of the study rock units with the equivalent units in the nearby wells and oil fields have been carried out using the regional geological studies (e.g. Darwish et al., 1994; Ibrahim and Aly, 1994). Evaluation of reservoir characteristics was carried out using the petrophysical parameters (e.g. Shale content, water saturation, hydrocarbon saturation and net-pay thickness). Integration of all results and their interpretations were carried out to evaluate the hydrocarbon potentiality of the study wells.
4 Results
4.1 Sedimentary cycles
The detailed examination of the wireline logs detection of the marker log signatures and careful log correlation particularly those of the total gammy-ray log mirror images (Figs. 2a and 2b), enable differentiation of the Bahariya Formation and Abu Roash “G” Member into ten distinctive sedimentary cycles that are assigned from base to top, by numbers 1–10 (Figs. 2a and 2b). These cycles are easily differentiated, not only on the basis of their characterized petrophysical signatures but also on the sedimentological background of the facies studies of each subunits.
Stratigraphic correlation panel of the sedimentary cycles recognized in the Bahariya Formation and Abu Roash “G” Member in Alam El-Shawish area (Central Block).

Stratigraphic correlation panel of the sedimentary cycles recognized in the Bahariya Formation and Abu Roash “G” Member in Alam El-Shawish area (Block II).
The high gamma-ray reading combined with the density log that indicates mudstone or shale thin beds, represent log markers at the tops of cycles (1), (2), (3) and (4) which compose the Lower Bahariya Member, while cycle (5) that represents the Middle Bahariya Member, is bounded by two distinctive litho-log markers. The Upper Baharyia Member represented by cycles 6 and 7, is unconformably underlain by the Middle Bahariya Member.
The log correlation (Figs. 2a and 2b) enables differentiation of the Abu Roash “G” Member into three sedimentary cycles; the lower two cycles (8 and 9) compose the lower unit, while the third one (cycle 10) composes its upper unit. The top of the upper unit (cycle 10) is determined by the high gamma-ray marker which underlies the laterally persistent Abu Roash “F” carbonate beds.
4.2 Electrofacies pattern and facies types
The interpretation of the depositional environment in the study Cenomanian sequence was carried out based on the characteristics of the identified facies types (Table 1) as well as on the well logs, particularly the gamma-ray log responses. The study facies types can be categorized into coarse siliciclastics, fine siliciclastics and carbonates lithofacies types (Table 1). On the other hand, from the gamma-ray log trend patterns, an electrofacies approach will be developed and applied for discriminating depositional environment. Therefore, well logs can be used to support the depositional environment interpretation where they provide information on physical rock properties, but not a pure straight explanation of lithology.
Facies types
Facies types
PXS
Planner cross-flat bedded sandstone
LSH
Laminated silty shale
FCS
Flaser bedding-cross laminated sandstone
TLS
Thin laminated siltstone
LTS
Laminated-trough-lenticular cross-bedded glauconitic sandstone
BSM
Banded sandy mudstone
WRS
Wave lenticular-current rippled bedded cross laminated sandstone
LHM
Laminated-hummocky flaser bedded fine sandy mudstone
BLS
Banded-Laminated ferruginous sandstone
BSH
Banded silty shale
HLS
Hummocky-lenticular cross bedded-laminated glauconitic sandstone
MBM
Massive bioclastic sandy mudstone
BWS
Bioturbated-wavy lenticular cross-laminated glauconitic sandstone
LBM
Laminated-banded bioclastic silty mudstone
LRS
Laminated-current rippled -bedded bioturbated muddy sandstone
MLS
Massive cross-bedded sandy fossiliferous limestone
FLS
Flaser-cross laminated bioclastic sandstone
NLS
Bioturbated-nodular fossiliferous limestone
MFS
Mottled-flaser cross laminated glauconitic sandstone
CLS
Cross-laminated fossiliferous silty limestone
CHS
Cross-laminated-hummocky cross bedded muddy sandstone
LLS
Laminated-massive bioclastic silty chalky limestone
MSM
Massive silty mudstone
ILS
Irregular (hummocky) cross laminated fossiliferous sandy chalky limestone
Major modification has been carried out trying to avoid the limitations of Cant (1992) and Siddiqui et al. (2013) electrofacies applications. According to the applications and modifications of the previously mentioned models as well as the facies types interpretation and the log response calibration that based on the available core information on the study wells, seven major log patterns were suggested to include the interpreted depositional environments (Numbers 1–20 inclusive), as given in Table 2. The following is brief description of the recognized gamma ray patterns.

Blocky boxcar (left) pattern normally suggests a constant energy level (high in clastic systems and low in carbonate environments) and constant sediment supply and sedimentation rates. This pattern with low gamma-ray value forms in upper-middle shoreface (1a) and lower middle shoreface (1b) of wave dominated shallow marine environment. It also points to carbonate facies representing by carbonate outer ramp of transition storm shelf, where it shows low gamma-ray with high resistivity, high density and low porosity.
Boxcar right pattern normally suggests low energy showing high gamma-ray values (Table 2). The boundaries with the overlying and underlying reading are abrupt in tidal dominated mud tidal flat environment (3) and in fluvial overbank mud environment (2). This pattern also points to offshore mud of shallow shelf (4) where it forms sharp boundaries with very small internal irregularities or changes in the high gamma-ray.
Funnel Pattern shows upward decrease of gamma-ray values consistently from maximum value, usually indicating decreasing shale content to form coarsening upward trend. This shape related to a transformation from shale to shale-free
lithologies due to upwardly increasing depositional energy (Siddiqui et al., 2013). In the study well sequences, this pattern is formed in channel crevasse splay (6), tidal sand bar (7), flood tidal delta mudstone (8a), tidal lagoonal silty shale (8b) environments belonging to fluvial, tidal and wave dominated estuary system respectively (Table 2).
Bell pattern formed by the increasing upward consistently from a minimum gamma-ray values usually indicated an increasing in shale content. In the study sequence the bell shape or fining upward trend are formed in tide dominated (tidal channel, 10) which corresponds to a retreating shoreline shelf system with decreasing energy. It is also formed in fluvial point bar (9).
Left bow pattern is developed by a cleaning upward overlain by dirtying up trend of similar grain size and with no sharp breaks between the two, shows left bow shape (Siddiqui et al., 2013). In the study well sequences, this trend form different deposition facies such as mixed muddy tidal flat (11), reworked offshore carbonate bar (12), shoreface delta (13), brecciated barrier tidal inlet (15a), clastic barrier tidal inlet (15b) and sandy carbonate barrier tidal inlet (15c) that belonging to variable environmental setting (Table 2). Occasionally, the log shows blocky to fining upward overlain by coarsening upward to form “hour glass” shape of the well log. This case of gamma-ray trend is very common characterizes the barrier tidal inlet containing carbonate sand shoals package which is altered from well to well along their vertical sequences. The coarsening upward pattern indicates a gradual shift toward progressively higher energy depositional environment (Catuneanu, 2006). This variety of left bow pattern is usually complicated case showing variable changes in log trend according to lithological variation and thickness of package as well as the glauconitic and calcareous (shell fragments) material contents.
Right bow pattern is the opposite of left shape; the trend is right bow shape in which sand bodies with medium to coarse grained overlying and underlying by muddy deposits without internal structure. In the study well sequences this trend form in mixed sandy dominated tidal flat (14).
Irregular/serrated pattern represents the fluctuated gamma-ray reading with high and low values (Table 2). It could be subdivided into three groups according the gamma-ray values ranges. This trend is formed in silty mud tidal flat (16) that belonging to group (a), with thin laminated silty mud intercalation having rare planner cross-stratification. The gamma-ray fluctuating in group (b) is smaller than group (a) where it is formed in silty sand tidal flat (17). This pattern of the gamma-ray trend (group c) is formed in fluvial flood plain (18), storm dominated inner shelf (19) and lower shoreface (20) environment belonging to the depositional macroforms of fluvial, transition storm shelf and shallow marine shelf respectively (Table 2).
4.3 Depositional macroforms
The recognized facies types (Table 1) and the interpreted depositional environments (Table 2) of the study sequence associate together in different proportion and stacking pattern forming six macroforms. These are fluvial (F), tidal-dominated estuary (TE), wave-dominated estuary (WE), wave-dominated shallow marine (shorefaces) (WM), transition storm (TS) and shallow marine shelf (SH) (Table 3). Some of these macroforms are compiled together to form new mixed macroforms (as given in Table 3). Each of these macroforms contains a facies association or more (A1-15), which inturn contains a vertical stacking of the associated facies types. The succession of the interpreted depositional environments, facies associations, sedimentary cycles, subcycles associated with sets of gamma-ray trends are shown in Figs. 3a and 3b as examples of the reservoir sequences in WHG 2/1 well. For the number of depositional environments (see Table 2). *Based on facies type characteristics and gamma-ray trends. ×Contain currently oil shows or promised to contain oil shows.
Facies associations
Facies types
Interpreted depositional environments*
Sedimentary cycles & subcycles
Depositional macroforms
A1
PXS, LSH, MSM
(9) fluvial point bar, (18) fluvial flood plain, (2) overbank mud
1a, b, 2a, 3a
(F)
Fluvial
A2
FCS, MSM
(6) Channel crevase splay, (2) overbank mud
1c, 2b
A3
TLS, BSM
(3) mud tidal flat, (11) mixed muddy tidal flat
4c, 4e, 7b, 7d
(TE)
Tidal-dominated estuary
A4
WRS, TLS
(17) silty sand tidal flat, (16) silty mud tidal flat, (3) mud tidal flat
3b, 4a
A5
LTSa, LTSb
(10) tidal channel, (7) tidal sand bar
4b, 4d
A6a
LHM, LLS
(8a) flood tidal delta mudstone, (15c) sandy carbonate barrier tidal inlet
5a, 6a
(WE)
Wave-dominated estuary
A6b
BSH, FLS×
(8b) tidal lagonal silty shale, (15b) clastic barrier tidal inlet
10c, d, e
A6c
FLS×, LHM
(15b) clastic barrier tidal inlet, (8a) flood tidal delta mudstone
7f
A7
MFS
(15a) brecciated barrier tidal inlet
Basal parts of cycles 4, 5, 7, 10
A8
LRS, HLS×
(13) shoreface delta, (1a) upper-middle shoreface
6b, 7c, 7e
(WM)
Wave-dominated shallow marine (shoreface)
A9
CHS
(20) lower shoreface
10g
A10
ILS
(19) storm dominated inner shelf
9a, 10b
(TS)
Transition storm shelf
A11
MBM, CLS
(4) offshore mud, (12) reworked offshore carbonate bar
6c
(SH)
Shallow marine shelf
A12
BLS, LLS
(14) sandy tidal flat, (15c) sandy carbonate barrier tidal inlet
7a
Mixed macroforms
TE + WE
A13
BWS, FLS×
(16) lower-middle shoreface, (15b) clastic barrier tidal inlet
8a, 8b
WM + WE
A14
LRS, FLS×
(13) shoreface delta, (15b) clastic barrier tidal inlet
10h
WM + WE
A15
NLS, MLS, LBM, MBM
(5) carbonate outer ramp, (4) offshore mud
5b, 8a, 8b, 8c, 9a, 9b
SH + TS

Graphic sedimentary log with facies interpretation of upper part (Cycles 6&7) of the Bahariya Formation.

Graphic sedimentary log with facies interpretation of AR/G Member (Cycles 8, 9 and 10).
4.4 Reservoir facies
The facies analysis of the cored reservoir intervals of the Upper Bahariya Member indicates a deposition in wave-dominated shallow marine (WM) and to subordinate a deposition in wave-dominated estuary (WE) (Tables 2 and 3). The upper-middle shoreface (Table 2) is mainly sandstone with lenticular cross bedding and hummocky structure. It is associated with shoreface delta sediments consisting of laminated-current rippled bedded bioturbated muddy sandstone or sandy mudstone (Fig. 4b). The clastic (sandstone) barrier tidal inlet (Table 2) is dominated by flaser cross lamination and bioclastics framework. It is usually intercalated with laminated silty shales of tidal delta wave dominated estuary (facies association A6c, Table 3 and Fig. 4a). The sandy carbonate barrier tidal inlet is composed of calcareous fine sandy laminated glauconitic limestone. It is usually associated with laminated hummocky flaser bedded fine sandy mudstone of tidal flat depositional facies or with tidal delta mudstone.
Reservoir characterization of Upper Member of Bahariya Formation and lower unit of AR/G Member (cycle 8) in well WHG 2/1 (Core 2), 3250–3277.8 m.

Reservoir characterization of Upper Member of Bahariya Formation in well HG 34/4 (Core 2), 3255–3283 m.
Facies analysis of the cored reservoir intervals of the Abu Roash “G” Member (mainly within the sedimentary cycle 10) indicates a deposition in wave-dominated estuary and shallow marine macroforms (Table 3, Figs. 3b, 5a and 5b). Occasionally, the estuarine environment is invaded by transition storm shelf condition particularly along the basal part of the sedimentary cycle 10 (Figs. 5a and 5b). The top of this cycle (non-cored interval) is dominated by shoreface delta clastic sequence (Fig. 3b). The main reservoir which belongs to cycle 10 is represented by several periods of repeated deposition of clastic barrier tidal inlet sediments intercalated with tidal lagoonal silty shale (Table 3 and Fig. 3b). The basal reservoir interval is represented occationally by brecciated barrier tidal inlet (Table 2). This reservoir rock is mottled flaser-cross laminated glauconitic (pyritic) bioclastic sandstone that characterized by low porosity and moderate permeability showing low oil saturation (Fig. 5b).
Reservoir characterization of upper unit of AR/G Member in well WHG 2/1 (Core 1), 3135–3162.7 m.

Reservoir characterization of upper unit of AR/G Member in well HG 34/4 (Core 1), 3083–3110 m.
4.5 Petrophysical evaluation of oil shows
Based on the petrophysical data, several representative reservoir intervals were tested and cored as given in Table 4. The petophysical evaluation of the studied wells revealed an existence of hydrocarbon accumulation or oil shows in the permeable zones of the Upper Member of the Bahariya Formation as well as in the Abu Roash “G” Member in WHG 2/1, WHG 1/1 and HG 34/4 wells (representing the northern sector) and Karima-1X well (representing the eastern sector). This evaluation has revealed also, an existence of water accumulation in the dry wells in Sedfa-1X, Hend-1X and Mosaad-1X wells which are located in the southern sector of the study area as given in Table 4. The representative litho-saturation cross-plots of the study reservoir intervals in WHG 2/1 are shown in Figs. 6a and 6b. test = petrophysical tested interval.
Structural sector
Well No.
Core & test interval
Reservoir units
Hydrocarbon potentiality
Bahariya Fm.
Abu Roash “G”
Northern
WHG 2/1
test
3323.5–3326.5
3115–3119
Fair to good in Bahariya and AR/G
core
3250–3278
3135–3162.7
Hydrocarbon accumulation
Hydrocarbon accumulation
WHG 1/1
test
3264–3271 3338–3355
Faulted out
Fair to good in Bahariya
core
Side well cores 3196–3440.4
Hydrocarbon accumulation
HG 34/4
test
3266–3273
–
Good reservoir in Bahariya and AR/G
core
3255–3283
3083–3113
Hydrocarbon accumulation
Hydrocarbon
Eastern
Karima-1X
test
2247–2252.5
1889–1912.5
Good reservoir in AR/G
core
no core
no core
Negligible Hydrocarbon
Hydrocarbon accumulation
Southern
Sedfa-1X
test
1963–1980
1825–1850
dry well
core
1903–1930.5
1837–1865
Water accumulation
Water accumulation
Hend-1X
test
1953–1980
1736–1751
dry well
core
1857–1885
1742–1770
Water accumulation
Water accumulation
Mosaad-1X
Test
–
–
dry well
core
No core
No core
Water accumulation
Water accumulation

Litho-saturation cross-plot of Upper Member of Bahariya Formation in WHG 2/1 well, showing hydrocarbon sub-reservoir interval.

Litho-saturation cross-plot of upper unit of Abu Roash “G” Member in WHG 2/1 well, showing hydrocarbon sub-reservoir interval.
5 Discussion
5.1 Significance of gamma-ray trends
The application of electrofacies patterns in the study succession is limited to recognize the micro-variations in heterogenetic lithological characteristics of both siliciclastics and carbonates. The gamma-ray logging may loss the accuracy to differentiate the lithology and its radioactive minerals (e.g. in highly glauconitic sandstone intervals). Another important limitation was concluded by Siddiqui et al. (2013); that the gamma-ray trend in each depositional environment shows different shape/trend that may be similar within two or more depositional environments. According to Siddiqui et al. (op.cit.) the tide-dominated major environment shows blocky left boxcar, funnel shaped, bell shaped, right boxcar and irregular gamma-ray trends, while the wave-dominated major environment shows left and right boxcar, funnel shaped and irregular trends. The main difference between the tide and wave-dominated depositional environments is the fluctuating GR values (Siddiqui et al., 2013). According to Cant (1992) cylindrical (blocky boxbar) gamma-ray pattern characterizes many depositional environments (e.g. eolian, braided fluvial, channel-fill, submarine canyon-fill). Funnel and bell-shaped patterns characterize crevasse splay, river mouth bar, delta front, shoreface, submarine fan, fluvial point bar, tidal point bar, deep tidal channel fill and tidal flat, respectively. The hour glass (symmetrical prograding and retrograding) gamma-ray trend indicates reworked offshore bar, regressive to transgressive storm face delta (Cant, 1992).
He also concluded that serrated (irregular) trend may characterize fluvial floodplain, storm-dominated shelf, deep marine slope. In conclusion electrofacies are characterized and grouped into sub-populations which would provide a method for estimating the lithologic characteristics of the formation and ultimately to distinguish it from surroundings. Furthermore, the environmental interpretation of the cored sequences in the study wells (WHG 2/1, HG 34/4, Hend-1X and Sedfa-1X) is used as a guide and starting point for the construction of the depositional model in this study. The core information has been used to calibrate the log response which was used to interpret the non-cored wells. However, the generalized log pattern shows micro-variations in log shape based on the location relative to depositional environment. Accordingly, major modification has been carried out trying to avoid the limitations of Cant (1992) and Siddiqui et al. (2013) electrofacies applications. The result of this modification is given in Tables 2 and 3. According to the applications and modifications of the previously mentioned models (e.g. Cant, 1992; Siddiqui et al., 2013) as well as the facies types interpretation and the log response calibration that based on the available core information on the study wells, seven major log patterns were suggested to include the interpreted depositional environments (Numbers 1–20 inclusive), as given in Table 2.
5.2 Modeling of depositional setting
The field of facies models is still a relatively young field with a history of less than forty years where observations which were collected through measurements in modern environments, outcrops, wireline log, core and borehole studies, have been incorporated into depositional facies models since the middle of the twentieth century (Boyd et al., 2006). The facies analysis and the interpreted facies associations revealed that the study Upper Albian-Cenomanian succession of the Bahariya Formation and AR/G Member is one of the best representative's ancient depositional records for fluvio-marine facies models. Much siliciclastic and carbonate sediments of these rock units were deposited along fluvial, estuarine and marine shoreline-shallow shelf mixed environments. Along these environmental setting, sediment supply, tidal range, wave action and storm frequency are generally discussed. The effects of external and internal factors (e.g. sea-level changes, tectonic setting and climatic conditions) on the sedimentation of the study succession in terms of facies sequences and evolution were discussed (El-Tehiwy, 2018). Most of the ancient environments deviate in some way from the idealized models due to such factors in addition to mixed influence of marine and fluvial processes.
Try to applying the concepts of distillation and simplification of Walker (1984) and Boyd et al. (2006) respectively, the study succession comprises depositional facies sequences belonging to three proposed sedimentary models or mixture of them; they are: Fluvial sedimentary model, Estuarine sedimentary model and Marine shoreline-shallow shelf model.
Many factors influence the nature of the spatial changes in depositional facies models, from fluviatile model of sedimentary cycle (1), (2) and lower part of (3) of Bahariya Formation to tidal estuarine to shoreface and offshore shallow shelf models of Abu Roash “G” Member, however, the most important factor is the impact of sea level sequence changes. This changes are controlled by combination of eustatic changes, subsidence/uplift of depositional basin of sub-basins and/or substantial variations in the rate sediment supply.
It is not by chance the majority of hydrocarbon accumulation with moderate to good reservoir quality, occur within the barrier tidal inlet complex. The majority of the identified deposional facies associations (e.g. A6a, A7, A8; Table 3) essentially exist within or near the unconformity sequence boundary surfaces. Exceptionally, the oil shows occur within sandy-silty tidal flat representing mixed marine estuarine facies that may be developed upon the wave ravinement surface.
6 Conclusion
The interpretation and correlation of the available core data and wireline logs particularly the gamma-ray logs patterns of the study sequence show internal cyclicity that was confirmed by the facies analysis and modelling. The recognized twenty four facies types can be categorized into coarse and fine siliciclastics and carbonate lithofacies types. The integration of the core information and the calibrated log responses lead to revealing twenty depositional environments. It is indicated that the study siliciclastic and carbonate sediments were deposited along fluvial, estuarine and marine shoreline-shallow shelf mixed environment models. However, most of the interpreted depositional environments deviate in some way from the idealized models due to the effects of external and internal factors (e.g. sea-level condition) in addition to further mixed influence of marine and fluvial processes. Therefore, precaution must be taken in extrapolating the present conclusion to the nearby subsurface extensions.
The study provides a trial to find reasons for the absence of hydrocarbon in the southern sector block including Sedfa-1X, Hend-1X and Mosaad-1X wells, through reviewing and integration of the concerned facies analysis, seismic data and well logging interpretation. This trial results in the following conclusions:
-
The reservoir facies characteristics are not causative factor controlling the hydrocarbon absence from the southern sector wells.
-
The structural trapping condition which was suitable for hydrocarbon accumulation in the wells of the northern sector was not available in the southern sector wells. Therefore, the difference in the structure style between the different sectors is considered herein the main reason for the variation in reservoir potentialities.
-
Based on the data supplemented during this trial further reservoir beds could be predicted within the study rock units.
It is found that the sandstone intervals within shoreface facies and clastic barrier inlet facies are most promising beds as a good reservoir. However, some non-cored intervals of tidal barriers in the Middle Bahariya Member and tidal sand flat and channel in the Lower Bahariya Member in some wells could be recommended as potential prospecting targets. So it's recommended to drill exploratory wells in the northern sector to completely evaluate the study rock units taking the present conclusion into consideration.
Acknowledgement
The authors extend grateful thanks to the Egyptian General Petroleum Corporation (EGPC) and to the Naftogaz of Ukraine Petroleum Company for data release and permission to publish this article.
References
- A new hydrocarbon prospect determination through subsurface and petrophysical evaluation of Abu Roash “G” Member in Abu Sennan area, north Western Desert. Egpt. Nat. Sci.. 2014;12(11):199-218.
- [Google Scholar]
- Bayoumi, T., 1996. The influence of interaction of depositional environment and synsedimentary tectonics on the development of some Late Cretaceous source rocks, Abu Gharadig Basin, Western Desert, Egypt. In Proceedings of the EGPC 13th Petroleum Exploration & Production Conference, Cairo (Vol. 2, pp. 475–496).
- Boyd, R., Dalrymple, R.W. and Zaitlin, B.A., 2006. Estuary and incised valley facies models. In: Posamentier, H.W., Walker, R.G. (Eds.), Facies Models Revisited. SEPM Special Publication, vol. 84, pp. 171–234.
- Cant, D.J., 1992. Subsurface Facies Analysis, In: R. G. Walker and N. P. James, Eds., Facies Models: Response to Sea Level Change, Geological Association of Canada, GeoText 1, pp. 27-45.
- Principles of Sequence Stratigraphy. Amsterdam: Elsevier; 2006.
- Sequence stratigraphy of the lower cenomanian bahariya formation, bahariya oasis, western desert Egypt. Sedimen. Geol.. 2006;190(1–4):121-137.
- [Google Scholar]
- Sedimentology, environmental conditions and hydrocarbon habitat of the Bahariya Formation, Central Abu Gharadig Basin, Western Desert, Egypt. In: EGPC 12th Petroleum Exploration and Production Conference. 1994. p. :429-449.
- [Google Scholar]
- Darwish, M., Abou Khadra, A.M. and Sami, M., 2008. Lithostratigraphy, sedimentology and reservoir zonation of Abu Roash “G” Member, Wadi Rayan Area, Egypt. 9th Intern. Conf. Geol. Arab. World, Cairo Univ., Egypt (Abst.), p. 7.
- Dolson, J.C., Atta, M., Blanchard, D., Sehim, A., Villinski, J., Loutit, T. and Romine, K., 2014. Egypt’s future petroleum resources: A revised look into the 21st century, in L. Marlow, C. Kendall and L. Yose, eds., Petroleum systems of the Tethyan region: AAPG Memoir 106, p. 143–178.
- Reservoir quality of Upper “G” Member sandstone of Abu Roash Formation, Azhar Field, Beni Suef basin, Nile Valley, Egypt. IOSR J. Appl. Geol. Geophys. (IOSR-JAGG). 2017;5(6):10-23.
- [Google Scholar]
- Sedimentological Model and Reservoir Evaluation of the Cretaceous Succession in Alam El-Shawish East Oil Field, Western Desert, Egypt, with Special Emphasis on Cenomanian Sequences. Geology Department, Cairo University; 2018. Unpublished PhD. Thesis
- Ibrahim, M. and Aly, M., 1994. The impact of environmental problems on open hole log evaluation of Bahariya Formation, Western Desert, Egypt. Proc. EGPC l2th Petrol. Expl. Prod. Conf., Cairo, II, pp. 248-262.
- Fold-related faults in the Syrian Arc belt of Northern Egypt. Mar. Petrol. Geol.. 2013;48:441-454.
- [Google Scholar]
- Structural setting and tectonic evolution of the Bahariya Depression, Western Desert. Egypt. GEOARABIA-MANAMA. 2003;8:91-124.
- [Google Scholar]
- Parkinson, D.N., 1996. Gamma-ray Spectrometry as a Tool for Stratigraphical Interpretation: Examples from the Western European Lower Jurassic. In: Hesselbo, S.P. and D.N. Parkison (Eds.), Sequence Stratigraphy in British Geology. Geological Society Special Publication, S.l., pp: 277.
- Siliciclastic Sequence Stratigraphy: Concepts and Applications. Tulsa, Oklahoma: SEPM (Society for Sedimentary Geology); 1999. p. :210. Vol. 7
- Depositional environment of shallow-marine sandstones from outcrop gamma-ray logs, belait formation, meragang beach, brunei darussalam. Res. J. Environ. Earth Sci.. 2013;5(6):305-324.
- [Google Scholar]
- Outcrop gamma-ray logging to improve understanding of subsurface well log correlations. Geol. Soc. Lon. Spec. Publ.. 1992;65(1):3-19.
- [Google Scholar]
- Siliciclastic Sequence Stratigraphy in Well Logs, Cores, and Outcrops: Concepts for High-Resolution Correlation of Time and Facies. Tulsa, Ok., USA: American Association of Petroleum Geologist; 1990. p. :55.
- Walker, R. G., 1984. Shelf sands and shallow marine sands, In: Walker, R. G., (ed.), Facies models, second edition: Geoscience Canada, reprint series 1, p. 141–170.


