

Translate this page into:
sHLA-G as a biomarker for colorectal cancer pathogenesis
⁎Corresponding author at: LR03ES03, Laboratoire Microorganismes et Biomolécules Actives. Faculté des Sciences de Tunis. Université de Tunis El Manar, 2092 Tunis, Tunisia. ines.zidi@istmt.utm.tn (Inès Zidi)
-
Received: ,
Accepted: ,
This article was originally published by Elsevier and was migrated to Scientific Scholar after the change of Publisher.
Peer review under responsibility of King Saud University.
Abstract
Objectives
Colorectal cancer (CRC) is a serious gastrointestinal disease. Cancer cells can survive in a microenvironment that includes distinct immune cells, various immune checkpoints including HLA-G, and different immune effectors such as interleukin-6 (IL-6), TNF-alpha (TNF-α), and interferon-gamma (IFN-γ). Thus, the objective of this study was to investigate HLA-G involvement in CRC as a prognostic factor in the Tunisian population, both in its soluble form (sHLA-G) and in its form linked to extracellular vesicles (HLA-GEV). Additionally, we examined its association to the secretion of cytokines.
Methods
Fifty Tunisian patients, diagnosed with CRC, matched with ninety-eight healthy blood donors (HD) were enrolled in this study. Levels of sHLA-G, HLA-GEV, IL-6, TNF-α, and IFN-γ were dosed in plasma samples using specific ELISA. For the functional assay, we assessed sHLA-G effects on the production of cytokines by stimulated T lymphocytes. We measured the concentration of IL-6, TNF-α, and IFN-γ produced by activated T lymphocytes pre-stimulated by plasma sHLA-G and HLA-GEV.
Results
Our case-control analysis showed high concentration of both sHLA-G (8.8 [0–63] ng/ml vs. 2.1 [0–63] ng/ml, p < 0.0001) and HLA-GEV (0.9 [0–17.8] ng/ml vs. 0.3 [0–31.0] ng/ml, p = 0.018) in CRC patients compared to HD. Concerning cytokines, IL-6 exclusively increased compared to HD (7.1[0.0–104.0] pg/ml vs. 3.6[0.0–58.22] pg/ml, p = 0.005). The evaluation of diagnostic performance using the receiver operating characteristic (ROC) curves and the area under the curve (AUC) showed sHLA-G (AUC = 0.828) as the more adequate biomarker in colorectal carcinoma prediction compared to HLA-GEV (AUC = 0.615) and IL-6 (AUC = 0.664). We found that sHLA-G is able to decrease IL-6, TNF-α, and IFN-γ production by stimulated T lymphocytes in a concentration-independent manner. Additionally, HLA-GEV appears to downregulate solely IL-6 release by stimulated T lymphocytes. Interestingly, HLA-GEV was related to lymph node infiltration, which represents the most common metastatic route for colorectal cancer via the lymphatic system.
Conclusions
We outlined the importance of sHLA-G and HLA-GEV as substantial immune biomarkers in CRC. Our findings suggest that HLA-G could be an effective diagnostic tool for colorectal cancer.
Keywords
Colorectal cancer
sHLA-G
Extracellular vesicles
Cytokines
T lymphocytes

1 Introduction
Colorectal cancer (CRC) is one of the most prevalent digestive cancers in the world. According to the latest Global Cancer Statistics report, almost 2 million new CRC cases and 935.000 deaths were registered in 2020 (Sung et al., 2021). Eventually, the rates of CRC-associated mortality are estimated to reach between 60 and 70% by 2035 (Araghi et al., 2019). There are several biological, genetic (e.g. mutations in anti-suppressor effectors), and molecular (e.g. oxidative stress and inflammation through cytokine secretion) approaches implicated in CRC susceptibility and outcome (Barral et al., 2016, Kolligs, 2016, Begum et al., 2021).
Over the last decades, many reports have explored the relation between the immune system and cancer. Indeed, several mechanisms might empower extensively the tumor spread including the modulation of the CD8+ T lymphocytes (CTLs) and natural killer (NK) cells cytotoxicity, the impairment of B lymphocytes and dendritic cells (DCs) functions leading to an immune-tolerant tumor microenvironment (Gonzalez et al., 2018). Immunologists underlined an important cancer immunoediting process during which the immunity has dual opposite functions. In the early phases of tumor development, body defenses discard and obstruct as a general rule abnormal cell growth, whereas in late phases, they appear to be exceptionally responsible for tumor progression (Vesely et al., 2011). Actually, malignant cells have intriguingly adopted numerous strategies to evade immune surveillance by i) avoiding immune recognition through the alteration of major histocompatibility complex (MHC) expression, ii) production of immunosuppressive cytokines, and iii) expression of programmed death-ligand 1 (PD-L1) or CD80/86, which enables interaction with the cognate receptors on T and NK cells hampering immune function (Gonzalez et al., 2018, Teng et al., 2015, Chen et al., 2021). Nevertheless, many questions still need answers concerning the strategy of the immune system in either fighting or sustaining malignancies.
Based on their morphological characteristics, restricted polymorphisms, and limited cellular distribution, HLA-G is classified as a non-classical HLA class I molecule (Carosella et al., 2008). The examination of its structural diversity allows to categorize HLA-G within two major groups: membrane-bound (mHLA-G) and soluble molecules (sHLA-G) (Carosella et al., 2008). The final isoforms consist of proteins released into different biological fluids as free sHLA-G generated either by alternative splicing such as HLA-G5 (Carosella et al., 2008) or cleaved through proteolytic shedding by matrix metalloproteinases (MMPs) such as shed HLA-G1 (Park et al., 2004a). Additionally, Riteau and co-authors demonstrated that HLA-G can also be secreted via extracellular vesicles (EV; HLA-GEV) in patients with melanoma (Riteau et al., 2003). Following their discovery, numerous efforts have been undertaken to better understand the accurate function of HLA-G. The interaction of HLA-G and its corresponding receptors, the immunoglobulin like transcript (ILT) receptor-2 (LILRB1/CD85j) and ILT4 (LILRB2/CD85d), and Killer cell immunoglobulin-like receptor 2DL4 (CD158d), triggers enormous effects modifying innate and adaptive immune responsiveness (Carosella et al., 2008, Morandi et al., 2007, Rouas-Freiss et al., 2003). For instance, HLA-G was found to restrain CTLs and NK cells cytotoxicity, to generate regulatory T lymphocytes (Tregs) and to down-regulate the alloproliferative response of CD4+ T lymphocytes (Carosella et al., 2008, LeMaoult et al., 2005, Chen et al., 2021). Initially, the role of HLA-G was thought to be limited to fetus-maternal interface and grafts tolerances (Rebmann et al., 2014). More recently, the contribution of sHLA-G was recognized in multiple respiratory (Cao et al., 2011), gynecological (Ben Yahia et al., 2018, Rebmann et al., 2003) and digestive (Cao et al., 2011, Lin et al., 2010) tumors. Although there is clear evidence indicating an aberrant up-regulation of sHLA-G expression in colorectal cancer (Cao et al., 2011, Zhu et al., 2011), some studies, on the contrary, have discarded any potential association between this molecule and CRC (Leelawat et al., 2004) or its clinicopathological characteristics (Zhu et al., 2011).
Recent experiments have identified EV as pivotal effectors in intercellular communication through harboring molecules (Rebmann et al., 2016). Furthermore, there are arising data claiming the implication of HLA-GEV in tumor progression (Rebmann et al., 2016). Grange and colleagues showed the capacity of HLA-GEV to hinder monocyte differentiation and proliferation to DCs, thereby disrupting the activation of T lymphocytes in renal cancer (Grange et al., 2015). Thus, it is suggested to perform future studies to discriminate between HLA-G as a free soluble molecule or as part of EV to understand the impact of these two soluble forms on malignant transformation and progression (Grange et al., 2015, Rebmann et al., 2016). Furthermore, some authors showed that these two forms of soluble HLA-G appear to promote adverse prognostic effects under pathological circumstances (Rebmann et al., 2016). The interaction between HLA-G and cytokines has progressively gained much attention. sHLA-G was considered to be a critical modulator ensuring the equilibrium between the production of T helper 1 (Th1) and T helper 2 (Th2) cytokines (Kanai et al., 2001, Kapasi et al., 2000, van der Meer et al., 2007), which was found to reciprocally regulate sHLA-G within pathophysiological events (Moreau et al., 1999, Sebti et al., 2007, Persson et al., 2020). Many reports have demonstrated that IL-6 and TNF-α might interfere in cancer initiation and migration along with their essential role in angiogenesis and recurrences (Mager et al., 2016). Moreover, some studies have underlined that IFN-γ seems to limit the multiplication of abnormal colonic cells and thereby impair neoplasms progression and dissemination (Castro et al., 2018, Mager et al., 2016).
Based on this knowledge, our study aims to evaluate the implication of secreted forms of HLA-G including soluble HLA-G (sHLA-G) as well as plasmatic HLA-G linked to EV (HLA-GEV), in CRC development and progression. In addition, we explored the relationship of these two soluble HLA-G forms with pro-inflammatory cytokines (IL-6, TNF-α and IFN-γ).
2 Materials and Methods
2.1 Population data and blood collection
Fifty Tunisian patients diagnosed with CRC (34 males and 16 females; mean age ± SEM (Standard Error of the Mean): 60.38 ± 2.085 years; range: 29–85 years) at the Institute of Salah Azaïz of Tunis (ISA, Tunisia) were enrolled in this study. The control group consisted of age- (unpaired t-test P = 0.188) and gender- (unpaired t-test P = 0.941) matched ninety-eight healthy donors (HD; 67 males and 31 females; mean age ± SEM: 57.16 ± 1.381 years; range: 27–89 years). After centrifugation of blood samples at 3500 rpm (round per minute) for 10 min (minutes) at 4 °C, plasma supernatants of the study population were stored at −80 °C until further analysis. None of the patients have undergone surgical intervention or have been the subject of neo-adjuvant chemotherapy and/or radiotherapy treatments during blood collection.
On the basis of the criteria recommended by the American Joint Committee on Cancer (AJCC, eighth edition) and the World Health Organization (WHO, fifth edition), we documented clinicopathological parameters for each patient including tumor-node-metastasis (TNM) classification, location, tumor size, histological type, and degree of differentiation. We documented also gender, age, familial antecedents, and lifestyle habits (alcohol, smoking) for each patient.
All patients and volunteers have given their written consent to participate in the present study. This work was approved by the ethics committee of ISA (Ref N°: ISA/2016/3).
2.2 Quantification of sHLA-G and HLA-GEV
Quantification of plasmatic sHLA-G and HLA-GEV concentrations was performed according to the Essen Workshop protocol for soluble HLA-G measurement (Rebmann et al., 2005). The total amount of sHLA-G and HLA-GEV after EV enrichment was quantified in plasma samples or EV preparation in a 1:1 dilution by sandwich Enzyme-Linked Immuno-Sorbent Assay (ELISA) technique. Purified HLA-G1 was used as standard reagent (Celik et al., 2018). The monoclonal antibody (mAb) MEM-G9 (Exbio, Praha, Czech Republic) was used as capture antibody to target both sHLA-G and HLA-GEV. The detection antibody was a polyclonal rabbit anti-human beta-2-microglobulin (Dako, Glostrup, Denmark). All ELISA assays were assessed in duplicates. Absorbance values were measured via BioTekTMmicroplate reader at 450 nm and then analyzed with Gen5TMdata collection and analysis software (version 1.11). The intra- and inter-assay variation of the ELISA was 2.5% and 16.9%, respectively.
2.3 Isolation of extracellular vesicles (EV)
EV were extracted from plasma samples using the ExoQuickTM precipitation solution (SBI Systems Bioscience, Palo Alto, CA, USA) as previously reported (König et al., 2016; Schwich et al., 2019). At the outset, we weighted 63 µg of ExoQuick™ solution in a sterile 15 ml conical Falcon tube. A total volume of 250 µl of plasma samples was then added to the ExoQuick™ solution. After being mixed, tubes were incubated overnight (at least 12 h) at 4 °C for EV precipitation and then centrifuged at 1500×g for 30 min. Supernatant was discarded and the remaining pellet of enriched EV was resuspended in 25 µl Aqua-dest and adjusted with 0.9% NaCl to a final volume of 250 µl.
2.4 Isolation of plasma derived sHLA-G and HLA-GEV
To mirror as close as possible the in-vivo situation of tumor patients, we enriched sHLA-G molecules and HLA-GEV from plasma samples of patients having low (sHLA-G < 10 ng/ml, HLA-GEV < 5.0 ng/ml), middle (sHLA-G:10–20 ng/ml, HLA-GEV: 5–10 ng/ml), and high HLA-G levels (sHLA-G > 20 ng/ml, HLA-GEV > 10 ng/ml). Plasmatic sHLA-G and HLA-GEV molecules from enriched EV fractions were isolated according to a standard protocol with minor modifications (Verloes et al., 2011, Veit et al., 2015). The anti-human HLA-G mAb G233 (Exbio) was coupled to Dynabeads® MyOneTM Carboxylic Acid (Thermofisher, Germany) according to the instruction of the manufacturer. Thereafter, beads (20 000) were incubated either with 110 µl EDTA plasma samples (N = 13) or with EV preparations (N = 16) overnight at room temperature. As a negative control, G233 coupled beads were incubated with complete medium (CM: RPMI 1640, Invitrogen, Karlsruhe, Germany) containing 1% penicillin/streptomycin, 200 μg/mL L-glutamine and 10% fetal calf serum. After two washing steps with PBS buffer containing Penicillin/Streptomycin, HLA-G loaded beads were adjusted to a final volume of 20 µl with CM. The sHLA-G unloaded microspheres (negative control) themselves did not influence functional analysis.
2.5 Priming of T lymphocytes with sHLA-G and CD28/CD3 T lymphocytes stimulation
Peripheral blood mononuclear cells (PBMCs) were freshly isolated from heparinized density gradient centrifugation using Lymphoprep™ (Alere Technologies AS, Oslo, Norway). To prime PBMCs with HLA-G (sHLA-G/HLA-GEV), we added 20 µl sHLA-G/HLA-GEV loaded or unloaded beads to the freshly isolated 50.000 PBMCs and cultured the suspension in a volume of 200 µl CM in 96 wells round-bottom plates. After 18 h of culture, sHLA-G/HLA-GEV primed cells were stimulated with beads coated with CD28/CD3 (Thermo Fisher Scientific, Lithuania) in a beads:cell ratio of 1:3 for 48 h (Schwich et al., 2020). Thereafter supernatants were immediately collected and stored at −25 °C until further analysis. Each sample was tested in duplicates.
2.6 Quantification of cytokines in plasma and cell supernatants
We determined plasmatic levels of IL-6 (InvitrogenTM Human IL-6 ELISA Ready-SET-Go!TM, ThermoFisher Scientific, San Diego, CA, USA), TNF-α (InvitrogenTM Human TNF-α ELISA Ready-SET-Go!TM, ThermoFisher Scientific, San Diego, CA, USA) and IFN-γ (InvitrogenTM Human IFN gamma Uncoated ELISA Kit, ThermoFisher Scientific, Vienna, Austria) in CRC patients and HD, with commercial sandwich ELISA kits according to producer’s guidelines. Optical density was spectrophotometrically estimated at wavelength of 450 nm, and concentrations were determined using a standard curve provided for each kit.
Diluted supernatants upon activation of primed T lymphocytes with CD28/CD3 Dynabeads, were additionally tested for their content of IL-6, TNF-α, and IFN-γ cytokines. All cytokines were measured in duplicates.
2.7 Data analysis and statistics
Statistical analyses were performed using Graphpad Prism (version 8.0.1) and IBM SPSS Statistics (version 21.0). Levels of sHLA-G, HLA-GEV, and cytokines are given as median and range. After testing for Gaussian distribution differences of HLA-G and cytokines expressions between patients and HD and their impacts on colorectal cancer clinicopathological features were assessed by the Mann Whitney test, Chi-square (X2) test or Spearman’s correlation. A p-value below 0.05 was considered as statistically significant. To evaluate whether the analyzed parameters are meaningful markers, to distinguish between patients and HD, the receiver operating characteristic (ROC) and the area under the curve (AUC) were examined by the NCSS statistical software (version 20.0.3).
3 Results
3.1 Baseline characteristics of CRC population
Clinical and demographic parameters of patients included in this research are shown in Table 1. Overall, the average age of patients at disease diagnosis was 60 years (Range: 29–85 years). Histologically, adenocarcinoma (94%) was the main identified subtype. 60% of patients were at T3 stage. The invasion of tumors into regional lymph nodes (N +) has occurred in 64% of cases. The majority of patients (n = 31) had no signs of extra-colorectal metastases. Among those diagnosed with distant dissemination, cancerous cells have predominantly spread towards hepatocellular tissues. According to TNM staging classification, we distinguished hence four stages distributed as following: stage I (6%), stage II (16%), stage III (40%), and stage IV (38%). More than two-thirds of patients had tumors strictly larger than 4 cm. We noted three grades of malignant cell differentiation: well- (66%), moderately (24%), and poorly (4%) differentiated. Data are illustrated in numbers (n) and percentages (%) median, and ranges. TNM: tumor-nodes-metastasis. UK: unknown.
Variables
Patients (N = 50)
Age at disease diagnosis (years)
Median
62.5
Range
29-85
Gender
Males
34 (68%)
Females
16 (32%)
Tumor location
Rectum
34 (68%)
Colon
16 (32%)
Histological type
Adenocarcinoma
47 (94%)
Others
3 (6%)
Differentiation degree status
Well + moderate
45 (90%)
Poor
2 (4%)
UK
3 (6%)
Tumor depth invasion (T) status 1
T1+T2
9 (18%)
T3+T4
40 (80%)
UK
1 (2%)
Tumor depth invasion (T) status 2
T1+T2+T3
39 (78%)
T4
10 (20%)
UK
1 (2%)
Regional Lymph Nodes (N)status
N0
15 (30%)
N+
32 (64%)
UK
3 (6%)
Metastasis (M)
M0
31 (62%)
M1
19 (38%)
TNM (1)
I+II
11 (22%)
III+IV
39 (78%)
TNM (2)
I+II+III
31 (62%)
IV
19 (38%)
Tumor size (cm)
>4
38 (76%)
≤4
11 (22%)
UK
1 (2%)
3.2 Increased levels of sHLA-G, HLA-GEV, and IL-6 in CRC patients
To investigate whether sHLA-G and HLA-GEV molecules are involved in CRC disease, we evaluated the concentration of these parameters in plasma samples from patients with CRC and from HD (Table 2). Overall, significant high levels of sHLA-G (Median [Range]: 8.8 [0–63] ng/ml vs. 2.1 [0–63] ng/ml; p < 0.0001) and HLA-GEV (0.9 [0–17.8] ng/ml vs. 0.3 [0–31.0] ng/ml; p = 0.018) were found in CRC patients compared with HD (Fig. 1a, b). Interestingly, HLA-G was undetectable in 43.9% of the EV fractions (43/98) derived from HD, whereas only 30% (15/50) of the EV fractions of CRC patients contained no HLA-G. sHLA-G: soluble HLA-G; EV: extracellular vesicles; IL: interleukin; TNF-α: tumor necrosis factor-alpha; IFN-γ: Interferon-gamma; N: number; IQR: interquartile range 25–75%; all P values are estimated using the Mann-Whitney test.
Parameters
N
Median(range)
IQR (25%–75%)
P-value (Mann-Whitney)
sHLA-G (ng/ml)
Patients
50
8.8 (0–63)
3.99–13.8
<0.0001
Controls
98
2.1 (0-63)
1.4–3.6
HLA-GEV(ng/ml)
Patients
50
0.9 (0–17.8)
0.0–3.0
0.018
Controls
98
0.3 (0–31)
0.0–1.5
IL-6 (pg/ml)
Patients
49
7.1 (0–104.0)
3.0–13.4
0.005
Controls
50
3.6 (0–58.22)
1.1–6.6
TNF-α (pg/ml)
Patients
49
1.8 (0–157.5)
0–19.2
0.359
Controls
95
7.8 (0–218.4)
0–24.2
IFN-γ (pg/ml)
Patients
50
0 (0–1.2)
–
0.264
Controls
98
0 (0–357.9)
–
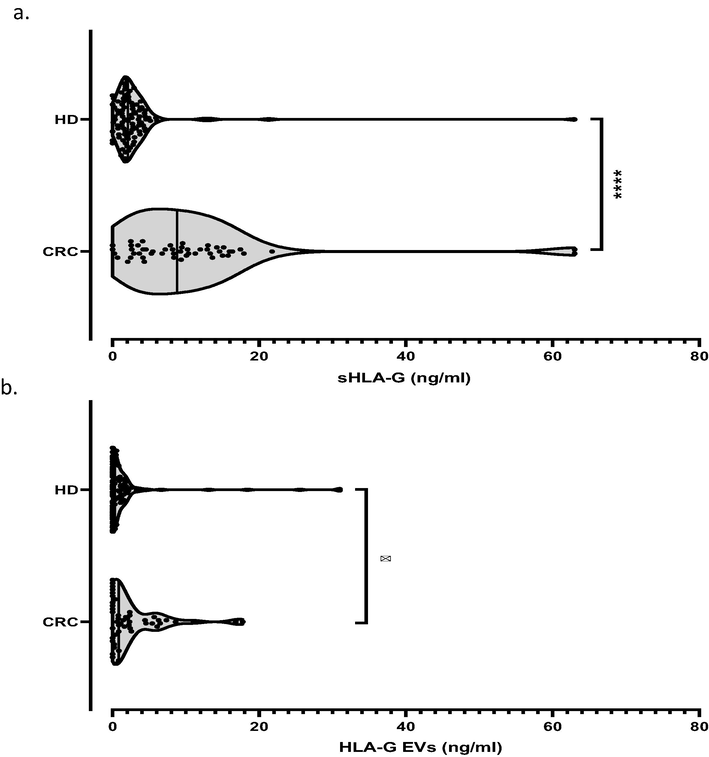
Comparison of sHLA-G and HLA-GEV concentrations between CRC patients and healthy donors (HD). Statistical differences of sHLA-G (a) and HLA-GEV (b) levels between patients and HD were evaluated by the Mann–Whitney U test. Concentrations are expressed in ng/ml. *, ****: P values ≤ 0.05 and ≤0.0001 respectively.
The IL-6 median level was nearly twofold enhanced in CRC patients compared to HD (Respectively: 7.1 [0–104] pg/ml vs. 3.6 [0–58.22] pg/ml, p = 0.005; Fig. 2a). However, no differences in IFN-γ and TNF-α levels were reported for CRC patients compared to HD (Fig. 2b, c).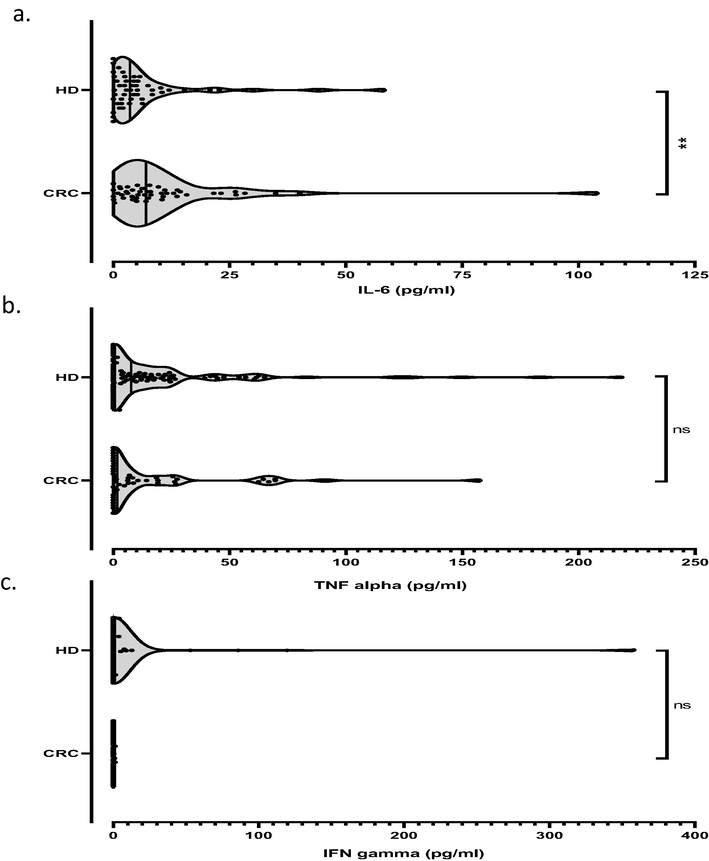
Comparison of IL-6, TNF alpha and IFN gamma concentrations between CRC patients and healthy donors (HD). The distribution of IL-6 (a), TNF alpha (b) and IFN gamma (c) levels between patients and HD were estimated by the Mann–Whitney U test. Cytokine amounts are expressed in pg/ml. **: P value ≤ 0.01. Ns: non significant.
3.3 Correlation of sHLA-G, HLA-GEV and cytokine levels
sHLA-G and HLA-GEV levels were positively correlated in CRC patients (r = 0.689, p < 0.0001). sHLA-G was inversely correlated with TNF-α levels (r = -0.446, p = 0.001). However, HLA-GEV was not correlated to TNF-α (r = −0.223, p = 0.123). Furthermore, IFN-γ and IL-6 levels were not correlated neither with sHLA-G nor HLA-GEV levels (p > 0.05).
3.4 Correlation of HLA-G with demographic and clinicopathological CRC patients’ features
To assess whether the differences in HLA-G production are related to demographic and CRC clinicopathological features, we stratified patients into subgroups according to age, gender, tumor size, location, TNM staging, histological type, and degree of differentiation (Table 3). In spite of insignificance, enhanced levels of sHLA-G and HLA-GEV were observed among T4 stage CRC patients. Even as no significant median differences was retrieved, levels of both, sHLA-G and HLA-GEV were enhanced in patients aged above 62 years. P values calculated using the Mann-Whitney test, P1: P-value of sHLA-G, P2: P-value of HLA-GEV; sHLA-G: soluble HLA-G; EV: extracellular vesicles; n: number; IQR: interquartile range 25–75%; Cm: centimeters. sHLA-G: soluble HLA-G; EV: extracellular vesicles; Cm: centimeters. Data are represented in numbers (n) and percentages (%). Numbers are estimated from median levels. P values are calculated via the X2test or the Fisher’s exact test when necessary.
Variables
N
sHLA-G (ng/ml) median (IQR)
P1-value
N
HLA-G EV (ng/ml) median (IQR)
P2-value
Age at disease diagnosis (median, years)
>62
25
9.550 (6.840–14.11)
0.111
25
1.810 (0.120–4.975)
0.171
≤62
25
5.310 (2.765–13.10)
25
0.780 (0–2.260)
Gender
Males
34
9.500 (4.505–13.97)
0.118
34
0.850 (0.180–4.453)
0.43
Females
16
6.175 (2.480–13.23)
16
0.615 (0–2.513)
Tumor location
Rectum
34
8.715 (3.608–13.77)
0.546
34
0.835 (0–2.363)
0.48
Colon
16
8.910 (4.115–15.14)
16
0.990 (0.240–5.618)
Histological type
Adenocarcinoma
47
9.240 (4.160–14.23)
0.264
47
0.840 (0.-4.420)
0.641
Others
3
2.620 (2.460–11.29)
3
2.310 (0.360–2.350)
Differentiation degree status
Well + moderate
45
8.370 (4.130–13.93)
0.666
45
0.840 (0–4.485)
0.647
Poor
2
7.100 (2.910–11.29)
2
1.605 (0.860–2.350)
Tumor invasion status (T)
T1+T2
9
8.340 (1.570–11.55)
0.247
9
0.330 (0–3.430)
0.357
T3+T4
40
9.345 (4.165–14.91)
40
0.950 (0–3.395)
T1+T2+T3
39
8.370 (4.16–13.62)
T4
10
11.63 (2.818–16.17)
0.578
39
0.840 (0–2.400)
0.336
10
1.605 (0.285–7.030)
Regional Lymph Nodes status (N)
N0
15
7.890 (4.180–13.01)
0.941
15
0.780 (0–2.340)
0.209
N+
32
9.300 (3.523–14.08)
32
1.535 (0–5.188)
Metastasis (M)
M0
31
9.360 (3.650–13.62)
0.886
31
0.800 (0–2.350)
0.412
M+
19
8.190 (4.100–14.60)
19
0.870 (0–5.690)
TNM Staging
I+II
11
10.08 (4.340–15.16)
0.484
11
0.780 (0–2.340)
0.427
III+IV
39
8.370 (3.480–13.62)
39
1.120 (0–4.550)
I+II+III
31
9.360 (3.650–13.62)
0.886
31
0.800 (0–2.350)
0.412
IV
19
8.190 (4.100–14.60)
19
0.870 (0–5.690)
Tumor size (cm)
>4
38
9.405 (4.145–14.43)
0.322
38
0.990 (0–4.453)
0.919
≤4
11
5.310 (2.620–10.35)
11
0.840 (0–0.2400)
Parameters
sHLA-G
HLA-GEV
Ratio sHLA-G/HLA-GEV
(ng/ml)
(ng/ml)
(ng/ml)
≤8.805
>8.805
P value
≤0.850
>0.850
P value
≤4.380
>4.380
P value
Total patients, n (%)
25 (50)
25 (50)
-
25 (50)
25 (50)
-
17 (49)
18 (51)
-
Age at disease diagnosis (median, years)
>62
9 (36)
16 (64)
0.047
10 (40)
15 (60)
0.157
9 (53)
10 (56)
0.876
≤62
16 (64)
9 (36)
15 (60)
10 (40)
8 (47)
8 (44)
Gender
Males
14 (56)
20 (80)
0.128
17 (68)
17 (68)
>0.999
12 (71)
14 (78)
0.711
Females
11 (44)
5 (20)
8 (32)
8 (32)
5 (29)
4 (22)
Tumor location
Rectum
17 (68)
17 (68)
>0.999
18 (72)
16 (64)
0.544
10 (59)
12 (67)
0.631
Colon
8 (32)
8 (32)
7 (28)
9 (36)
7 (41)
6 (33)
Histological type
Adenocarcinoma
23 (92)
24 (96)
>0.999
24 (96)
23 (92)
>0.999
16 (94)
16 (89)
>0.999
Others
2 (8)
1 (4)
1 (4)
2 (8)
1 (6)
2 (11)
Differentiation degree status
Well+ moderate
22 (96)
23 (96)
>0.999
23 (100)
22 (92)
0.489
15 (94)
15 (94)
>0.999
Poor
1 (4)
1 (4)
0 (0)
2 (8)
1 (6)
1 (6)
Tumor invasion status (T)
T1+T2
5 (21)
4 (16)
0.725
6 (25)
3 (12)
0.289
3 (18)
3 (17)
>0.999
T3+T4
19 (79)
21 (84)
18 (75)
22 (88)
14 (82)
15 (83)
T1+T2+T3
20 (83)
19 (76)
0.725
20 (83)
19 (76)
0.725
12 (71)
15 (83)
0.443
T4
4 (17)
6 (24)
4 (17)
6 (24)
5 (29)
3 (17)
Regional Lymph Nodes status (N)
N0
8 (35)
7 (29)
0.679
11 (48)
4 (17)
0.030
2 (13)
9 (50)
0.029
N+
15 (65)
17 (71)
12 (52)
20 (83)
14 (87)
9 (50)
Metastasis (M)
M0
14 (56)
17 (68)
0.382
17 (68)
14 (56)
0.382
8 (47)
13 (72)
0.175
M+
11 (44)
8 (32)
8 (32)
11 (44)
9 (53)
5 (28)
TNM staging
I+II
5 (20)
6 (24)
>0.999
8 (32)
3 (12)
0.170
2 (12)
7 (39)
0.121
III+IV
20 (80)
19 (76)
17 (68)
22 (88)
15 (88)
11 (61)
I+II+III
14 (56)
17 (68)
0.382
17 (68)
14 (56)
0.382
9 (53)
13 (72)
0.305
IV
11 (44)
8 (32)
8 (32)
11 (44)
8 (47)
5 (28)
Tumor size (cm)
>4
17 (71)
21 (84)
0.320
18 (75)
20 (80)
0.741
13 (76)
14 (78)
>0.999
≤4
7 (29)
4 (16)
6 (25)
5 (20)
4 (24)
4 (22)
To further study the effect of aging on HLA-G and cytokines levels, we divided our population into three groups: young (27–39 years), middle-aged (40–64 years) and elderly CRC patients (≥65 years) (Nematolahi and Ayatollahi, 2017) (Table 5). In comparison with HD, young, middle-aged, and elderly CRC patients significantly expressed high levels of sHLA-G (p < 0.05). Additionally, elderly CRC patients showed increased levels of HLA-GEV and decreased TNF-α levels compared to HD (Respectively: p = 0.012; p = 0.009, Table 5). Middle-aged patients showed higher IL-6 levels than HD (p = 0.036). No significant differences for IFN-γ were found between CRC patients and HD (Table 5). sHLA-G: soluble HLA-G; EV: extracellular vesicles; IL: interleukin; IFNγ: interferon-gamma; TNFα: tumor necrosis factor-alpha; n: number. P values calculated using the Mann-Whitney test.
Molecule (unit)
Young (<40 years)
Middle-aged (40–64 years)
Elderly (≥65 years)
Patients (N = 6) Median (range)
Controls (N = 11) Median (range)
P value
Patients (N = 24) Median (range)
Controls (N = 63) Median (range)
P value
Patients (N = 20)Median (range)
Controls (N = 24) Median (range)
P value
sHLA-G (ng/ml)
6.970 (2.46–15.01)
1.446 (0–12.29)
0.007
6.600 (0–63)
2.157 (0–63)
<0.0001
10.82 (0–21.76)
2.125 (0–4.38)
<0.0001
HLA-GEV(ng/ml)
1.910 (0–5.69)
0 (0–3.24)
0.112
0.700 (0–17.75)
0.465 (0–31.0)
0.593
1.920 (0–8.59)
0.075 (0–18.39)
0.012
IL-6 (pg/ml)
7.320 (2.79–13.70)
4.445 (0–44.12)
0.334
7.135 (0–40.08)
3.660 (0–58.22)
0.036
6.190 (0–104.0)
2.225 (0–30.0)
0.230
TNF-α (pg/ml)
15.82 (0–157.5)
0 (0–24.25)
0.086
6.350 (0–90.87)
9.328 (0–218.4)
0.962
0.140 (0–62.50)
13.61 (0–149.7)
0.009
IFN-γ (pg/ml)
0 (0–1.15)
0 (0–0)
0.352
0 (0–1.19)
0 (0–356.1)
0.083
0 (0–0.84)
0 (0–357.9)
0.681
While both female and male patients have expressed almost similar levels of HLA-GEV, we noticed increased levels of sHLA-G in the men group without reaching significance (9.5 [4.5–13.97] ng/ml vs. 6.2 [2.48–13.23] ng/ml, p = 0.118, Table 3). Levels of sHLA-G and of HLA-GEV were not correlated with any clinicopathological parameters (p values > 0.05, Mann Whitney U test, Table 3).
Using the median values of sHLA–G or HLA-GEV as cut-off for the stratification of patients into high and low producers, respectively, we demonstrated that HLA-GEV and sHLA-G/HLA-GEV ratios were significantly related to lymph nodes infiltration (Respectively, Chi square: p = 0.030, p = 0.029; Table 4).
3.5 Clinical implication of HLA-G and cytokines in CRC diagnosis
The efficiency of HLA-G and cytokines as potential markers in CRC diagnosis was defined by the ROC curve analysis (Fig. 3). sHLA-G showed a good performance in the distinction between CRC patients and HD (AUC = 0.828, 95% CI: 0.728–0.894, p < 0.0001). In fact, sHLA-G had 76% of sensitivity and 84.7% of specificity at the cut-off concentration of 4.10 ng/ml. Similarly, HLA-GEV indicated a good performance in the distinction between CRC patients and HD (AUC = 0.615, 95% CI: 0.510–0.702, p = 0.009).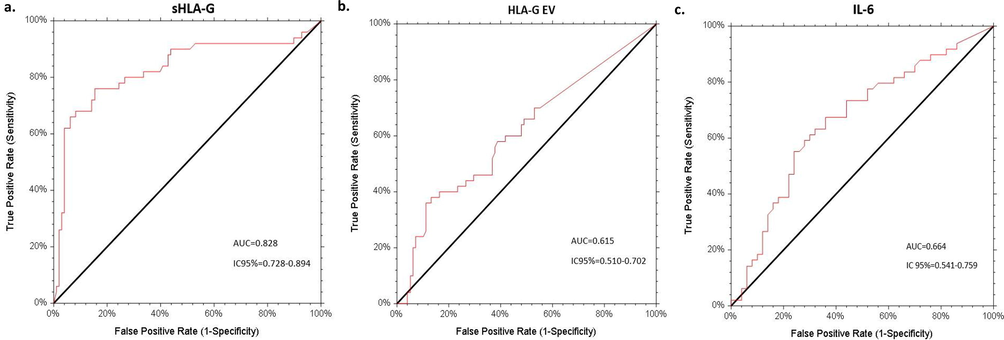
Receiver operating characteristic (ROC) analyses of sHLA-G, HLA-GEV and IL-6 levels to differentiate between patients and HD groups. The AUCs of sHLA-G, HLA-GEV and IL-6 were 0.828 (95% CI: 0.728–0.894) (a), 0.615 (95% CI: 0.510–0.702) (b) and 0.664 (95% CI: 0.541–0.759) (c) respectively. AUC = area under curve, CI = confidence interval.
Regarding cytokines, IL-6 displayed an AUC of 0.664 (95% CI: 0.541–0.759, p = 0.001). For a cut-off value of 6.46 pg/ml, IL-6 shows a sensitivity of 55% and a specificity of 76% for CRC detection. TNF-α and IFN-γ were no meaningful parameters in CRC discrimination.
3.6 sHLA-G reduces cytokines secreted by T lymphocytes in a concentration-independent manner
The potential involvement of sHLA-G in the proliferation of T lymphocytes and their cytokines production was then investigated. We used CRC plasma samples expressing different quantities of sHLA-G and HLA-GEV. Once stimulated with CD28/CD3 activator beads, we measured the levels of secreted IL-6, TNF-α, and IFN-γ cytokines by HLA-G-primed T lymphocytes using the ELISA sandwich technique. Although, we used different concentrations of sHLA-G and HLA-GEV to estimate their impacts on the ability of T lymphocytes to secrete cytokines, we found that sHLA-G decreased the expression of all measured pro-inflammatory cytokines in a dose-independent manner (p values < 0.05; Fig. 4a,b,c). However, HLA-GEV significantly reduced only the IL-6 production in an independent-dose manner (p = 0.0018; Fig. 4d), whereas no relevant effect of HLA-GEV priming was observed for TNF-α and IFN-γ (p > 0.05; Fig. 4e,f).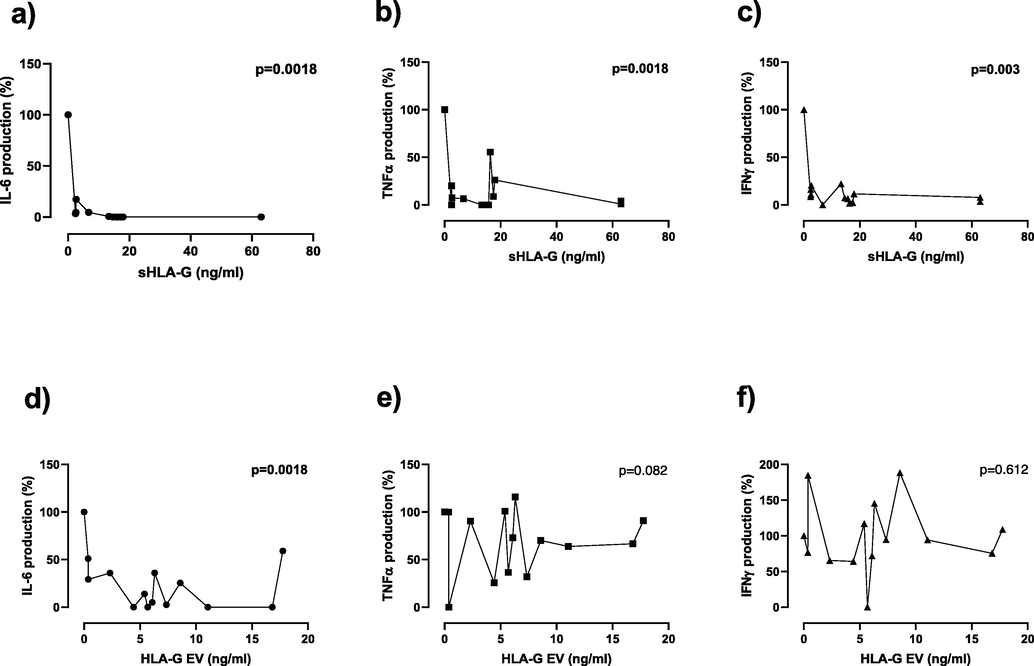
Cytokine production upon T-cell priming with different amounts of HLA-G. sHLA-G decreases, independently to its concentration, the production of IL-6, TNF-α, and IFN-γ by LT cells (4a-c). HLA-GEV reduced the expression of IL-6 in an independent-dose manner but exhibited no effect on TNF-α and IFN-γ released by T lymphocytes (4d-f). Positive control was used as a reference for comparison.
4 Discussion
Most tumors have developed fundamental strategies to escape immune surveillance. Indeed, the transition of anormal colonic mucosa into an oncogenic phenotype entail constitutive activation of NF-κB pathway, abolishment of anti-apoptotic proteins (Bcl-2) together with redox imbalance (Begum et al., 2021, Uddin et al., 2021). In addition, HLA-G and its soluble forms are considered to be potent biomarkers in several pathologies including colorectal cancer (Heidari et al., 2017, Li et al., 2017, Pan et al., 2016). To date, these molecules were the objects of multiple studies revealing that their expression could be reliable to discriminate between colorectal malignant transformations and benign or normal contexts (Zhu et al., 2011). In the present study, we demonstrate that CRC samples exhibited higher levels of sHLA-G than HD (p < 0.001) in accordance with previous publications (Farjadian et al., 2018, Lázaro-Sánchez et al., 2020, Li et al., 2017). Another article has announced that sHLA-G was highly expressed among CRC cases compared to normal subjects but only with borderline significance (p = 0.058) (Abu Hassan et al., 2019). Lázaro‑Sánchez and co-workers provided evidence of significant production of sHLA-G in stages III and IV colorectal cancer (Lázaro-Sánchez et al., 2020), whereas others claimed greater secretion of sHLA-G predominantly in earliest stages to boost the multiplication and survival of malignant cells (Farjadian et al., 2018). Our results revealed no correlation of sHLA-G levels with CRC stage, location, grade, lymph nodes infiltration, and metastasis likewise to the study of Zhu et al. (2011). Instead, we noticed a slight increased secretion of sHLA-G in T4 stage CRC without significance as previously observed among advanced primary tumors depth (Li et al., 2017). Other authors found that sHLA-G was correlated to some clinicopathological features proposing it as a prominent prognostic factor during CRC (Kirana et al., 2017, Lázaro-Sánchez et al., 2020, Li et al., 2017). The ethnicity and the reduced number of our population might explain this discrepancy with previous results.
Extracellular vesicles are secreted via normal and transformed cells (Rebmann et al, 2016). Following this finding, emerging details have pointed out EV as essential factors to monitor mutual exchanges between cells and their environment during biological processes and pathogenesis (Rebmann et al., 2016). Subsequently, EV became promising elements to control and treat diseases. The constitution of EV depends on their secretory cells, contexts of release, and functions (Rebmann et al., 2016). In this concept, a large spectrum of molecules such as HLA-G (Riteau et al., 2003), cytokines, micro-RNAs, and lipids (Rebmann et al., 2016) were found enclosed in EV. Recently, HLA-GEV were significantly associated with colorectal carcinogenesis, meanwhile correlated with tumor status, lymph node metastases as well as with TNM staging (Zhao et al., 2019). Here, we unveil that HLA-GEV was overproduced among CRC patients, yet we failed to establish any correlation between this mediator and the majority of clinicopathological features of the disease. However, enhanced amounts of HLA-GEV were reported among CRC patients with T4 primary tumors. Moreover, we found that 83% of patients with enhanced levels of HLA-GEV were diagnosed with positive lymph nodes (p = 0.030). The sHLA-G/HLA-GEV ratio was significantly related to lymph node infiltration (p = 0.029), which represents the most common metastatic route of colorectal cancer via the lymphatic system (Zhang et al., 2020). Therefore, these results suggest that HLA-GEV might exert an important role in tumor progression, although we did not find any other significant association with clinicopathological factors of tumor progression.
In the current paper, we concluded that both sHLA-G and HLA-GEV might provide a favorable microenvironment for CRC development but only HLA-GEV might have a significant effect on disease progression. This could be due to the HLA-G form that differently modulates immune functions as previously suggested (König et al., 2016; Rebmann et al., 2016).
IL-6 is a multifunctional pro-inflammatory cytokine synthesized by lymphocytes, endothelial cells, and macrophages (Wang and Sun, 2014). Recent studies have unveiled the implication of this cytokine in solid cancers especially in colorectal malignancy (Wang and Sun, 2014). Indeed, IL-6 triggers the Janus kinase signal transducer and activator of transcription 3 (JAK/STAT3) pathway which orchestrates an accordingly pro-oncogenic machinery to maintain tumor cell viability and proliferation (Wang and Sun, 2014). In our cohort, we presumed that the observed over-expression of IL-6 might be related to CRC (p = 0.005) as previously reported (Kaminska et al., 2005, Kantola et al., 2012, Kim et al., 2019, Shiga et al., 2016).
Over time, a growing debate has addressed the role of age in cancer leading to the assumption that CRC constitutes a common issue for both young and old individuals. At the outset, closer insights into CRC causalities showed that aging triggers the accumulation of aberrations in cell activities and thus CRC has to be considered as a typical disease for elders (Nangia-Makker et al., 2015). Despite and except for hereditary genetic disorders, lifestyle habits and dietary were found to further arise the frequencies of sporadic CRC in young people (Sung et al., 2021). Concerning our CRC population, no correlation between colorectal tumorigenesis and age was found as hitherto announced (Kim et al., 2019, Li et al., 2017). Conversely, age-stratified analyses demonstrated important changes in biomarkers expression between CRC patients and HD. Indeed, we registered the greatest quantities of sHLA-G in youngest, middle-aged, and eldest CRC groups. Significant enhanced amounts of HLA-GEV were measured only for elderly patients.
Based on ROC analysis, both, sHLA-G and HLA-GEV might constitute accurate diagnostic tools for colorectal cancer assessment in accordance with aforementioned studies (Cao et al., 2011, Zhu et al., 2011; Zhao et al., 2019). In our study, sHLA-G (AUC = 0.828) was found to dispose more relevant ability in the differentiation between CRC patients and HD than HLA-GEV (AUC = 0.615). Even though CEA (carcino embryonic antigen) and Ca19-9 (Carbohydrate antigen 19–9) are available blood markers for the detection of CRC (Cao et al., 2011, Groblewska et al., 2008), it has shown that sHLA-G is a more reliable indicator than CEA to detect CRC (Cao et al., 2011). Although, there was noticeable deviation of IL-6 AUC scores ranging from 0.561 to 0.896 (Kantola et al., 2012, Pengjun et al., 2013, Bünger et al., 2011, Groblewska et al., 2008), the expression of IL-6 was reported to be predictive for CRC. In a meta-analysis on IL-6 performance status in CRC (Xu et al., 2016), authors declared an AUC of 0.79 (95% CI: 0.75–0.82), leading to propose this molecule as a moderate biomarker for disease identification. Likewise, our statistics revealed an AUC = 0.664 for IL-6. Its higher efficiency to discern CRC population from both CEA and Ca19-9 strengthens the potent role of this cytokine in tumor prediction (Groblewska et al., 2008, Kaminska et al., 2005). Although some articles underlined TNF-α (AUC = 0.880) and IFN-γ (AUC = 0.621) to likely differentiate between CRC and HD specimens (Pengjun et al., 2013), Bunger et al. announced TNF-α (AUC = 0.592) and IFN-γ (AUC = 0.522) as poor predictors (Bünger et al., 2011). Here, we also found that the expression of these cytokines has no utility in CRC identification.
The polarization of T helper1/T helper2 balance towards a Th2 profile was reported as a fundamental mechanism to ensure colorectal tumorgenesis (Kantola et al., 2012). So far, notable evidence stated numerous cytokines to orchestrate HLA-G expression (Persson et al., 2020, Zidi et al., 2006). HLA-G immunosuppressive properties have raised numerous questions about its impact on T lymphocytes proliferation and cytokine secretion. In a prospective study with 122 patients suffering from pancreatic cancer, Xu et al. demonstrated a negative correlation between sHLA-G and T cell amounts, which led them to propose a central role of sHLA-G in monitoring lymphocytes T functions as a strategy to restrain immune defense (Xu et al., 2015). Besides, some evidence has shown that the modulation of Th1/Th2 balance depends on certain sHLA-G levels (Kapasi et al., 2000, Maejima et al., 1997). Due to this background, we targeted the potent contribution of HLA-G patterns in triggering T lymphocytes to produce cytokines. Indeed, sHLA-G reduced the production of IL-6, TNF-α, and IFN-γ by activated-T lymphocytes in a concentration-independent manner. Moreover, HLA-GEV appears to down-modulate the secretion of IL-6 by activated T lymphocytes in a dose-independent manner without such effect on TNF-α and IFN-γ synthesis. This is in alignment with a mild negative correlation found between sHLA-G and IL-6 levels in patients with neurological complications (Almeida et al., 2021). The observed IL-6 decrease by LT cells could be a regulation process to the restoration of the immune system function especially because IL-6 stimulation has been implicated in the restoration of STAT3 in tumor cells (JEG-3) (Liu et al., 2013), in the development of immune suppressive tolerogenic dendritic cells in vivo (Park et al., 2004b), and in the arrest of maturation/activation of ILT-4 dendritic cells (Liang et al., 2008). Elsewhere, Saurabh and colleagues underlined that HLA-G was antagonistically correlated to TNF-α and IFN-γ in tuberculosis specimens. They additionally proved that blocking HLA-G was sufficient to restore this cytokine production (Saurabh et al., 2018). Another research demonstrated that the injection of HLA-G in mice attenuates IL-6, TNF-α, and IFN-γ expressions (Agaugue et al., 2011). Concomitantly, researchers stated that the amelioration of tumor lesions was associated with Th1 cytokine type in vivo model. It would be crucial to elucidate veridical processes controlling this relation in future studies.
5 Conclusion
In summary, our research has highlighted the importance of both soluble HLA-G forms, sHLA-G and HLA-GEV as potential immune checkpoint molecules to modulate colorectal cancer initiation and progression in the Tunisian population. Based on its impressive performance in colorectal cancer assessment compared to other examined cytokines, sHLA-G might be considered as a more beneficial parameter. These findings strengthen therefore the utility of HLA-G as a diagnosis and a prognostic biomarker in CRC. The potential impact of HLA-G gene polymorphisms on the modulation of its expression should also be discussed in forthcoming studies in order to upgrade our knowledge on genetic-molecular mechanisms during colorectal carcinoma.
CRediT authorship contribution statement
Sabrine Dhouioui: Data curation, Formal analysis, Investigation, Writing original draft. Nadia Boujelbene: Validation, Review & Editing. Hanene Chelbi: Investigation, Validation. Ines Zemni: Validation. Ines Ben Safta: Validation. Hadda-Imene Ouzari: Validation, Review & Editing. Amel Mezlini: Validation. Abdel Halim Harrath: Validation, Writing-Review & Editing. Vera Rebmann: Methodology, Supervision, Validation, Writing – review & editing. Inès Zidi: Conceptualization, Methodology, Supervision, Validation, Writing – review & editing.
Acknowledgements
This research was supported by the Ministry of Higher Education and Scientific Research of Tunisia and by the Project 18PJEC07-12 at Higher Institute of Medical Technologies of Tunis, Tunisia. The authors extend their appreciation to the Researchers Supporting Project number (RSP-2021/17) at King Saud University, Riyadh, Saudi Arabia. Special thanks go to the patients and donors providing the blood samples for this study.
Declaration of Competing Interest
The authors declare that they have no known competing financial interests or personal relationships that could have appeared to influence the work reported in this paper.
References
- Relationship of HLA-G expression and its 14-bp insertion/deletion polymorphism with susceptibility to colorectal cancer. Genet. Mol. Res.. 2019;18:GMR18324.
- [Google Scholar]
- Role of HLA-G in tumor escape through expansion of myeloid-derived suppressor cells and cytokinic balance in favor of Th2 versus Th1/Th17. Blood. 2011;117:7021-7031.
- [Google Scholar]
- Cytokines and soluble HLA-G levels in the acute and recovery phases of arbovirus-infected brazilian patients exhibiting neurological complications. Front. Immunol.. 2021;12:582935.
- [Google Scholar]
- Global trends in colorectal cancer mortality: projections to the year 2035. Int. J. Cancer.. 2019;144:2992-3000.
- [Google Scholar]
- Gastrointestinal cancers in inflammatory bowel disease: an update with emphasis on imaging findings. Crit. Rev. Oncol. Hematol.. 2016;97:30-46.
- [Google Scholar]
- Antioxidant and signal-modulating effects of brown seaweed-derived compounds against oxidative stress-associated pathology. Oxid. Med. Cell. Longevity.. 2021;2021:9974890.
- [Google Scholar]
- Increased plasmatic soluble HLA-G levels in endometrial cancer. Mol. Immunol.. 2018;99:82-86.
- [Google Scholar]
- Toward standardized high-throughput serum diagnostics: multiplex-protein array identifies IL-8 and VEGF as serum markers for colon cancer. J. Biomol. Screen.. 2011;16:1018-1026.
- [Google Scholar]
- Plasma soluble HLA-G is a potential biomarker for diagnosis of colorectal, gastric, esophageal and lung cancer. Tissue Antigens. 2011;78:120-128.
- [Google Scholar]
- Interferon-gamma at the crossroads of tumor immune surveillance or evasion. Front. Immunol.. 2018;9:847.
- [Google Scholar]
- HLA-G mediated immune regulation is impaired by a single amino acid exchange in the alpha 2 domain. Hum. Immunol.. 2018;79:453-462.
- [Google Scholar]
- Prognostic significance of immune checkpoints HLA-G/ILT-2/4 and PD-L1 in colorectal cancer. Front. Immunol... 2021;12
- [Google Scholar]
- HLA-G expression in tumor tissues and soluble HLA-G plasma levels in patients with gastrointestinal cancer. Asian Pac. J. Cancer Prev.. 2018;19:2731-2735.
- [Google Scholar]
- Roles of the immune system in cancer: from tumor initiation to metastatic progression. Genes Dev.. 2018;32:1267-1284.
- [Google Scholar]
- Role of HLA-G and extracellular vesicles in renal cancer stem cell-induced inhibition of dendritic cell differentiation. BMC Cancer.. 2015;15:1009.
- [Google Scholar]
- Serum interleukin 6 (IL-6) and C-reactive protein (CRP) levels in colorectal adenoma and cancer patients. Clin. Chem. Lab. Med.. 2008;46:1423-1428.
- [Google Scholar]
- Evaluation of sHLA-G levels in serum of patients with prostate cancer identify as a potential of tumor marker. Anat. Cell Biol.. 2017;50:69-72.
- [Google Scholar]
- Clinical significance of serum cytokine measurements in untreated colorectal cancer patients: soluble tumor necrosis factor receptor type I–an independent prognostic factor. Tumour Biol.. 2005;26:186-194.
- [Google Scholar]
- Soluble HLA-G influences the release of cytokines from allogeneic peripheral blood mononuclear cells in culture. Mol. Hum. Reprod.. 2001;7:195-200.
- [Google Scholar]
- Stage-dependent alterations of the serum cytokine pattern in colorectal carcinoma. Br. J. Cancer.. 2012;107:1729-1736.
- [Google Scholar]
- HLA-G has a concentration-dependent effect on the generation of an allo-CTL response. Immunology. 2000;101:191-200.
- [Google Scholar]
- Circulating interleukin-6 level, dietary antioxidant capacity, and risk of colorectal cancer. Antioxidants (Basel). 2019;8:595.
- [Google Scholar]
- Soluble HLA-G is a differential prognostic marker in sequential colorectal cancer disease stages. Int. J. Cancer.. 2017;140:2577-2586.
- [Google Scholar]
- The prognostic impact of soluble and vesicular HLA-G and its relationship to circulating tumor cells in neoadjuvant treated breast cancer patients. Hum. Immunol.. 2016;77(9):791-799.
- [Google Scholar]
- HLA-G as a new tumor biomarker: detection of soluble isoforms of HLA-G in the serum and saliva of patients with colorectal cancer. Clin. Transl. Oncol.. 2020;22:1166-1171.
- [Google Scholar]
- No expression of human leukocyte antigen G (HLA-G) in colorectal cancer cells. J. Med. Assoc. Thai.. 2004;87:816-818.
- [Google Scholar]
- Immuno-tolerogenic functions of HLA-G: relevance in transplantation and oncology. Autoimmun. Rev.. 2005;4:503-509.
- [Google Scholar]
- Importance of the plasma soluble HLA-G levels for prognostic stratification with traditional prognosticators in colorectal cancer. Oncotarget. 2017;8:48854-48862.
- [Google Scholar]
- Modulation of dendritic cell differentiation by HLA-G and ILT4 requires the IL-6–STAT3 signaling pathway. PNAS. 2008;105:8357-8362.
- [Google Scholar]
- Aberrant human leucocyte antigen-G expression and its clinical relevance in hepatocellular carcinoma. J. Cell Mol. Med... 2010;14:2162-2171.
- [Google Scholar]
- HLA-G regulates the invasive properties of JEG-3 choriocarcinoma cells by controlling STAT3 activation. Placenta. 2013;34:1044-1052.
- [Google Scholar]
- Presence of HLA-G-expressing cells modulates the ability of peripheral blood mononuclear cells to release cytokines. Am. J. Reprod. Immunol... 1997;38:79-82.
- [Google Scholar]
- Human neuroblastoma cells trigger an immunosuppressive program in monocytes by stimulating soluble HLA-G release. Cancer Res.. 2007;67:6433-6441.
- [Google Scholar]
- IL-10 selectively induces HLA-G expression in human trophoblasts and monocytes. Int. Immunol.. 1999;11:803-811.
- [Google Scholar]
- Role of cancer stem cells in age-related rise in colorectal cancer. World J. Gastrointest. Pathophysiol.. 2015;6:86-89.
- [Google Scholar]
- A comparison of breast cancer survival among young, middle-aged, and elderly patients in southern Iran using Cox and empirical Bayesian additive hazard models. Epidemiol Health.. 2017;39:e2017043.
- [Google Scholar]
- Diagnostic significance of soluble human leukocyte antigen-G for gastric cancer. Hum. Immunol.. 2016;77:317-324.
- [Google Scholar]
- Soluble HLA-G generated by proteolytic shedding inhibits NK-mediated cell lysis. Biochem. Biophys. Res. Commun... 2004;313:606-611.
- [Google Scholar]
- IL-6 regulates in vivo dendritic cell differentiation through STAT3 activation. J. Immunol.. 2004;173:3844.
- [Google Scholar]
- Multiplexed cytokine profiling of serum for detection of colorectal cancer. Future Oncol.. 2013;9:1017-1027.
- [Google Scholar]
- Cytokine stimulation of the choriocarcinoma cell line JEG-3 leads to alterations in the HLA-G expression profile. Cell. Immunol.. 2020;352:104110
- [Google Scholar]
- HLA-G as a tolerogenic molecule in transplantation and pregnancy. J. Immunol. Res.. 2014;2014:297073
- [Google Scholar]
- The potential of HLA-G-bearing extracellular vesicles as a future element in HLA-G immune biology. Front. Immunol.. 2016;7:173.
- [Google Scholar]
- Report of the Wet Workshop for Quantification of Soluble HLA-G in Essen, 2004. Hum. Immunol.. 2005;66:853-863.
- [Google Scholar]
- Secretion of sHLA-G molecules in malignancies. Semin. Cancer Biol.. 2003;13:371-377.
- [Google Scholar]
- Exosomes bearing HLA-G are released by melanoma cells. Hum. Immunol.. 2003;64:1064-1072.
- [Google Scholar]
- HLA-G in cancer: a way to turn off the immune system. Semin. Cancer Biol.. 2003;13:325-336.
- [Google Scholar]
- Inhibiting HLA-G restores IFN-gamma and TNF-alpha producing T cell in pleural Tuberculosis. Tuberculosis (Edinb).. 2018;109:69-79.
- [Google Scholar]
- Soluble HLA-G and HLA-G bearing extracellular vesicles affect ILT-2 positive and ILT-2 negative CD8 T cells complementary. Front. Immunol.. 2020;11:2046.
- [Google Scholar]
- Vesicular-bound HLA-G as a predictive marker for disease progression in epithelial ovarian cancer. Cancers (Basel). 2019;11:1106.
- [Google Scholar]
- Expression of functional soluble human leucocyte antigen-G molecules in lymphoproliferative disorders. Br. J. Haematol.. 2007;138:202-212.
- [Google Scholar]
- Preoperative serum interleukin-6 Is a potential prognostic factor for colorectal cancer, including stage II patients. Gastroenterol Res Pract.. 2016;2016:9701574.
- [Google Scholar]
- Global cancer statistics 2020: GLOBOCAN estimates of incidence and mortality worldwide for 36 cancers in 185 countries. CA Cancer J. Clin.. 2021;71(3):209-249.
- [Google Scholar]
- From mice to humans: developments in cancer immunoediting. J Clin. Invest.. 2015;125:3338-3346.
- [Google Scholar]
- Natural small molecules targeting NF-κB signaling in glioblastoma. Front. Pharmacol.. 2021;12:703761.
- [Google Scholar]
- Soluble HLA-G promotes Th1-type cytokine production by cytokine-activated uterine and peripheral natural killer cells. Mol. Hum. Reprod.. 2007;13:123-133.
- [Google Scholar]
- The paradox of high availability and low recognition of soluble HLA-G by LILRB1 receptor in rheumatoid arthritis patients. PLoS One. 2015;10:e0123838.
- [Google Scholar]
- HLA-G expression in human embryonic stem cells and preimplantation embryos. J. Immunol.. 2011;186:2663-2671.
- [Google Scholar]
- Natural innate and adaptive immunity to cancer. Annu. Rev. Immunol.. 2011;29:235-271.
- [Google Scholar]
- The IL-6/JAK/STAT3 pathway: potential therapeutic strategies in treating colorectal cancer (Review) Int. J. Oncol.. 2014;44:1032-1040.
- [Google Scholar]
- Diagnostic and prognostic value of serum interleukin-6 in colorectal cancer. Medicine. 2016;95:e2502.
- [Google Scholar]
- High expression of human leukocyte antigen-G is associated with a poor prognosis in patients with PDAC. Curr. Mol. Med.. 2015;15:360-367.
- [Google Scholar]
- Zhang, C., Zhang, L., Xu, T., Xue, R., Yu, L., Zhu, Y., Wu, Y., Zhang, Q., Li, D., Shen, S., Tan, D., Bai, F., Zhang, H., 2020. Mapping the spreading routes of lymphatic metastases in human colorectal cancer. Nat. Commun.11, 1993.
- Expression and clinical significance of sHLA-G in plasma exosome in patients with colorectal cancer. Chinese J. Lab. Med.. 2019;12:347-353. https://pesquisa.bvsalud.org/portal/resource/pt/wpr-756434
- [Google Scholar]
- Serum sHLA-G levels: a useful indicator in distinguishing colorectal cancer from benign colorectal diseases. Int. J. Cancer.. 2011;128:617-622.
- [Google Scholar]
- Increase in HLA-G1 proteolytic shedding by tumor cells: a regulatory pathway controlled by NF-κB inducers. Cell. Mol. Life Sci. CMLS.. 2006;63:2669-2681.
- [Google Scholar]


