

Translate this page into:
Seasonal variations impact on SARS-CoV-2 incidence and mortality in southern and northern hemispheres: Two years pandemic period based study
⁎Corresponding author. smeo@ksu.edu.sa (Sultan Ayoub Meo)
-
Received: ,
Accepted: ,
This article was originally published by Elsevier and was migrated to Scientific Scholar after the change of Publisher.
Peer review under responsibility of King Saud University.
Abstract
Objectives
The Severe Acute Respiratory Syndrome Coronavirus (SARS-CoV-2) infection is a highly challenging problem in the world. The impact of weather conditions on the spread of SARS-CoV-2 has been hypothesized, but the level of understanding remains lacking. This study investigates the impact of seasonal variations on SARS-CoV-2 incidence and mortality in the Southern and Northern hemispheres.
Methods
We enlisted all the countries from both hemispheres and then randomly selected 20 countries, 10 countries from each hemisphere. After that, we recorded the SARS-CoV-2 daily cases and deaths in these selected countries from the Worldometer for the period of two years from December 31, 2019, to December 31, 2021.
Results
During the study period, in 10 selected countries of the Northern hemisphere, the number of SARS-CoV-2 cases was 18381.6 ± 419.7 and deaths 300.4 ± 6.4. However, the number of cases in the southern hemisphere is 6282.9 ± 205.8, and mortality was 210.0 ± 7.7. In the Northern hemisphere, the number of SARS-CoV-2 cases (p = 0.001) and deaths (p = 0.001) significantly increased compared to the southern hemisphere. The maximum number of cases and deaths occurred during the winter (18806.4 ± 785.3) and autumn (17034.1 ± 538.4) periods in both the hemisphere compared to spring and summer. Similarly, the number of deaths increased in winter (391.0 ± 13.4, p = 0.001) and autumn (308.6 ± 11.6) compared to spring and summer in both hemispheres.
Conclusions
The highest occurrence of SARS-CoV-2 cases and deaths was found during the winter and autumn seasons, while the lowest was found in the spring and summer during the study period of two years. The health officials inform the public about the seasonal occurrence of the SARS-CoV-2 outbreak and take priority preventive measures to minimize the disease burden.
Keywords
SARS-CoV-2
COVID-19
Coronavirus
Prevalence
Seasonal occurrence

1 Introduction
Earth is divided into two parts known as the northern and the southern hemisphere. The southern hemisphere contains parts of the five continents which are Antarctica. Africa, Australia, South America, and Asia. There are tremendous seasonal variations and temperature changes in both hemispheres. In the northern hemisphere, the “winter season runs from December to February; Spring from March to May; summer from June to August; and autumn from September to November.” However, in the southern hemisphere, the “winter season runs from June to August; spring from September to November; summer from December to February; and autumn from March to May” (Table 1). These seasonal variations profoundly impact the various physical, chemical and biological events. The seasonal climatic allied events are fundamental biological processes in the typical environment systems (Møller et al., 2008). The various seasonal events can affect the ecosystems through changes in the ecological relationships (Edwards and Richardson, 2004; Memmott et al., 2007; Encinas-Viso et al, 2012) and the pathogenesis of the diseases (Harvell et al., 2002; La et al., 2008). The seasonal climatic phenomena have profound consequences for human societies, economies (MacNeil et al., 2010) and human health (Ziello et al., 2012). The rapidly growing population and urbanization affect the planet's climate processes and physical-biological properties (Peñuelas et al., 2009). The swift changes in climate conditions influence the health and disease pattern. The literature acknowledges that SARS-CoV-2 cases and deaths are markedly changed during the various seasons (Meo et al., 2020 a). As per a World Health Organization report, on May 29, 2022, worldwide the total number of SARS-CoV-2 cases are 526,182 662 and deaths are 6,286,057 (World Health Organization (WHO) (2022)).
Seasonal months
Northern hemisphere
Southern hemisphere
December 1 to February 28
Winter
Summer
March 1 to May 31
Spring
Autumn
June 1 to August 31
Summer
Winter
September 1 to November 30
Autumn
Spring
The seasonal changes can affect the environment, human health, and the epidemiology of diseases (Meo et al., 2020 a). The regional differences in climate changes between the hemispheres are not uniform during the same period. The climatic and biological differences between the two hemispheres demonstrate a notable gap in the understanding of SARS-CoV-2 morbidity and mortality and its association with seasonal diversity in the two different hemispheres where climate conditions are changed. This study investigates the impact of seasonal variations on SARS-CoV-2 daily cases and deaths in various countries of both hemispheres.
2 Subjects and methods
2.1 Study design and settings
In this cross-sectional study, we selected a total of 20 countries, 10 countries from each hemisphere.
2.2 Seasonal variations in the hemispheres
There are significant seasonal variations and climate changes at the same time between the southern and northern hemispheres. In the northern hemisphere, the “winter season runs from December to February; Spring from March to May; Summer from June to August; and Autumn from September to November. In the southern hemisphere, the Winter season runs from June to August, Spring from September to November, Summer from December to February, and Autumn from March to May” (Table 1).
2.3 Selection of countries
Initially, we enlisted all the countries from both hemispheres and randomly selected 20 countries, 10 from the Southern and 10 from the Northern hemispheres. The countries chosen randomly from the Northern hemisphere are Canada, France, Germany, Italy, Spain, the United Kingdom, Russia, Turkey, Saudi Arabia, and the United States. The countries randomly selected from the Southern hemisphere are Australia, Argentina, Angola, Brazil, Bolivia, Botswana, Burundi, Chile, New Zealand, and Paraguay (Table 2). After that, we recorded the data on the occurrence and prevalence of SARS-CoV-2 daily cases and daily deaths in these selected countries from the Worldometer (Worldometer, 2022) during the study period from December 31, 2019, to December 31, 2021. The day-to-day data was recorded, entered into the computer, and carefully analyzed during the two-year study period. One author recorded and entered the data and another author recked the data.
Hemisphere
Countries
Cases Mean ± SEM
Cases per 100,000 Mean ± SEM
Death Mean ± SEM
Northern
Canada
3237.1 ± 148.2
8.47 ± 0.39
48.25 ± 1.88
France
15348.3 ± 859.3
23.4 ± 1.31
202.18 ± 8.78
Germany
11288.2 ± 553.4
13.4 ± 0.66
192.10 ± 9.96
Italy
9181.9 ± 454.0
15.2 ± 0.75
211.98 ± 9.15
Russia
16276.1 ± 390.3
11.1 ± 0.27
482.37 ± 13.45
Saudi Arabia
880.2 ± 38.1
2.47 ± 0.11
14.13 ± 0.48
Spain
9322.4 ± 448.0
19.9 ± 0.96
147.55 ± 7.34
Turkey
14468.1 ± 488.8
17.3 ± 0.58
125.95 ± 3.49
United Kingdom
19043.3 ± 854.6
278.4 ± 12.5
241.98 ± 13.08
United stated
83599.5 ± 2619.6
25.0 ± 0.78
1287.43 ± 34.93
Total
18381.6 ± 419.7
41.9 ± 1.63
300.41 ± 6.39
Southern
Angola
148.9 ± 10.1
0.48 ± 0.03
3.84 ± 0.16
Argentina
9547.2 ± 343.5
20.9 ± 0.75
208.71 ± 10.24
Australia
857.7 ± 64.4
3.31 ± 0.25
8.59 ± 0.33
Bolivia
958.1 ± 31.4
8.38 ± 0.27
32.62 ± 1.16
Botswana
1530.7 ± 151.8
67.9 ± 6.74
22.88 ± 2.58
Brazil
35052.3 ± 963.1
16.3 ± 0.45
983.58 ± 31.33
Burundi
110.2 ± 12.8
0.93 ± 0.11
8.75 ± 6.76
Chile
2768.5 ± 83.7
14.3 ± 0.43
66.70 ± 2.56
New Zealand
32.0 ± 2.4
0.66 ± 0.05
1.29 ± 0.11
Paraguay
784.9 ± 34.4
10.8 ± 0.47
32.40 ± 1.70
Total
6282.9 ± 205.8
11.1 ± 0.29
210.00 ± 7.70
Ethical statement
SARS-CoV-2 daily cases and deaths information was obtained from publicly available organizations; hence, ethical approval was not required.
2.4 Statistical analysis
The data were analyzed using “Statistical Package for the Social Sciences (SPSS) Inc Chicago, IL, USA, software version 21, and expressed in mean and SEM”. The simple and multivariate regression analysis was used to investigate the impact of seasonal variation in hemispheres on SARS-CoV-2 cases and deaths. The correlation was achieved to identify the strength and link between the variables. p-value < 0.05 was considered significant.
3 Results
In the present cross-sectional study, we initially enlisted all the countries from both hemispheres and then randomly selected a total of 20 countries, 10 from the Southern and 10 from the Northern Hemisphere. After that, we recorded the SARS-CoV-2 daily cases and daily deaths in these selected countries from the Worldometer website from December 31, 2019, to December 31, 2021 (Table 2). During the study period, in 10 Northern hemisphere countries, the number of SARS-CoV-2 cases was 18381.6 ± 419.7 and deaths 300.4 ± 6.4. However, the number of cases in the southern hemisphere is 6282.9 ± 205.8, and mortality was 210.0 ± 7.7 (Table 3). Moreover, in the Northern hemisphere, SARS-CoV-2 per 100,000 population was 41.9 ± 1.4. However, in the southern hemisphere, the number of cases per 100,000 population was 11.1 ± 0.29. In Northern hemisphere the number of SARS-CoV-2 cases (p = 0.001), deaths (p = 0.001), and cases per 100,000 population (p = 0.001) were significantly increased compared to southern hemisphere (Table 3).
Hemisphere
Cases Mean ± SEM
Cases per 100,000 Mean ± SEM
Death Mean ± SEM
Northern
18381.6 ± 419.7
41.9 ± 1.6
300.4 ± 6.4
Southern
6282.9 ± 205.8
11.1 ± 0.29
210.0 ± 7.7
p-value
< 0.001*
< 0.001*
< 0.001*
In both the Northern and Southern hemispheres, the peak of the SARS-CoV-2 cases (18806.4 ± 785.3), deaths (391.0 ± 13.4), and cases per 100,000 population (43.0 ± 2.98) occurred during the winter season (Table 4). Moreover, during the Autumn season, the cases (17034.1 ± 538.4), deaths (308.6 ± 11.6), and cases per 100,000 population (39.7 ± 1.97) occurred during the Autumn season (Table 4). However, in spring, the SARS-CoV-2 cases (7456.7 ± 221.6), deaths (212.7 ± 6.5), and cases per 100,000 population (11.5 ± 0.30) and during Summer, the SARS-CoV-2 cases (9882.8 ± 394.9, deaths (158.1 ± 6.3), and cases per 100,000 population (22.0 ± 1.42) occurred during the summer season (Table 4). The results further revealed that in both Northern and Southern hemispheres, the maximum number of SARS-CoV-2 cases, deaths, and cases per 100,000 population were significantly higher (p = 0.001) during the winter and Autumn seasons compared to the summer and spring seasons (Table 4). More details of the data of both hemispheres during the various seasons are demonstrated in Table 5 (Figs. 1-3).
Season
Cases Mean ± SEM
Cases per 100,000 Mean ± SEM
Death Mean ± SEM
Winter
18806.4 ± 785.3
43.0 ± 2.98
391.0 ± 13.4
Autumn
17034.1 ± 538.4
39.7 ± 1.97
308.6 ± 11.6
Summer
9882.8 ± 394.9
22.0 ± 1.42
158.1 ± 6.3
Spring
7456.7 ± 221.6
11.5 ± 0.30
212.7 ± 6.5
p-value
< 0.001*
< 0.001*
< 0.001*
Season
Cases Mean ± SEM
Cases per 100,000 Mean ± SEM
Death Mean ± SEM
Northern Hemisphere
Autumn
21375.1 ± 741.6
53.30 ± 3.01
277.6 ± 10.7
Spring
10991.7 ± 366.0
15.75 ± 0.45
299.6 ± 10.2
Summer
11576.6 ± 537.8
27.33 ± 2.11
156.3 ± 7.2
Winter
34606.3 ± 1637.4
83.46 ± 6.67
542.8 ± 22.8
p-value
< 0.001*
< 0.001*
< 0.001*
Southern Hemisphere
Autumn
9217.7 ± 629.3
15.17 ± 0.56
382.8 ± 29.6
Spring
3664.7 ± 196.6
6.99 ± 0.35
100.4 ± 5.5
Summer
6556.6 ± 485.9
11.67 ± 0.62
162.6 ± 12.7
Winter
6817.4 ± 384.0
12.29 ± 0.70
243.3 ± 12.9
p-value
< 0.001*
< 0.001*
< 0.001*
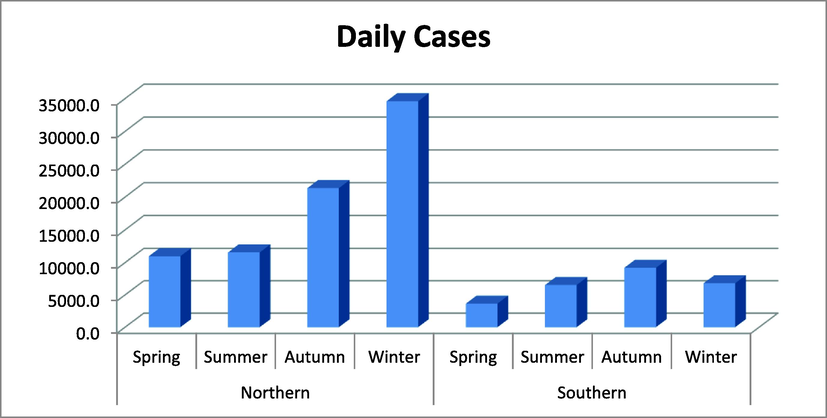
Effect of seasonal variations on SARS-CoV-2 daily cases in northern and southern hemisphere countries.
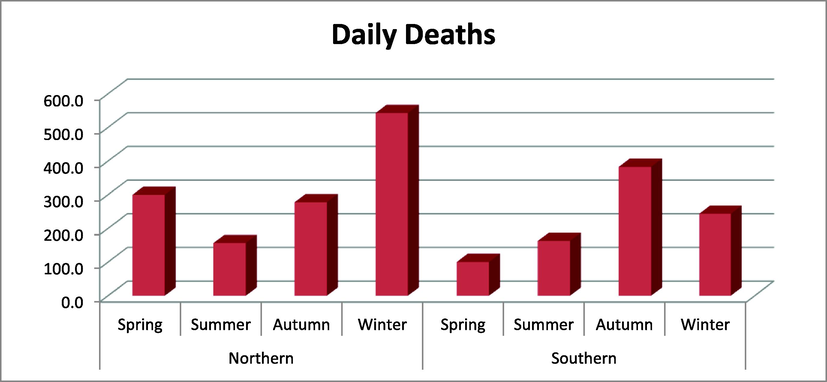
Effect of seasonal variations on the SARS-CoV-2 daily deaths in northern and southern hemisphere countries.
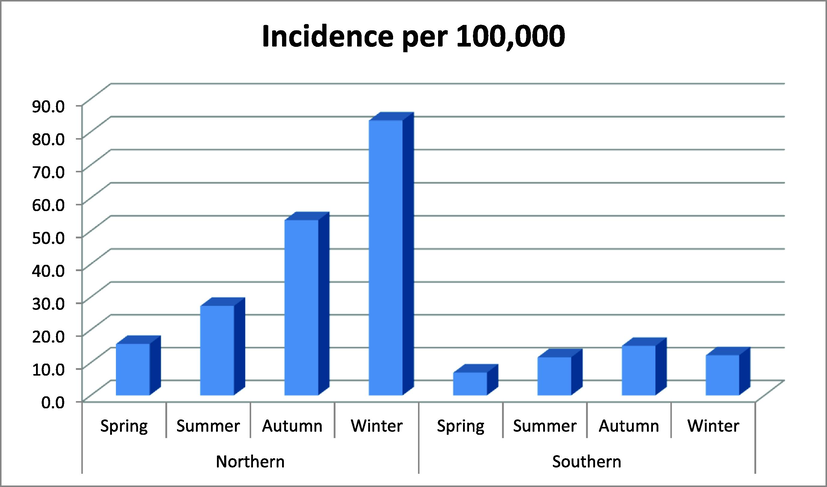
Effect of seasonal variation on the SARS-CoV-2 incidence per 100,000 population in northern and southern hemisphere countries.
Initially, simple regression and multivariate regression analysis were used to determine the effect of season on COVID cases in hemispheres. The results revealed that daily cases were significantly higher in Northern Hemisphere countries than in southern hemisphere countries. Similarly, there was a strong association between seasons and daily cases. In the winter season, the number of daily cases was significantly higher than in the autumn season. However, in the spring and summer seasons, there was a significant reduction in daily cases compared to the winter and autumn season. In multivariate regression analysis, a similar finding was observed (Table 6).
Variables
Category
Simple Regression
Multivariate Regression
Β
p-value
95 % CI Lower Upper
Β
p-value
95 % CI Lower Upper
Hemisphere
Northern
12098.6
0.000*
11100.5
13096.8
12982.2
0.000*
11984.9
13979.4
Seasons
Southern
Reference
Spring
−7806.3
0.000*
−8928.7
−6683.9
−7949.5
0.000*
−9299.5
−6599.5
Summer
−4202.5
0.000*
−5392.2
−3012.8
−7406.4
0.000*
−8804.4
−6008.5
Winter
7501.8
0.000*
6317.7
8685.8
4518.1
0.000*
3104.6
5931.6
Autumn
Reference
Similarly, simple regression analysis determined the seasonal effect on SARS-CoV-2 deaths in the hemispheres. The results revealed that daily deaths were significantly higher in Northern Hemisphere countries than in southern hemisphere countries. Correspondingly, there was a strong association between seasons and daily deaths. In the winter season, the number of daily deaths was significantly higher than in the autumn season; however, in the spring and winter seasons, there was a significant reduction in daily deaths compared to the autumn season. In multivariate regression analysis, a similar finding was observed (Table 7).
Variables
Category
Simple Regression
Multivariate Regression
Β
p-value
95 % CI Lower Upper
β
p-value
95 % CI Lower Upper
Hemisphere
Northern
90.4
0.000*
70.6
110.3
113.4
0.000*
93.2
132.9
Seasons
Southern
Reference
Spring
−74.2
0.000*
−95.6
−52.8
−80.0
0.000*
−106.2
−53.9
Summer
−140.3
0.000*
−163.1
−117.5
−151.8
0.000*
−179.2
−124.5
Winter
163.6
0.000*
140.9
186.2
106.3
0.000*
78.7
133.9
Autumn
Reference
4 Discussion
The “Severe Acute Respiratory Syndrome Coronavirus-2 (SARS-CoV-2) disease, commonly known as the COVID-19 pandemic”, swiftly spread worldwide and caused global health and economic concerns (Meo et al. (2021)). The high spread of SARS-CoV-2 in winter weather was hypothesized, but the understanding of evidence remains lacking at both hemisphere levels. This study identified the seasonal occurrence of SARS-CoV-2 outbreaks in various Southern and Northern hemispheres states. The highest occurrence of SARS-CoV-2 outbreaks of cases and deaths was found during the winter and autumn season, while the lowest was found in the Spring and summer period from December 31, 2019, to December 31, 2021. The relationship between SARS-CoV-2 infections has been identified with seasonal variations. The seasonal variation events affect the biological ecosystem through environmental interactions and change the epidemiology of infectious diseases. Global climate change and urbanization modulate host susceptibility and pathogen virulence (Chambers et al., 2013; Proesmans et al., 2021).
The literature demonstrates the more spread of SARS-CoV-2 in weather conditions. The Northern hemisphere countries experienced a wave of SARS-CoV-2 infections during the autumnal transition from summer to winter seasons (Landier et al., 2021). Neumann and Kawaoka (2022) (17) reported that the most common respiratory viruses spread more during the cold season. The outbreaks of human influenza and coronaviruses occur during the winter season, whereas low activity is detected during the summer months. The winter weather conditions can affect the susceptibility to infection. It can also influence the behaviour of individuals prone to transmission, virus persistence, and vulnerability.
The literature investigates the solidity and transmissibility of respiratory viruses under various weather conditions. The viruses that can cause seasonal incidences during the winter are more stable and transmissible in animals at low temperatures than at the higher temperature found during the summer season (Ma et al., 2021). (Lagacé-Wiens et al., 2021) reported that SARS-CoV-2 has a linkage with a zoonotic source to humans and developed a seasonal pattern. Another study in Canada highlights that coronaviruses and other respiratory viruses cause annual seasonal outbreaks, mainly in the winter (Lagacé-Wiens et al., 2021). (Liu et al., 2021) investigated the relationship of seasonality in the COVID-19 spread and found that COVID-19 infectivity and mortality were more robust in colder climates. In another study, (Merow and Urban, 2020) established a seasonal linkage with COVID-19 growth rates. The authors found that COVID-19 decreased temporarily during the summer, and peaked in the winter season.
Meo and colleagues 2021a performed a study and found a significant decline in SARS-CoV-2 daily cases and deaths in states with warm weather than in countries with cold climates. This is well-established that cold weather conditions can drive respiratory diseases with viral transmission. The cold weather weakens the human immune system and increases viral molecular stability (Maciorowski et al., 2021). These reasons support the hypothesis that cold weather conditions increase the SARS-CoV-2 cases and deaths.
4.1 Study strengths and limitations
The main strengths of this study are: This is the first study to investigate the impact of the seasonal variation on the occurrence of SARS-CoV-2 daily cases and deaths in various states of the Southern and Northern hemispheres. Second: the data was collected for 20 countries for two years. The large sample size from multiple countries and long-term duration enhance the validity and reliability of the study. Third, the seasonal variation in the Southern and Northern hemispheres is very different, and study findings proved the seasonal linkage with the COVID-19 pandemic in both hemispheres. While this is a comprehensive study, it has some limitations. We did not consider differences in COVID-19 testing systems that may vary from country to country in both hemispheres. However, given the uniformity and consistency in the findings, this limitation is unlikely to affect the interpretation of the findings.
5 Conclusions
The study findings have established a seasonal epidemic pattern of SARS-CoV-2 cases and deaths in the human population both in the Northern and Southern hemispheres. The high occurrence of SARS-CoV-2 outbreak cases and deaths was found during the winter and autumn season, while the lowest was found in the Spring and Summer during the two years from December 31, 2019, to December 31, 2021. The study findings highlight the need to consider seasonal factors when formulating non-pharmaceutical intervention strategies. Healthcare officials need to highlight the seasonal outbreaks of SARS-CoV-2 during winter seasons to take better preventive measures and minimize the disease burden globally. This approach will also help assess the possible seasonal course of COVID-19 in the future. While scheduling public health strategies, it is important to understand the seasonal impact on SARS-CoV-2 infections.
CRediT authorship contribution statement
Sultan Ayoub Meo: Conceptualization, Supervision. Abdulaziz Hassan Alsomali: . Abdullah Abdulrahman Almushawah: . Dost Muhammad Halepoto: .
Acknowledgements
We thank the “Researchers supporting project number (RSP-2021/47), King Saud University, Riyadh, Saudi Arabia”.
Funding
King Saud University, Riyadh, Saudi Arabia (RSP-2021/47).
Declaration of Competing Interest
The authors declare that they have no known competing financial interests or personal relationships that could have appeared to influence the work reported in this paper.
References
- Impact of climate change on marine pelagic phenology and trophic mismatch. Nature. 2004;430:881-884.
- [Google Scholar]
- Phenology drives mutualistic network structure and diversity. Ecology Letters. 2012;15:198-208.
- [Google Scholar]
- Climate warming and disease risks for terrestrial and marine biota. Science. 2002;296:2158-2162.
- [Google Scholar]
- Climate change: effects on animal disease systems and implications for surveillance and control. Revue Scientifique et Technique-Office International des Epizooties. 2008;27:339-354.
- [Google Scholar]
- Seasonality of coronaviruses and other respiratory viruses in Canada: Implications for COVID-19. Can Commun Dis Rep.. 2021;47(3):132-138.
- [CrossRef] [Google Scholar]
- Cold, and dry winter conditions are associated with greater SARS-CoV-2 transmission at the regional level in western countries during the first epidemic wave. Sci Rep. 2021;11:12756.
- [CrossRef] [Google Scholar]
- The role of seasonality in the spread of the COVID-19 pandemic. Environ Res.. 2021;195:110874
- [CrossRef] [Google Scholar]
- The clinical characteristics of pediatric inpatients with SARS-CoV-2 infection: A meta-analysis and systematic review. J Med Virol. 2021;93(1):234-240.
- [Google Scholar]
- Environmental factors and their role in the transmission of SARS-CoV-2. Biosaf Health.. 2021;3(5):235-237.
- [Google Scholar]
- Transitional states in marine fisheries: adapting to predicted global change. Philosophical Transactions of the Royal Society of London B Biological Sciences. 2010;365:3753-3763.
- [Google Scholar]
- Global warming and the disruption of plant-pollinator interactions. Ecology Letters.. 2007;10(8):710-717.
- [Google Scholar]
- Climate and COVID-19 pandemic: effect of heat and humidity on the incidence and mortality in world's top ten hottest and top ten coldest countries. Eur Rev Med Pharmacol Sci.. 2020;24(15):8232-8238.
- [CrossRef] [Google Scholar]
- COVID-19 vaccines: comparison of biological, pharmacological characteristics and adverse effects of Pfizer/BioNTech and Moderna Vaccines. Eur Rev Med Pharmacol Sci.. 2021;25(3):1663-1669.
- [CrossRef] [Google Scholar]
- Seasonality and uncertainty in global COVID-19 growth rates. Proc Natl Acad Sci USA. 2020;117(44):27456-27464.
- [CrossRef] [Google Scholar]
- Populations of migratory bird species that did not show a phenological response to climate change are declining. Proceedings of the National Academy of Sciences of the United States of America.. 2008;105(42):16195-16200.
- [Google Scholar]
- Seasonality of influenza and other respiratory viruses. EMBO Mol Med.. 2022;e15352
- [CrossRef] [Google Scholar]
- Pathways for Novel Epidemiology: Plant-Pollinator-Pathogen Networks and Global Change. Trends Ecol Evol.. 2021;36(7):623-636.
- [CrossRef] [Google Scholar]
- World Health Organization (WHO). Coronavirus disease (COVID-19) pandemic. Available at: https://www.who.int/emergencies/diseases/novel-coronavirus-2019. Cited date May 29, 2022. 12. Worldometer, Coronavirus Cases: Available at: https://www.worldometers.info/coronavirus. Cited date Jan 5, 2022.
- First flowering of wind-pollinated species with the greatest phenological advances in Europe. Ecography.. 2012;35(11):1017-1023.
- [Google Scholar]
Appendix A
Supplementary data
Supplementary data to this article can be found online at https://doi.org/10.1016/j.jksus.2022.102335.
Appendix A
Supplementary data
The following are the Supplementary data to this article:


