

Translate this page into:
Role of TRAF1 gene polymorphisms in susceptibility to Acute Lymphoblastic Leukemia in Saudi patients
⁎Corresponding author. fadwaalkhulaifi@gmail.com (Fadwa M. Alkhulaifi),
-
Received: ,
Accepted: ,
This article was originally published by Elsevier and was migrated to Scientific Scholar after the change of Publisher.
Abstract
Acute Lymphoblastic Leukemia (ALL) is a genetic malignancy characterized by the uncontrolled proliferation of hematopoietic precursor cells and evasion of immune surveillance. This study investigates the association between TRAF1 gene polymorphisms and the risk of developing ALL. Understanding the role of single nucleotide polymorphisms (SNPs) in the TRAF1 gene, which has been previously implicated in various immune-related disorders, may provide valuable insights into the molecular mechanisms of ALL and help identify potential therapeutic targets. A total of 265 subjects were recruited for this study, comprising 150 ALL patients and 115 healthy controls. Genotyping was performed using TaqMan PCR, focusing on four TRAF1 SNPs: rs2239657G/A, rs2416804G/C, rs7021049G/T, and rs3761847G/A. The minor allele frequencies and genotype distributions were compared between groups, with relative risks and statistical differences evaluated. Additionally, TRAF1 mRNA expression levels were assessed in both ALL patients and healthy individuals using qRT-PCR. The results demonstrated a significant association between the TRAF1 rs2239657G/A polymorphism and an increased risk of ALL, while the rs2416804G/C polymorphism was associated with a significantly reduced risk. Notably, TRAF1 was overexpressed in ALL patients, indicating its potential role in the pathogenesis of ALL. This overexpression suggests that TRAF1 may contribute to the interaction between inflammation and oncogenesis, providing new insights into the disease’s progression and highlighting TRAF1 as a possible biomarker for therapeutic intervention.
Keywords
Acute Lymphoblastic Leukemia
Single nucleotide polymorphisms
TRAF1
Gene expression

- ALL
-
Acute Lymphoblastic Leukemia
- SNP
-
Single Nucleotide Polymorphism
- TRAF1
-
Tumor Necrosis Factor Receptor-Associated Factor 1
- qRT-PCR
-
Quantitative Reverse Transcription Polymerase Chain Reaction
- EDTA
-
Ethylenediaminetetraacetic Acid
- DNA
-
Deoxyribonucleic Acid
- RNA
-
Ribonucleic Acid
- GAPDH
-
Glyceraldehyde-3-Phosphate Dehydrogenase
- NF-κB
-
Nuclear Factor Kappa B
- PCR
-
Polymerase Chain Reaction
- MAF
-
Minor Allele Frequency
- HWE
-
Hardy-Weinberg Equilibrium
- OR
-
Odds Ratio
- CI
-
Confidence Interval
Abbreviations
1 Introduction
Cancer arises from the dysregulated proliferation of aberrant cells accompanied by genomic modifications that confer oncogenic traits to otherwise healthy cells (Biswas et al., 2024). Leukemia, a type of blood cancer originating from hematopoietic cells, exemplifies this process as a multifaceted disease driven by diverse genetic mutations and hematologic abnormalities. Among its subtypes, Acute Lymphoblastic Leukemia (ALL) is characterized by the clonal expansion of leukemic cells within the bone marrow, often leading to an increased presence of affected lineage cells in the peripheral blood (Tebbi, 2021). This aggressive malignancy predominantly affects children and remains a significant contributor to cancer-related morbidity and mortality worldwide.
Leukemia ranks among the most common cancers in Saudi Arabia (Jastaniah et al., 2020). The Saudi Cancer Registry's 2013 report indicated that childhood cancers represented 6 % of all cancer cases, with ALL accounting for 31 %—the highest incidence among all cancer types (Ahmed et al., 2019). Over the past 15 years, leukemia incidence has risen, particularly among males, with the central region of the country reporting the highest rates. Furthermore, the 2015 report from the Saudi National Cancer Registry revealed that leukemia made up 4.5 % of all female cancers and 7.5 % of male cancers in the Kingdom of Saudi Arabia (Bawazir et al., 2019). These figures highlight the urgent need for focused research and advancements in therapeutic strategies.
The tumor necrosis factor receptor (TNF-R)-associated factor (TRAF) family comprises intracellular proteins that serve as cytoplasmic signaling adaptor molecules. The TNF-R family includes 25 receptors that regulate various functions, including innate and adaptive immunity, tissue homeostasis, embryonic development, stress response, and apoptosis (Gissler et al., 2022). Most TNF-Rs require specific adaptor proteins such as Tumor Necrosis Factor Receptor Type 1-associated Death Domain (TRADD), Receptor-Interacting Protein (RIP), Fas-Associated Death Domain (FADD), and TRAFs to facilitate these processes.
The TRAF (TNF Receptor Associated Factor) protein family, comprising six members (TRAF1 to TRAF6), plays a crucial role in signal transduction from a variety of receptors (Xie, 2013). These proteins function as regulatory scaffolds, interacting with the cytoplasmic domains of different TNF-R (Tumor Necrosis Factor Receptor) superfamily members upon their activation. TRAFs act as docking platforms, facilitating interactions with diverse receptors, including kinases, ubiquitin ligases, ubiquitin proteases, and other effector proteins (Perez-Chacon et al., 2019). They operate independently or synergistically with other adaptor proteins to serve as signal transducers for a wide array of receptors, especially those involved in innate and adaptive immune responses, as well as cytokine signaling (Lalani et al., 2019).
TRAFs are integral to various physiological processes, including innate and adaptive immunity, inflammation, cellular proliferation and differentiation, embryonic development, cellular homeostasis, apoptosis, cytokine production, autophagy, lymphoid organ development, brain development, osteoclastogenesis, stress responses, and programmed cell death (Park, 2018). Specifically, Tumor Necrosis Factor Receptor-Associated Factor 1 (TRAF1), a cytoplasmic adaptor protein, is essential in the immune system as a crucial intracellular signaling molecule. TRAF1 expression is minimal in resting lymphocytes and monocytes but significantly increases upon activation via the NF-κB pathway (Edilova et al., 2018). Genetic alterations in TRAF1 occur in less than 4 % of human cancers (Zhu et al., 2018). TRAF1 overexpression is well-documented in various lymphoid malignancies, particularly in numerous human B-cell malignancies such as B-cell chronic lymphocytic leukemia (B-CLL), Burkitt’s lymphoma, large B-cell lymphoma (Zapata et al., 2012) and non-Hodgkin lymphomas (Dürkop et al., 1999). Polymorphic variations in TRAF1 genes are implicated in the tumorigenesis of non-Hodgkin lymphomas and are associated with various diseases, including rheumatoid arthritis, systemic lupus erythematosus, and atherosclerosis (Cerhan et al., 2007; Xu et al., 2013; Lalani et al., 2019). In conclusion, this case-control study aims to identify potential susceptibility genes, supporting a polygenic model based on genetic variation and gene expression. By examining TRAF1 polymorphisms, we aim to address existing research gaps and offer valuable insights into the genetic factors contributing to leukemia, specifically ALL, within the Saudi population. These findings may have clinical significance, potentially serving as indicators of tumor aggressiveness and as prognostic markers in leukemia and other cancers.
2 Materials and methods
2.1 Criteria for sample selection
Human whole blood samples were collected from a total of 265 individuals for this study. The cohort comprised 150 patients (60 females and 90 males) diagnosed with Acute Lymphoblastic Leukemia (ALL), who had no other known pathologies, hematological disorders, or prior history of cancer, and 115 unrelated healthy individuals of both genders without any clinical signs of cancer or other diseases, serving as controls. Gender- and age-matched cases and controls were carefully selected to ensure comparability. The characteristics of ALL patients and control subjects are detailed in Table 1.
Patient
Control
Number of subjects
mean ± St.Dev
Number of subjects
Mean ± St.Dev
P-value
150
22.45 ± 20.27
115
18.68 ± 15.53
P = 0.10
2.2 Ethics approval
The study was approved by the medical ethics committee in King Khalid University Hospital and the ethics committee of King Saud University, Riyadh, Saudi Arabia (Ref. No. 20/0525/IRB).
2.3 Blood sample collection
Blood samples were obtained from all subjects via venipuncture, using ethylenediaminetetraacetic acid (EDTA) as an anticoagulant. Genomic DNA was then extracted from the whole blood using the DNeasy Blood & Tissue Kit (QIAGEN).
2.4 DNA quantification by spectrophotometric method
DNA purity and concentrations were assessed using a Nanodrop ND-2000c spectrophotometer (Thermo Scientific, Wilmington, DE, USA). The samples were taken to room temperature. The spectrophotometer pedestal was wiped with free tissue soaked with Buffer AE and later with a new dry tissue; Buffer AE was used as blank. After that, the OD260 was evaluated. The purity of DNA was assessed by measuring the absorption ratio at 260 and 280 nm (A260/A280 ratio), with normal levels between 1.7–1.9. DNA samples were diluted with Buffer AE. Hence, the concentration and purity were determined for each sample. Each sample contained 100 µl of working DNA (50 ng/µl) labeled and stored at – 20° C.
2.5 Single nucleotide polymorphisms and genotyping
Polymorphisms of the TRAF1 gene (rs2239657G/A, rs2416804 G/C, rs7021049 G/T, and rs3761847 G/A), were detected in all subjects using the TaqMan allelic discrimination method. These SNPs were identified through the dbSNP database (https://www.ncbi.nlm.nih.gov/snp/). SNPs were selected based on a minor allele frequency (MAF) ≥5 % and Hardy-Weinberg equilibrium (HWE) P value cut-off >0.005. TRAF1 genotyping of the three SNPs was performed using VIC- and FAM-labelled allelic discrimination methods with assay-on-demand TaqMan assays, ordered from Applied Biosystems, according to the manufacturer’s instructions using the QuantStudio™ 7 Flex Real-Time PCR System (Applied Biosystems, USA). Real-time PCR was carried out in a 10 µl reaction system containing 0.26 µl 2x SNP Genotyping Assay, 5.5 µl 2x Power Taq Master Mix, 2.24 µl Nuclease-Free Water, and 2 µl DNA template (100 ng/µl). The PCR conditions for all SNPs were as follows: 1 cycle at 95 °C for 10 min, followed by 40 cycles at 95 °C for 15 s, 55 °C for 30 s, and 72 °C for 30 s, with a final extension at 72 °C for 5 min. For confirmation, about 5 % of the samples were randomly selected for repeat genotyping.
2.6 mRNA relative quantification by quantitative PCR
cDNA synthesis and genomic DNA elimination were carried out using the Reverse Transcription System Kit (Promega, Madison, USA). Quantitative PCR (qPCR) was then performed with TaqMan gene expression assays (ThermoFisher), employing specific probes for the TRAF1 gene (Catalog #4331182, Assay ID: Hs01090170_m1). GAPDH served as the reference gene, and its expression was quantified using the TaqMan® gene expression assay (Catalog #4331182, Assay ID: Hs02758991_g1) (ThermoFisher) as an endogenous control for normalization. All reactions were conducted in triplicate, utilizing 25 ng of cDNA per reaction on the QuantStudio™ 7 Flex Real-Time PCR System (Applied Biosystems, USA). The amplification protocol began with an initial denaturation at 95 °C for 5 min, followed by 40 cycles of denaturation at 95 °C for 15 s, annealing at 60 °C for 60 s, and extension at 72 °C for 30 s, concluding with a final extension step of 10 min at 72 °C. Gene expression levels were calculated relative to the control group using the comparative CT method (the 2−ΔΔCt).
2.7 Statistical analysis
The control data was evaluated using the Hardy-Weinberg equilibrium test to identify any deviations in the control samples. Chi-square analysis was employed to compare genotype distributions and allele frequency differences between groups. SNP genotypes were categorized into three groups: homozygous for the ancestral allele, heterozygous, and homozygous for the minor allele. Odds ratios (OR) with 95 % confidence intervals (CI) were calculated to estimate the strength of associations. Statistical significance was determined using a two-tailed p-value threshold of ≤0.05. All statistical analyses were performed using SPSS version 22 (SPSS Inc., Chicago, IL, USA).
3 Results
3.1 Association between TRAF1 (rs2239657 G/A) genotype and allele frequencies for genetic models with the AIC and BIC scores in patients with ALL and control group
Frequencies of the TRAF1 rs2239657 GG (wild type), GA (heterozygous), and AA (polymorphic homozygous) genotypes were 4 %, 36.7 %, and 59.30 % in ALL patients, and 6.1 %, 31.3 %, and 62.6 % in the healthy control group, respectively. Moreover, frequency of the TRAF1 rs2239657 G allele was 0.22 % and 0.22 % in the ALL patient and control groups, respectively.
The genotype distribution of the TRAF1 rs2239657 was governed by the Hardy–Weinberg equilibrium (p > 0.05). The genotype and allele frequencies did not differ between the patients and the control group for all genetic models except for the over-dominant model, which was found at a higher frequency in cases (36.7 %) than in controls (31.3 %) as well as a 14.22‐fold increased ALL risk (Table 2). Abbreviations: OR, odds ratio; CI, confidence interval, N, number of individuals; Boldfaced values indicate a significant difference at the P > 0.05 level.
Genetic model type
Genotype/
variantALL patients
N = 150Controls
N = 115Control vs Patients
Count
%
Count
%
OR (95 % CI)
P-value
AIC
BIC
Codominant
A/A
89
59.30
72
62.6
Ref
G/A
55
36.60
36
31.3
13.33 (0.85–208.7)
0.33
534
143
G/G
6
4
7
6.1
0.51 (0.01–42.8)
0.52
Dominant
A/A
89
59.3
72
62.6
1
0.11
534
142
G/A-G/G
61
40.7
43
37.4
6.60 (0.6–76.4)
Recessive
A/A- G/A
144
96
108
93.9
1
0.47
536
143
G/G
6
4
7
6.1
0.26 (0.01–11.2)
Over-dominant
A/A-G/G
95
63.3
79
68.7
1
0.03
532
142
G/A
55
36.7
36
31.3
14.22 (0.94–214.3)
Log-additive
–
–
–
–
–
2.09 (0.38–11.46)
0.38
535
143
Allele frequency
A
178
0.78
180
0.78
Ref
G
67
0.22
50
0.22
0.96 (0.63–1.46)
0.87
–
–
3.2 Association between TRAF1 (rs2416804 G/C) genotype and allele frequencies for genetic models with the AIC and BIC scores in patients with ALL and control group
Frequencies of the TRAF1 rs2416804 GG (wild type), GC (heterozygous), and CC (polymorphic homozygous) genotypes were 20.7 %, 44.7 %, and 34.7 % in ALL patients, and 10.4 %, 55.7 %, and 33.9 % in the healthy control group, respectively. Moreover, the TRAF1 rs2416804 C allele frequency was 0.57 % and 0.62 % in the ALL patient and control groups, respectively (Table 3). Abbreviations: OR, odds ratio; CI, confidence interval, N, number of individuals; Boldfaced values indicate a significant difference at the P > 0.05 level.
Genetic model type
Genotype/
variantALL patients
N = 150Controls
N = 115Control vs Patients
Count
%
Count
%
OR (95 % CI)
P-value
AIC
BIC
Co-dominant
CC
52
34.7
39
33.9
Ref
GC
67
44.7
64
55.7
0.405 (0.19–0.85)
0.01
514
141
GG
31
20.7
12
10.4
0.516 (0.23–1.13)
0.09
Dominant
C/C
52
34.7
39
33.9
1
0.08
533
142
G/C-G/G
98
65.3
76
66.1
16.89 (0.52–545.5)
Recessive
C/C-G/C
119
79.3
103
89.6
1
0.25
513
140
G/G
31
20.7
12
10.4
0.45 (0.21–0.91)
Over-dominant
C/C-G/G
83
55.3
51
44.4
1
0.17
534
142
G/C
67
44.7
64
55.6
0.17 (0.01–2.41)
Log-additive
–
–
–
–
–
NA (2.44-NA)
0.09
519
141
Allele frequency
C
171
0.43
88
0.38
Ref
G
129
0.57
142
0.62
0.46 (0.32–0.66)
0.0001
–
–
The results showed that TRAF1 SNP rs2416804 had a statistically significant protective association with Saudi ALL patients. The heterozygous variant “GC” genotype showed significant association against the disease (OR: 0.4; χ2 = 1.21; CI: 0.19–0.85; p = 0.01). Carriage of the C allele was significantly associated with decrease ALL risks (OR: 0.46; 95 % CI: 0.32–0.66; P = 0.0001).
In addition, the genotype distributions did not significantly deviate from Hardy-Weinberg expectations for both groups (p > 0.05).
3.3 Association between TRAF1 (rs7021049 G/T) genotype and allele frequencies for genetic models with the AIC and BIC scores in patients with ALL and control group
The genotype distribution of TRAF1/C5 rs7021049 polymorphism among the control group did not deviate from Hardy-Weinberg equilibrium (p = 0.07). As shown in Table 4, non-significant evidence was found in neither genotype (p˃ 0.05) nor allele (T vs. G, p = 0.47) distribution of TRAF1/C5 rs7021049 polymorphism between ALL patients and healthy controls. Abbreviations: OR, odds ratio; CI, confidence interval, N, number of individuals; Boldfaced values indicate a significant difference at the P > 0.05 level.
Genetic model type
Genotype/
variantALL patients
N = 150Controls
N = 115Control vs Patients
Count
%
Count
%
OR (95 % CI)
P-value
AIC
BIC
Codominant
TT
48
32
37
32.2
Ref
GT
76
50.7
65
56.5
0.58 (0.27–1.23)
0.15
537
143
GG
26
17.3
13
11.3
0.64 (0.29–1.43)
0.28
Dominant
T/T
48
32
37
32.2
1
0.57
536
143
G/T-G/G
102
68
78
67.8
1.96 (0.19–20.13)
Recessive
T/T-G/T
124
82.7
102
88.7
1
0.44
536
143
G/G
26
17.3
13
11.3
0.3 (0.02–6.29)
Over-dominant
T/T-G/G
74
49.3
50
43.5
1
0.25
535
143
G/T
76
50.7
65
56.5
3.84 (0.36–40.87)
Log-additive
–
–
–
–
–
0.98 (0.21–4.59)
0.98
536
143
Allele frequency
T
172
57.3
91
39.5
Ref
G
128
42.6
139
60.5
0.88 (0.62–1.24)
0.47
–
–
3.4 Association between TRAF1 (rs3761847 G/A) genotype and allele frequencies for genetic models with the AIC and BIC scores in patients with ALL and control group
Frequencies of the TRAF1 rs3761847 GG (wild type), GA (heterozygous), and AA (polymorphic homozygous) genotypes were 26 %, 42 %, and 32 % in ALL patients, and 8.7 %, 59.1 %, and 32.2 % in the healthy control group, respectively. Moreover, frequency of the TRAF1 rs3761847 G allele was 53 % and 62 % in the ALL patient and control groups, respectively.
The genotype and allele frequencies of the rs3761847 in TRAF1 gene in ALL patients and the control group are shown in Table 5. Abbreviations: OR, odds ratio; CI, confidence interval, N, number of individuals; Boldfaced values indicate a significant difference at the P > 0.05 level.
Genetic model type
Genotype/
variantALL patients
N = 150Controls
N = 115Control vs Patients
Count
%
Count
%
OR (95 % CI)
P-value
AIC
BIC
Codominant
A/A
48
32
37
32.2
Ref
G/A
63
42
68
59.1
0.23 (0.10–0.5)
<0.001
536
143
G/G
39
26
10
8.7
0.33 (0.14–0.75)
0.05
Dominant
A/A
48
32
37
32.2
1
0.68
536
143
G/A −G/G
102
68
78
67.8
0.57 (0.04–8.4)
Recessive
A/A- GA
111
74
105
91.3
1
0.2
534
142
G/G
39
26
10
8.7
9.19 (0.25–334.5)
Over-dominant
A/A-G/G
87
58
47
40.9
1
0.26
535
143
G/A
63
42
68
59.1
0.3 (0.04–2.54)
Log-additive
–
–
–
–
–
1.64 (0.21–13.12)
0.64
536
143
Allele
frequencyA
159
47
142
38
Ref
G
141
53
88
62
0.69 (0.49–0.99)
0.04
–
–
There was a highly significant difference in the distribution of TRAF1 rs3761847 genotypes GA vs. AA for the Co-dominant model between the patient and control groups (OR: 0.23; χ2 = 13.22; CI: 0.10–0.5; p < 0.001). Moreover, carriers of the minor allele A were at significantly reduced risk of ALL compared with carriers of the G allele (OR: 0.69; χ2 = 4.05; CI: 0.49–0.99; p = 0.04). In addition, the genotype distributions did not deviate from Hardy-Weinberg expectations for both groups (p > 0.05).
3.5 Association of TRAF1 relative mRNA expression and ALL
Analysis of TRAF1 revealed significantly higher mRNA expression in ALL patients compared to the control group, with a mean ΔCt of 3.8 ± 0.38 versus 5.08 ± 0.5, p = 0.005 (Table 6, Fig. 1). Further analysis using the 2^-ΔΔCt method demonstrated that TRAF1 expression in ALL patients was also significantly higher than in healthy donors, with a fold change of 3.10 ± 0.65, p = 0.003 (Fig. 2). Mood median test for TRAF1, Data are shown as mean ± SE (standard Error).
Δ Ct TRAF1
Control
Patient
P- value
5.08 ± 0.5
3.8 ± 0.38
7.94
0.005
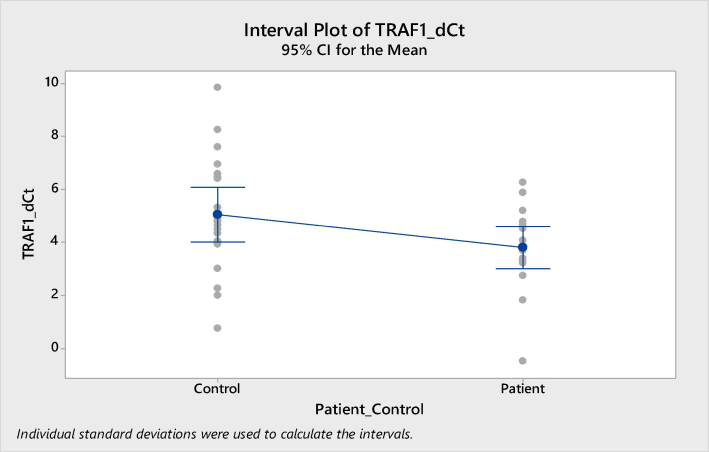
Expression of TRAF1 in ALL patients compared to healthy volunteers in peripheral blood. Higher expression of TRAF1 in in blood samples of ALL patients compared to healthy volunteers (p < 0.005).
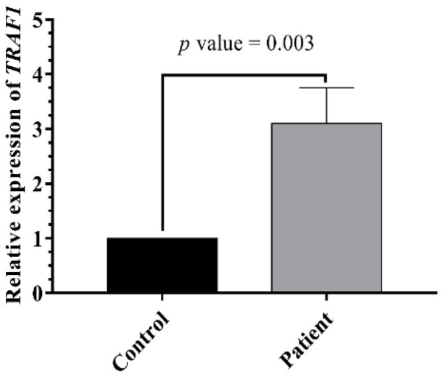
TRAF1 expression level in ALL and control. TRAF1 level varied significantly between patients and control (p = 0.0001).
4 Discussion
TRAFs are a family of cytoplasmic adaptor proteins that regulate the signal transduction pathways of many receptors. They play diverse roles in complex signaling pathways in vivo by interacting with various substrates, other adaptors, and transcription factors. These interactions result in distinct outcomes in different signaling complexes. This study is the first to explore whether variants in the TRAF1 gene contribute to the risk of ALL in our population or any other populations. We genotyped four intronic single nucleotide polymorphisms (SNPs) from the TRAF1 adaptor gene.
The frequency of the (G) allele in rs2239657 at the TRAF1 gene in healthy Saudis was 0.22, similar to Africans (0.22) and Punjabis in Lahore (0.23). Furthermore, the highest frequency recorded was in individuals of North and Western European ancestry (0.34). The rs2239657-GA genotype was associated with an increased risk in patients with ALL. These results are in line with the study by Chang et al. (2008), which reported that rs2239657 is a risk factor in American rheumatoid arthritis patients.
Furthermore, the G allele frequency of rs2416804 at the TRAF1 gene in healthy Saudis was 0.62. However, the frequency of the Saudi G allele was higher than that in many populations such as Colombia (0.39), Bengali from Bangladesh (0.29), and Gujarati Indians in Houston (0.27). In contrast, the Mende in Sierra Leone (0.92) and Gambian in Western Division in the Gambia (0.9) have a higher G allele frequency than that of Saudis (1000 Genomes Project Consortium, 2015). In this study, we identified a significant association between TRAF1 rs2416804 on chromosome 9 and susceptibility to ALL, with the G allele showing an odds ratio (OR) of 0.46 (P = 0.0001). Heßler et al. (2016) reported an association of the TRAF1 SNP rs2416804 with carotid intima-media thickness in a German population, a recognized marker for early-stage atherosclerosis. They observed complete linkage disequilibrium between rs2416804 and rs3761847 (r2 = 0.96). However, our findings indicate a contrasting pattern of linkage disequilibrium between rs2416804 and rs3761847 in the Saudi population. The G allele frequency in rs7021049 at the TRAF1 gene in the healthy participants was 60.5 %. A comparison of this studied SNP between the healthy Saudi population and different populations revealed that many populations have a much higher G allele frequency than that of Saudi Arabia, for instance, Gambian in Western Division in the Gambia (0.91) and Mende in Sierra Leone (0.92). However, many populations have a lower G allele frequency than our population, such as Gujarati Indians in Houston (0.27) and Bengalis from Bangladesh (0.3). The association pattern of the TRAF1 gene variant (rs7021049) with ALL resembles the patterns observed in American rheumatoid arthritis patients (Chang et al., 2008).
Additionally, the G allele frequency of rs3761847 (G/A) at the TRAF1-C5 locus in healthy subjects was 62.0 %. This is similar but not identical to the data from multiple populations, such as Mende in Sierra Leone (0.62) and Gambian in Western Division in the Gambia (0.6). However, the highest frequency recorded was in the Luhya in Kenya (0.76). Many populations have a lower G allele frequency than that of Saudi Arabia, for instance, Bengalis from Bangladesh (0.29) and Punjabis in Lahore, Pakistan (0.34). The TRAF1/C5 region located on 9q33-34 contains the TRAF1 gene as well as the C5 gene, both of which might be implicated in the development and susceptibility to different diseases. Similarly, Marino (2014) found that the G allele is associated with an increased risk of Alzheimer’s disease. Conversely, Huang et al. (2019) did not find any significant association between the rs3761847 polymorphism and genetic susceptibility to rheumatoid arthritis under any genetic models in Chinese. Thus, ethnic disparities account for the differences in frequency among groups.
In this study, we examined the expression levels of TRAF1 in patients with ALL. Our results revealed a markedly elevated expression of the TRAF1 gene in Saudi patients diagnosed with ALL, in contrast to the minimal expression observed in healthy controls. This upregulation is presumably linked to the absence of pharmacological intervention, as the patients were newly diagnosed, potentially influencing the onset and progression of this acute malignancy. Our findings suggest that TRAF1 expression could function as an independent prognostic marker in ALL patients. Furthermore, we hypothesize that SNPs affecting TRAF1 may lead to allele-specific variations in mRNA expression in ALL patients compared to healthy individuals. These polymorphic variations may contribute to the differential regulation of gene expression and are frequently associated with disease susceptibility.
Compared to the control group, TRAF1 mRNA expression was significantly higher in ALL patients. This increased expression might reflect an impaired response toward the malignant clonal populations. Among the TNFR family, TRAF1 is predominantly expressed in the lymphoid system, with its expression restricted to lymphoid tissue (Dürkop et al., 1999). TRAF1 is present at minimal levels in resting lymphocytes and monocytes, similar to our findings in the healthy group, and its expression increases upon activation through the NF-κB pathway (Edilova et al., 2018). Extensive evidence supports the alteration of TRAF1 expression in hematological malignancies (Munzert et al., 2002). Many human B-cell malignancies, including B-cell chronic lymphocytic leukemia, Hodgkin lymphoma, non-Hodgkin lymphoma, and Burkitt’s lymphomas, exhibit constitutive activation of the signal transduction system mediated by TRAF1 with CD30, and CD40L, potentially activating NF-κB. Such mutations in TRAF1 have been detected in some blood cancers (Edilova et al., 2018), contributing to apoptosis resistance. Remarkably, TRAF1 is a potential candidate for transducing NF-κB/Rel activity, which mediates the inhibition of apoptosis (Schwenzer et al., 1999).
In this study, the association of the TRAF1 gene with ALL resembles patterns observed in various leukemias and cancers. Munzert et al. (2002) reported TRAF1 and TRAF2 overexpression in B-CLL compared to normal CD19 + B cells, alongside constitutive NF-κB/Rel activation, consistent with findings by Furman et al. (2000). Similarly, Zapata et al. (2000) found TRAF1 overexpressed in 48 % of non-Hodgkin lymphoma cases, with the highest levels in B-CLL compared to normal peripheral blood B cells. Overexpression of TRAF1 has been detected in lung cancer (Wang et al., 2018), while low to moderate expression levels have been detected in anaplastic large cell lymphoma and diffuse large B-cell lymphoma (Dürkop et al., 2003). These findings are consistent with our data. Edilova et al. (2018) demonstrated that TRAF1 polymorphism may increase the expression and production of pro-inflammatory cytokines, including TNF and IL-6, suggesting the potential impact of SNPs in TRAF1.
Conclusion: In conclusion, our study investigated the correlation between TRAF1 gene polymorphisms and the risk of ALL in Saudi Arabian patients, marking a pioneering exploration in this domain. By analyzing four intronic SNPs in the TRAF1 gene, we found significant associations between these polymorphisms and ALL risk. Our data suggest that TRAF1 expression is markedly elevated in ALL patients compared to healthy controls, implying that TRAF1 could serve as an independent prognostic marker. These findings highlight the importance of genetic variations in TRAF1 in the pathogenesis of ALL and suggest that further studies are warranted to explore the potential of TRAF1 as a therapeutic target in ALL and other related malignancies.
CRediT authorship contribution statement
Fadwa M. Alkhulaifi: Writing – original draft, Methodology, Investigation, Formal analysis, Data curation. Jamilah Alshammari: Writing – review & editing. Hussah M. Alobaid: Writing – review & editing. Fatimah Basil Al-Mukaynizi: Methodology. Safa A. Alqarzae: Writing – review & editing. Suliman Alomar: Visualization, Validation, Supervision, Resources, Project administration, Funding acquisition.
Acknowledgement
This project was supported by the Researchers Supporting Project number (RSP-2024/35), King Saud University, Riyadh, Saudi Arabia.
Declaration of competing interest
The authors declare that they have no known competing financial interests or personal relationships that could have appeared to influence the work reported in this paper.
References
- Improved outcomes of childhood acute lymphoblastic leukemia: a retrospective single center study in Saudi Arabia. Asian Pac. J. Cancer Prev.. 2019;20(11):3391.
- [Google Scholar]
- The burden of leukemia in the Kingdom of Saudi Arabia: 15 years period (1999–2013) BMC Cancer. 2019;19:1-10.
- [Google Scholar]
- The experimental significance of isorhamnetin as an effective therapeutic option for cancer: a comprehensive analysis. Biomed. Pharmacother.. 2024;176:116860
- [Google Scholar]
- Genetic variation in 1253 immune and inflammation genes and risk of non-Hodgkin lymphoma. Blood, J. Am. Soc. Hematol.. 2007;110(13):4455-4463.
- [Google Scholar]
- Chang, M., Rowland, C.M., Garcia, V.E., Schrodi, S.J., Catanese, J.J., van der Helm-van Mil, A.H., Ardlie, K.G., Amos, C.I., Criswell, L.A., Kastner, D.L., Gregersen, P.K., 2008. A large-scale rheumatoid arthritis genetic study identifies association at chromosome 9q33. 2. PLoS Genet. 4(6), e1000107.
- Tumor necrosis factor receptor-associated factor 1 is overexpressed in Reed-Sternberg cells of Hodgkin’s disease and Epstein-Barr virus-transformed lymphoid cells. Blood, J. Am. Soc. Hematol.. 1999;93(2):617-623.
- [Google Scholar]
- Differential expression and function of A20 and TRAF1 in Hodgkin lymphoma and anaplastic large cell lymphoma and their induction by CD30 stimulation. J. Pathol.: J. Pathol. Soc. Great Britain Ireland. 2003;200(2):214-221.
- [Google Scholar]
- Modulation of NF-κB activity and apoptosis in chronic lymphocytic leukemia B cells. J. Immunol.. 2000;164(4):2200-2206.
- [Google Scholar]
- The role of tumor necrosis factor associated factors (TRAFs) in vascular inflammation and atherosclerosis. Front. Cardiovasc. Med.. 2022;9:826630
- [Google Scholar]
- Linkage and association analysis identifies TRAF1 influencing common carotid intima-media thickness. Stroke. 2016;47(12):2904-2909.
- [Google Scholar]
- Associations of TRAF1/C5 rs10818488 and rs3761847 polymorphisms with genetic susceptibility to rheumatoid arthritis: a case-control study and updated meta-analysis. Central Eur. J. Immunol.. 2019;44(2):159-173.
- [Google Scholar]
- Incidence trends of childhood acute lymphoblastic leukemia in Saudi Arabia: Increasing incidence or competing risks? Cancer Epidemiol.. 2020;67:101764
- [Google Scholar]
- TRAF molecules in inflammation and inflammatory diseases. Curr. Pharmacol. Rep.. 2018;4:64-90.
- [Google Scholar]
- Xenoestrogens challenge 17β-estradiol protective effects in colon cancer. World J. Gastrointest. Oncol.. 2014;6(3):67.
- [Google Scholar]
- Tumor necrosis factor receptor-associated factor 1 gene overexpression in B-cell chronic lymphocytic leukemia: analysis of NF-κB/Rel–regulated inhibitors of apoptosis. Blood, J. Am. Soc. Hematol.. 2002;100(10):3749-3756.
- [Google Scholar]
- Structure of TRAF family: current understanding of receptor recognition. Front. Immunol.. 2018;9:404673
- [Google Scholar]
- Dysregulated TRAF3 and BCL2 expression promotes multiple classes of mature non-hodgkin B cell lymphoma in mice. Front. Immunol.. 2019;9:3114.
- [Google Scholar]
- The human tumor necrosis factor (TNF) receptor-associated factor 1 gene (TRAF1) is up-regulated by cytokines of the TNF ligand family and modulates TNF-induced activation of NF-κB and c-Jun N-terminal kinase. J. Biol. Chem.. 1999;274(27):19368-19374.
- [Google Scholar]
- TRAF1 is critical for regulating the BRAF/MEK/ERK pathway in non–small cell lung carcinogenesis. Cancer Res.. 2018;78(14):3982-3994.
- [Google Scholar]
- TRAF molecules in cell signaling and in human diseases. J. Mol. Signal.. 2013;8(1):1-31.
- [Google Scholar]
- Association study of TRAF1/C5 polymorphism (rs10818488) with susceptibility to rheumatoid arthritis and systemic lupus erythematosus: a meta-analysis. Gene. 2013;517(1):46-54.
- [Google Scholar]
- TNFR-associated factor family protein expression in normal tissues and lymphoid malignancies. J. Immunol.. 2000;165(9):5084-5096.
- [Google Scholar]
- Genetic alterations of TRAF proteins in human cancers. Front. Immunol.. 2018;9:2111.
- [Google Scholar]
Appendix A
Supplementary data
Supplementary data to this article can be found online at https://doi.org/10.1016/j.jksus.2024.103582.
Appendix A
Supplementary data
The following are the Supplementary data to this article:


