

Translate this page into:
Rapid simultaneous clinical monitoring of five oral anti-coagulant drugs in human urine using green microextraction technique coupled with LC–MS/MS
⁎Corresponding authors at: Research Center for Environmental Medicine & Department of Medicinal and Applied Chemistry, Kaohsiung Medical University, Taiwan. cfwu27@nuu.edu.tw (Chia-Fang Wu), kumar@kmu.edu.tw (Vinoth Kumar Ponnusamy), 960021@cc.kmuh.org.tw (Ming-Tsang Wu)
-
Received: ,
Accepted: ,
This article was originally published by Elsevier and was migrated to Scientific Scholar after the change of Publisher.
Peer review under responsibility of King Saud University.
Abstract
Abstract
Objectives
There is no analytical method for simultaneous monitoring of warfarin and novel direct oral anticoagulants (NOACs) in human urine samples in a single run in the clinics. Although several studies have reported their measurements in human blood samples, but its sample collection is more invasive and time-consuming, thereby challenging to monitor frequently.
Methods
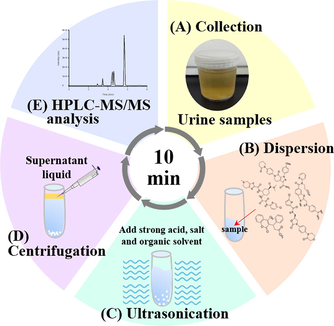
In this work, we developed a fast microextraction technique (ultrasound-assisted salt-induced liquid-liquid microextraction, USA-SI-LLME) coupled with high-performance liquid chromatography-tandem mass spectrometry (HPLC–MS/MS) to rapidly quantify four commonly used NOACs drugs (apixaban, dabigatran, edoxaban, and rivaroxaban) and warfarin in human urine samples. USA-SI-LLME conditions were optimized using a water-miscible organic solvent as an extraction solvent, high salt concentrations, sample pH, and extraction time (∼5.5 min).
Results and conclusions
The analytical method showed excellent linearities from 0.5 to 500 μg/L for apixaban, edoxaban, rivaroxaban, warfarin, and 1 ∼ 500 μg/L for dabigatran. Intra- and inter-day precision values were <9.31% and R2 > 0.99 for all analytes. Limits of detection ranged between 0.07 ∼ 0.18 μg/L, and relative recoveries ranged between 92.18 and 110.15%. This method was successfully applied to analyze 15 one-spot urine samples from 15 clinical patients who regularly took warfarin or NOACs, and high accuracy was found. We concluded that this method could be used as a non-invasive high-throughput and rapid monitoring of NOACs and warfarin in human urine in clinical settings and could provide timely analysis during emergency care.
Keywords
Novel direct oral anticoagulants
Warfarin
Microextraction technique
Human urine
Liquid chromatography–tandem mass spectrometry

1 Introduction
Novel direct oral anticoagulants (NOACs) have gradually replaced the conventional vitamin K antagonists (VKAs) such as warfarin for the prevention of atrial fibrillation (AF)-associated stroke and systematic venous thromboembolism (VTE) because they have relatively predictable pharmacokinetic profiles and they have faster action onset times and elimination rates (Baglin, 2013). Although the NOACs currently approved for use in Taiwan (apixaban, dabigatran etexilate, edoxaban, and rivaroxaban) can be administered at fixed doses with usually no need for routine monitoring, pharmacokinetics studies and large clinical trials have reported them to vary widely in blood concentrations from one person to another, suggesting differences in clearance and metabolism rates. Because anticoagulant levels are not usually regularly or routinely monitored in these patients, those taking fixed-dose therapeutic regimes over a long time could potentially be taking inappropriate dosages of these drugs, mainly if there is a change in elimination rate. In this situation, there is a chance that excessive or suboptimal anticoagulation concentrations could lead to therapeutic failure or adverse drug reactions, including significant bleeding (Gong and Kim, 2013; Hellwig and Gulseth, 2013). Therefore, it would be beneficial to develop a non-invasive method of quantifying concentrations of the different NOACs for point-of-care service, expanding upon the precision medicine capabilities of the service. Prothrombin time (PT), activated partial thromboplastin time (aPTT), and thrombin time (TT) assays are traditionally used as laboratory coagulation tests for VKAs. However, they are not appropriately applied to monitoring NOACs because test results are not reproducible, and they do not progress linearly over a wide range of drug concentrations (Eriksson et al., 2009; Stöllberger, 2017). Since NOACs have different targets, it is also challenging to develop pharmacodynamic assays for them. Even those with the same targets give inconsistent quantitative results when traditional coagulation assays are used to monitor them.
High-performance liquid chromatography-tandem mass spectrometry (HPLC–MS/MS) is generally accepted to determine small molecule concentrations in biological fluids in many clinical laboratories. It provides much better selectivity than traditional laboratory coagulation tests, making it possible to precisely detect and quantify different coagulation inhibitors. According to the literature review, we found several articles reporting the use of HPLC–MS/MS to measure concentrations of different NOACs in plasma (Țilea et al., 2015; Baldelli et al., 2016; Derogis et al., 2017; Wiesen et al., 2017). However, most of these studies have been utilized protein precipitation with different organic solvents (such as methanol, acetonitrile, hydrochloric acid) and solid-phase extraction (SPE) for sample preparation. Wiesen H.M. et al. recently developed a UHPLC–MS/MS method with sample clean-up using magnetic beads to quantify all NOACs. In these methods, the linearity ranges were from 0.5 to 625 ng/mL for NOACs (Wiesen et al., 2017). However, there are no procedures to date that can simultaneously assess urine concentrations of warfarin and as well as all the current NOACs in a single analytical run. In addition, the collection of blood specimens requires trained medical personnel, and it may be challenging to perform in children, the elderly, and uncooperative subjects. Thus, in this study, seeking to find a non-invasive method for quickly quantifying NOACs, we developed a rapid ultrasound-assisted salt-induced liquid-liquid microextraction method (USA-SI-LLME) to extract warfarin and all NOACs from urine and combined it with analysis and quantification by HPLC–MS/MS performed in a single analytical run. We tested this method using urine samples from 15 outpatients prescribed anticoagulants and found 100% accuracy of their prescribed anticoagulants. This is the first report of the development and validation of the USA-SI-LLME method coupled with HPLC–MS/MS to quantify NOACs and warfarin in human urine samples.
2 Materials and methods
2.1 Chemicals and reagents
Ammonium acetate, formic acid, warfarin, ammonium sulphate (Na2SO4), sodium hydroxide (NaOH), and hydrochloric acid (HCl) were purchased from Sigma-Aldrich (Deisenhofen, Germany). Apixaban, [13C.d3]-apixaban, dabigatran (the active form of dabigatran etexilate), [13C6]-dabigatran, edoxaban, rivaroxaban, rivaroxaban-d4, and warfarin-d5 were purchased from Toronto research chemicals (Toronto, Canada). HPLC–grade acetone (ACT), acetone nitride (ACN), ethyl acetate (EA), isopropanol (IPA), and methanol (MeOH) were obtained from Macron Fine Chemicals. All chemicals used in this study were ACS reagent grade. ELGA pure water system for all aqueous solutions was produced in the laboratory using ELGA pure water system purification system (ELGA, UK).
2.2 Preparation of standard sample solution
Stock solution (1 mg/mL for apixaban, [13C.d3]-apixaban, dabigatran, [13C6]-dabigatran, edoxaban, rivaroxaban, rivaroxaban-d4, warfarin, and warfarin-d5) (Table 1) of each analyte was prepared in dimethyl sulfoxide (DMSO)/MeOH and stored at 4 °C. The working standard solutions were obtained daily by diluting the stock solutions with MeOH at 10 μg/mL. The internal standard solutions, including 50 μg/L [13C.d3]-apixaban, [13C6]-dabigatran, rivaroxaban-d4 and warfarin-d5, were prepared as necessary using appropriate dilution from the internal standard (IS) stock solutions with MeOH.
Analytes
Chemical formulas
Molecular weights
LogP
pKa (A)
pKa (B)
Apixaban
C25H25N5O4
459.50
2.23
13.12
−1.6
Dabigatran
C25H25N7O3
471.51
2.37
11.51
4.24
Edoxaban
C24H30ClN7O4S
548.03
1.61
11.08
7.23
Rivaroxaban
C19H18CIN3O5S
435.88
1.74
13.6
−1.6
Warfarin
C19H16O4
308.33
2.41
6.33
−6.6
2.3 Extraction procedure
One-spot urine samples were obtained from two healthy volunteers and stored below −20 °C until analysis. First, 1 mL urine samples were spiked with working IS solution (50 μg/L) and standard solution in 10 mL glass centrifugation tubes. Then, 1 M of HCl was added and ultrasonicated for 1 min after standing for 30 s. Next, (NH4)2SO4 was added, and the mixture was homogenized by vortex for 30 s, and then extraction was performed using a water-miscible organic solvent. The solution was ultrasonicated for 1 min after vortexing with the organic solvent. To ensure the contents were mixed thoroughly and the analytes were partitioned between the two phases, these mixtures were centrifuged at 5,000 rpm for 3 min, and the supernatant was collected.
2.4 HPLC–MS/MS conditions
High-performance liquid chromatography (1200 HPLC system, Agilent Technologies, Palo Alto, CA, USA) was equipped with a C18 column (4.6 mm*100 mm, 2.6 μm, Sun-Shell C18, ChromaNik technologies Inc.) and column protection system (4 mm*2 mm, 0.12 mm, Macherey-Nagel REF718966, Germany). A gradient elution was conducted for chromatographic separation of analytes with mobile phase A (ACN contained 0.05% formic acid) and mobile phase B (2 mM ammonium acetate contained 0.05% formic acid, pH 3) as follows: 0–1 min (95–95% A), 1–3 min (95–25% A), 3–3.5 min (25–5% A), 3.5–4 min (5–5% A), 4–7 min (5–95% A). Flow-rate was 1.0 mL/min, and the total run time was 7 min. The column temperature was 25 °C, and the injection volume was 5 μL. We used an API 4000 triple quadrupole mass spectrometer equipped with an electrospray ionization (ESI) source (AB Sciex Corp.) for detection by mass spectrometric. The ion spray interface source was run at 600 °C. Curtain gas flow rate was 25 (arbitrary units), source gas 1 flow rate was 60, and source gas 2 flow rate was 60. CAD gas pressure was set at medium and ion spray voltage 5500 V. Multiple reaction monitoring (MRM) mode was used to measure NOACs using the characteristic fragmentation transitions for apixaban (460.4 > 443), dabigatran (472.5 > 289), edoxaban (548.5 > 366.2), rivaroxaban (436.3 > 145), warfarin (309.4 > 163), as summarized in Table S1. Analyst 1.4.2 software (AB Sciex, Corp.) was used for instrument control and data acquisition.
2.5 Method validation
The calibration curves for apixaban, edoxaban, rivaroxaban, and warfarin were prepared in drug-free urine at 0.5 to 500 μg/L. The calibration curves for dabigatran were prepared in drug-free urine at 1.0 to 500 μg/L. Precision and accuracy tests were conducted in the same drug-free urine at three concentrations (2.5, 10, and 100 μg/L) of five anticoagulants. These validations were carried out in intra-day (n = 3) and inter-day (n = 3) assays. Accuracy, defined as relative error (RE), was calculated as RE (%) = [(found concentration − known concentration)/known concentration] × 100% and precision defined as the relative standard deviation (RSD) was calculated as RSD (%) = (standard deviation/mean) × 100%. Acceptable accuracy was defined as not deviating more than ±15% from the known concentration and acceptable precision not deviating 15%. The relative recovery (RR) was calculated as RR (%) = [(found concentration − analyte concentration in drug-free urine sample)/known concentration] × 100%. The limit of detection (LOD) was determined based on concentration with signal to noise ratio of 3 (S/N = 3) calculated as 3 × d (the standard deviation of the y-intercept of the regression line)/S (the average slope of regression lines). The limit of quantification (LOQ) was defined as the lowest concentration of analyte that could be quantitatively determined with acceptable precision and accuracy.
2.6 Clinical application
The performance of the present method was further evaluated in clinical samples. One-spot urine samples were collected from 15 outpatients in the Departments of Cardiology and Neurology. In addition, the patients regularly received checkups to determine whether or not their warfarin and/or NOACs doses needed adjustment. This research was approved by the Institutional Review Board (IRB) of Kaohsiung Medical University Hospital (KMUHIRB-E(I)-20170202).
The study subjects were eligible if they (1) were ≥ 20 years old and were regularly receiving anticoagulation drugs in their outpatient care, (2) they agreed to participate in this study, and (3) they had no history of chronic kidney disease (CCr < 15 mL/min). We calculated the normalization of urinary warfarin or NOACs concentrations with creatinine (Eqs. (1)), adjusting anticoagulant concentrations to a reference value equivalent to those of the general population. The urinary warfarin or NOACs concentrations were expressed as μg/ml, and creatinine-corrected analyte concentration was expressed as μg/mmol.
Unit: μg mmol/L2, Where Canalyte, Ccreatinine, and 114 g/mol were analyte and creatinine concentrations in human urine samples, respectively, 114 g/mol was the molecular weight of creatinine. The urine-creatinine concentrations unit was converted from milligrams to micrograms.
3 Results
We have successfully developed USA-SI-LLME coupled with single-run HPLC–MS/MS quantification of warfarin and NOACs with isotopically labeled standards (IS) in human urine samples. As shown in Table 2, the intra- and an inter-day calibration curve of five anticoagulants ranged 0.5–500 μg/L. The linear regression equation and the squared correlation coefficient (R2 value) of all the analytes were greater than 0.998. The relative recovery were ranged 92.18–110.15% with relative standard deviations less than 10%. LOD ranged 0.07–0.18 μg/L, indicating that the analytical method had a good linear relationship for quantitation. Because extraction efficiencies were affected by extraction solvent used, extractant volume, amount of salt added, and pH value of the sample, we evaluated these parameters to obtain the maximum extraction efficiency below. Note: LOD, limit of detection; LOQ, limit of quantification; R2, correlation coefficient (n = 3); RSD, relative standard deviation. a The regression equations of intra-day analysis were calculated from the assay values of prepared standards on a single day (n = 3); b The regression equations of inter-day analysis were calculated from the assay values of prepared standards on three different days (n = 3).
Analytes
Regression equations
Linear range (μg/L)
R2
RSD (%)
LOD (μg/L)
LOQ (μg/L)
Intra-daya
Apixaban
y = 6.35x − 0.011
0.5–500
0.999
6.06
0.10
0.5
Dabigatran
y = 40.94x − 0.022
1–500
0.998
7.16
0.18
1
Edoxaban
y = 25.35x − 0.023
0.5–500
0.999
6.84
0.07
0.5
Rivaroxaban
y = 87.52x − 0.077
0.5–500
0.999
7.96
0.15
0.5
Warfarin
y = 27.56x + 0.091
0.5–500
0.999
8.10
0.08
0.5
Inter-dayb
Apixaban
y = 6.22x − 0.0053
0.5–500
0.999
7.71
0.10
0.5
Dabigatran
y = 40.54x + 0.0032
1–500
0.998
8.88
0.18
1
Edoxaban
y = 20.97x + 0.026
0.5–500
0.999
6.96
0.07
0.5
Rivaroxaban
y = 78.08x + 0.064
0.5–500
0.999
9.31
0.15
0.5
Warfarin
y = 25.06x + 0.038
0.5–500
0.999
8.78
0.08
0.5
3.1 Optimization of extraction solvent and extractant volume
Five different organic solvents, including acetone (ACT), acetone nitride (ACN), ethyl acetate (EA), isopropanol (IPA), and methanol (MeOH) were evaluated. MeOH did not produce organic phase separation. Therefore, we used four organic solvents (ACT, ACN, EA, and IPA) but not MeOH as extraction solvents to evaluate extraction capacities and phase separation (Fig. 1A). EA with IPA was found to have the highest extraction efficiency compared to the other organic solvents separately. In contrast, when EA alone or EA with ACT was used as the organic solvent, the extraction efficiency of edoxaban was lower. To obtain a higher volume of the collected extractant phase after centrifugation and improve extraction efficiency, we used EA with IPA as the extractant in our further experiments. Different volumes of EA with IPA (200–500 μL) were evaluated for their extraction efficiency (Fig. 1B). We found that 200 μL EA with 300 μL IPA had the best extraction efficiency, indicating that these solvent volumes could affect the collected extractant organic phase and extraction efficiency for all analytes.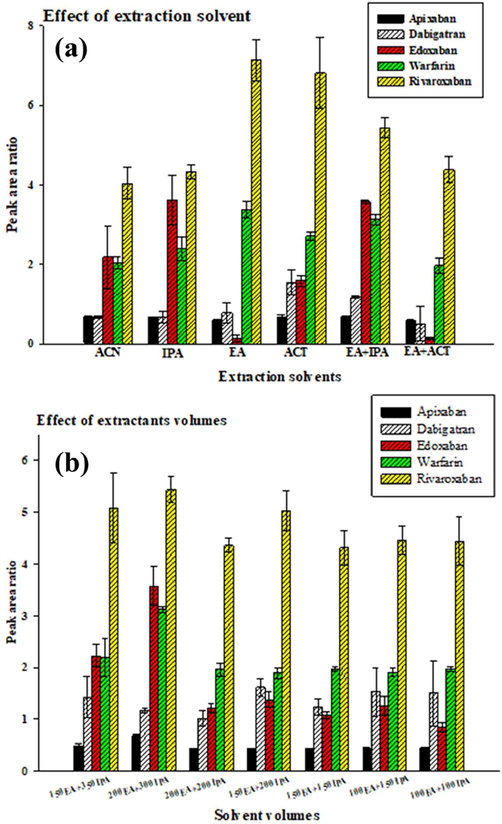
Comparison of different conditions of extraction solvent agents and extraction volumes by USA-SI-LLME method. (A) Extraction solvent agents; (B) extraction volumes. Three independent experiments (mean ± SD); experimental conditions: 5 mL of spiked (100 μg/L of five anticoagulants and 50 μg/L of working IS solution) sample solution (at pH 1) with 4 g of ammonium sulphate under ultrasonication for 1 min and centrifugation for 3 min at 5000 rpm. The separated organic phase was analyzed by HPLC/MS/MS.
3.2 Effect of added salt and extraction solution pH
Different amounts of ammonium sulphate, ranging 2.5–4.5 g, were investigated for use in the extraction system (Fig. 2A). When increasing ammonium sulphate from 2.5 to 4.5 g, we increased the volume of the extractant phase from 200 to 500 μL (Fig. S1). As shown in Fig. 2A, 4 g of ammonium sulphate had the highest extraction efficiency and best precision for all analytes. It was also essential to adjust the pH value of the extraction solution because pH can change the ionization status and solubility of the target analytes, increasing their extraction efficiency. Fig. 2B shows the higher pH value used, the less extraction efficiency obtained. Therefore, pH 1 was opted in the extraction system and for further studies.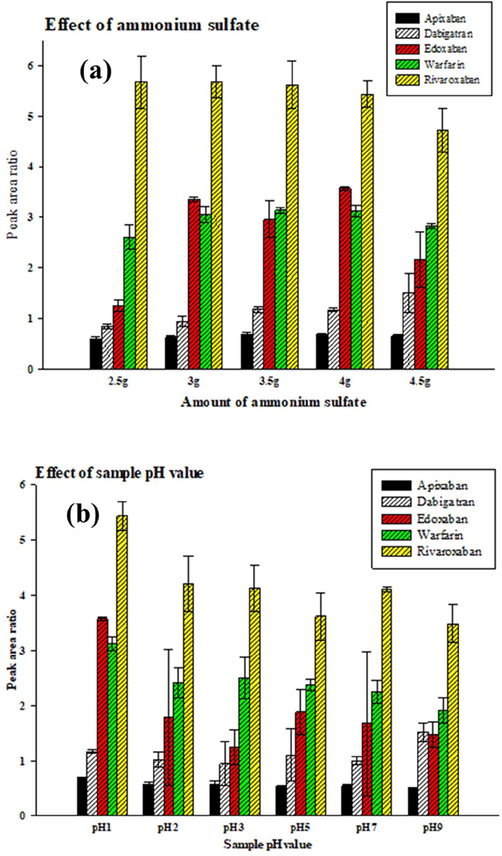
Comparison of different amount of ammonium sulfate and different pH values by USA-SI-LLME method. (A) Different amount of ammonium sulfate; (B) different pH values. Three independent experiments (mean ± SD); experimental conditions were shown in Fig. 2.
3.3 Method evaluation
The selectivity, linearity, repeatability, LOQ, and LOD of the HPLC–MS/MS method were investigated. As shown in Fig. 3, no added interference from drug-free urine samples spiked with five anticoagulants (each 100 μg/L). Their isotopically labeled standards (50 μg/L) were analyzed under the optimal conditions described above (Fig. 3). The linearity of apixaban, edoxaban, rivaroxaban, and warfarin ranged from 0.5 to 500 μg/L and dabigatran from 1.0 to 500 μg/L.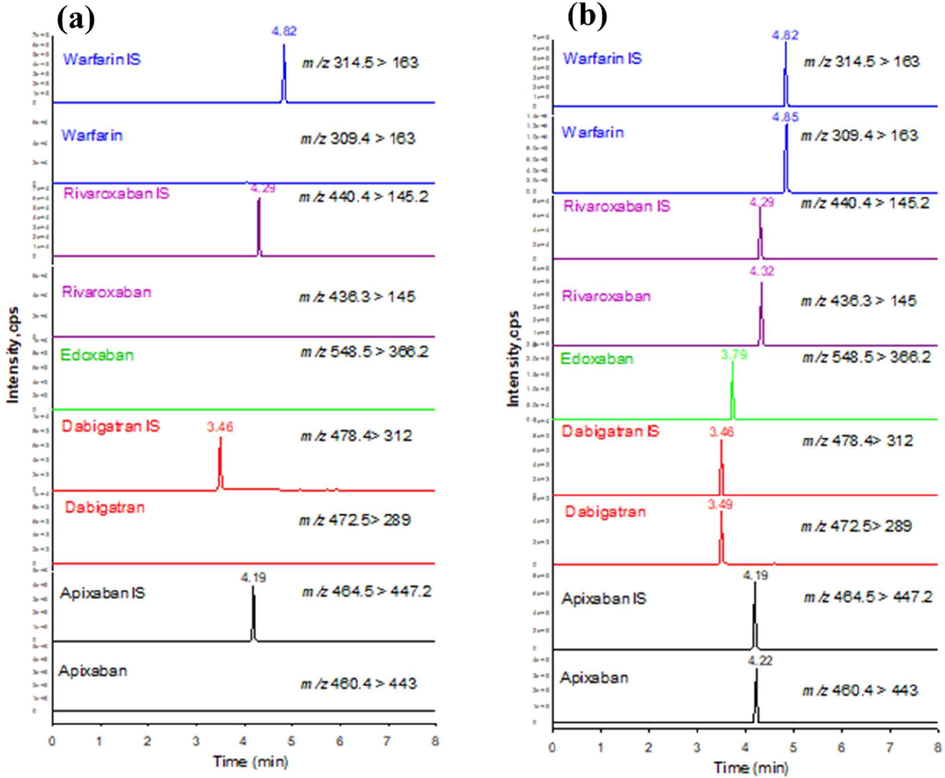
Extracted ion current chromatograms (a) drug-free urine sample spiked with isotopically labelled standards (each 50 μg/L) and b) drug-free urine sample spiked with five anticoagulants in standard solution (each 100 μg/L) and their isotopically labelled standards (each 50 μg/L) under optimal conditions. IS, internal standard.
The linear regression analysis was carried out on the standard curve generated by plotting peak area ratios of the target analytes and internal standard versus concentrations. The mean correlation coefficients for regression equations generated for inter-day and intra-day were both 0.999 for apixaban, edoxaban, rivaroxaban, warfarin, and 0.998 for dabigatran (Table 2). For all analytes, LOQ was within 0.5 to 1 μg/L and LOD within 0.07 to 0.18 μg/L, indicating that the analytical method had acceptable sensitivity and was capable of measuring the analytes at concentrations ranges even lower than therapeutic ranges.
We assessed the precisions and accuracies of the analytes by measuring them in drug-free urine samples obtained from healthy female and male volunteers spiked at three concentration levels (2.5, 10, 100 μg/L). As shown in Table 3, RSDs ranged from 0.68 to 11.32%, RE ranged from −7.82 to 10.15%, and RR from 92.18 to 110.15%, all within acceptable limits.
Analytes
Concentration known (μg/L)
Concentration found (μg/L)
RSD (%)
RE (%)
RR (%)
Femalea
Apixaban
2.5
2.67 ± 0.10
3.60
6.67
106.67
10
10.79 ± 0.18
1.71
7.90
107.90
100
109.87 ± 5.45
4.96
9.87
109.87
Dabigatran
2.5
2.41 ± 0.17
7.17
−3.76
96.24
10
10.51 ± 1.08
10.23
5.08
105.08
100
93.80 ± 2.47
2.64
−6.20
93.80
Edoxaban
2.5
2.38 ± 0.07
3.01
−4.67
95.33
10
10.10 ± 0.15
1.52
0.99
100.99
100
97.82 ± 2.65
2.71
−2.18
97.82
Rivaroxaban
2.5
2.44 ± 0.04
1.57
−2.24
97.76
10
9.87 ± 0.25
2.50
−1.25
98.75
100
95.80 ± 7.75
8.09
−4.20
95.80
Warfarin
2.5
2.45 ± 0.03
1.19
−2.10
97.90
10
9.32 ± 0.78
8.40
−6.76
93.24
100
102.34 ± 5.69
5.56
2.34
102.34
Maleb
Apixaban
2.5
2.75 ± 0.11
4.07
10.04
110.04
10
11.01 ± 0.20
1.86
10.15
110.15
100
99.30 ± 4.01
4.04
−0.70
99.30
Dabigatran
2.5
2.55 ± 0.29
11.32
2.08
102.08
10
9.34 ± 0.34
3.36
−6.63
93.37
100
99.12 ± 0.68
0.68
−0.88
99.12
Edoxaban
2.5
2.63 ± 0.12
4.56
5.08
105.08
10
10.00 ± 0.25
2.47
−0.02
99.98
100
98.48 ± 1.48
1.50
−1.52
98.48
Rivaroxaban
2.5
2.30 ± 0.09
3.74
−7.82
92.18
10
9.75 ± 0.21
2.13
−2.48
97.52
100
107.56 ± 8.98
8.35
7.56
107.56
Warfarin
2.5
2.66 ± 0.19
7.25
6.58
106.58
10
9.64 ± 0.35
3.65
−3.61
96.39
100
99.69 ± 5.01
5.03
−0.31
99.69
3.4 Real sample analysis
This method was successfully applied to analyze 15 one-spot urine samples obtained from 15 patients who regularly underwent warfarin and NOACs prescription in Kaohsiung Medical University Hospital (Table 4). The urine samples were collected from patients treated with apixaban (n = 2), dabigatran etexilate (n = 3), edoxaban (n = 1), rivaroxaban (n = 8) and warfarin (n = 1). Fig. S2 shows the extracted ion current chromatograms of analyzing warfarin and NOACs in 15 one-spot urine samples from patients treated with those drugs. The urinary concentrations ranged 0.027–0.056 μg mmol/L2 for apixaban, 0.03–0.096 μg mmol/L2 for dabigatran, 0.225 μg mmol/L2 for edoxaban, 0.0002–0.067 μg mmol/L2 for rivaroxaban, and 0.0002 μg mmol/L2 for warfarin. CV, coefficient of variation (%); F, female; M, Male; ND, non-detectable.
Patient No.
Gender
Age (years)
Drug prescription
Warfarin
Apixaban
Dabigatran
Edoxaban
Rivaroxaban
Adjusted concentrations (μg mmol/L2) (% CV, n = 3)
1
M
68
Rivaroxaban
ND
ND
ND
ND
0.028 (5.41)
2
M
69
Rivaroxaban
ND
ND
ND
ND
0.020 (3.62)
3
F
75
Apixaban
ND
0.056 (0.17)
ND
ND
ND
4
M
65
Dabigatran
ND
ND
0.096 (3.04)
ND
ND
5
F
69
Dabigatran
ND
ND
0.096 (1.07)
ND
ND
6
M
67
Rivaroxaban
ND
ND
ND
ND
0.045 (2.92)
7
M
71
Dabigatran
ND
ND
0.030 (1.57)
ND
ND
8
F
82
Rivaroxaban
ND
ND
ND
ND
0.008 (3.01)
9
F
68
Warfarin
0.0002 (2.07)
ND
ND
ND
ND
10
F
70
Rivaroxaban
ND
ND
ND
ND
0.035 (3.94)
11
M
75
Rivaroxaban
ND
ND
ND
ND
0.009 (6.65)
12
F
85
Apixaban
ND
0.027 (6.14)
ND
ND
ND
13
M
87
Rivaroxaban
ND
ND
ND
ND
0.067 (0.93)
14
M
65
Rivaroxaban
ND
ND
ND
ND
0.0002 (10.72)
15
M
80
Edoxaban
ND
ND
ND
0.225 (0.24)
ND
4 Discussion
This study found our newly developed rapid USA-SI-LLME method of simultaneously monitoring warfarin and all NOACs currently available in Taiwan in human urine samples, easy and non-invasive collection, in a single analytical run of HPLC–MS/MS to be both accurate and precise. We also successfully applied to the clinics to identify and measure prescribed anticoagulants in 15 patients. Although several studies have used various LC–MS/MS techniques and Turbulent Flow LC/MS to quantify NOACs in human biological specimens (Table 5), they have all been performed using human plasma. Collection by venopuncture is relatively invasive compared to the collection of urine samples. Unlike ours, venopuncture requires the use of professional laboratory technicians, which limits regular and routine monitoring of NOACs in clinics. Ref.: references; ET: extraction time; RT: retention time; LOD: limit of detection; LOQ: limit of quantification; PP: protein precipitation; TFC: turbo flow column (Cyclone C18-P-XL) clean up; HCl: 0.1 mol L−1 aqueous hydrochloric acid; SPE: solid-phase extraction; PVDF: poly(vinylidene fluoride); USA-SI-LLME: ultrasound-assisted salt-induced liquid-liquid microextraction.
NOACs
Matrix in human samples
Sample clean-up
ET (min)
RT (min)
Sample volume (mL)
LOD (μg L−1)
LOQ (μg L−1)
Linearity range (μg L−1)
Ref.
Apixaban, dabigatran, & rivaroxaban
Plasma
SPE
≈60
7
0.2
no data
1
1–500
Baldelli et al., 2016
Rivaroxaban
Plasma
PP-MeOH
10.5
4
0.2
no data
0.5
0.5–500
Rohde, 2008
Apixaban
Plasma
PP-MeOH
15
1.2
0.1
2
4.1
5–500
Delavenne et al., 2013
Dabigatran & rivaroxaban
Plasma
PP-MeOH + HCl
10.5
2.5
0.1
no data
2.5
2.5–500
Korostelev et al., 2014
Apixaban
Plasma
PP-MeOH
6.5
1.2
0.05
no data
9.7
9.7–970
Țilea et al., 2015
Rivaroxaban
Plasma
PP-ACN
30
1.5
0.2
no data
0.57
0.57–625
Iqbal et al., 2015
Apixaban, dabigatran, edoxaban, & rivaroxaban
Plasma
MagSiMUS-Type II kit-ACN
15
1.2
0.05
0.49–0.62
1.47–1.88
2–500
Wiesen et al., 2017
Rivaroxaban
Plasma
PP-MeOH + 0.22 μm PVDF filter
30
5
0.2
no data
2
0.5–500
Derogis et al., 2017
Apixaban, dabigatran, edoxaban, rivaroxaban, & warfarin
Urine
USA-SI-LLME
5.5
5
1
0.07–0.18
0.5–1
0.5–500
Present study
In addition, most reported studies used the protein precipitation method using acetonitrile, methanol, and hydrochloric acid or used solid-phase extraction (SPE) to isolate and clean up the samples (Baldelli et al., 2016). These procedures require time extraction time, laborious, and are expensive (Wiesen et al., 2017). The current study of using the pretreatment method of USA-SI-LLME for NOACs can overcome problems related to complex matrix interferences and other causes of low toxicity, reduce environmental pollution, and increase sensitivity, selectively, and accuracy of the analysis. Although Chen et al. firstly developed an in-tube-based USA-SI-LLME to detect the preservative agent in cosmetic products, providing better performance in recovery and sensitivity, their use of homemade glass tubes would not be widely available (Chen et al., 2013). To overcome this drawback, we used a commercial glass centrifugation tube instead.
The USA-SI-LLME method, an LLME-based technique, requires appropriate organic extraction solvents to extract and concentrate target analyte from aqueous samples before analysis. In this two-phase mixture system, salt is added to help facilitate organic solvent separation from the sample. The target analytes are then isolated from the matrix into a supernatant organic phase that can be evaporated and resuspended or directly injected into a liquid chromatographic system. The most important factors affecting the extraction efficiency in the USA-SI-LLME method are the type of extraction solvent used and solvent volume (Hashemi et al., 2009; Gupta et al., 2010; Chen et al., 2013; Sharifi et al., 2016). This study found that when the solvent volume was decreased, both supernatant organic phase volume and extraction efficiency were decreased (Fig. 1B). When the solvent volume was decreased to 200 μL, extractant phase volume decreased to less than 50 μL and separation worsened, resulting in lower extraction efficiency and less precision. When the solvent volume was increased to 500 μL, the phase separation and the extraction efficiency of all analytes was better than all other volumes used (Fig. S1). The volume of extraction solvents are directly relevant to surface contact between the organic layer and the aqueous sample. In this study, when extraction solvent volumes were larger, surface contact of all the analysts increased, their organic layer could be clearly observed, and their signal intensities increased. We selected the EA with IPA as the extraction solvent because of their low volatility, low toxicity, and low solubility in aqueous solution and because they both can solidify at near room temperature, making them easy to collect by pipet.
One study has evaluated the different types and concentrations of salt that affect phase separation in a similar system. Ammonium sulphate was found to have a strong phase separation ability compared to other salts, including magnesium sulfate, sodium sulphate, and sodium chloride (Pasupuleti et al., 2020). They found that when concentrations of this salt were increased, the hydrophilic compound solubility increased in the aqueous phases by way of a salting-out effect enhancing the extraction efficiency of the analytes in the organic phase. We used ammonium sulphate because of its good solubility and salting-out ability. Our study found the amount of salt added had an impact on extraction efficiency. When the amount of salt up to 4 g was added to the sample solution, extraction efficiency was reduced because the extraction system containing a large amount of saturated salt. The extraction efficiency decreased because high concentration of salt reduced both the mass-transfer efficiency and organic phase solubility (Chen et al., 2018). When the amounts of salt were reduced, the hydrophilic compound solubility decreased in the aqueous phases by a salting-out effect reducing the extraction efficiency of the analytes in the organic phase.
We also investigated the effect of pH value on extraction efficiency. Increasing the pH caused dehydronation in all analytes reducing their extraction efficiencies. Ghambari and Hadjmohammadi (Ghambari and Hadjmohammadi, 2012) reported that an acidic drug (warfarin) could be extracted at low pH value by using dispersive liquid–liquid microextraction method. We also found acidification of the sample solution resulted in the deionization of analytes and increased ability of the analytes to transfer from the water phase into the organic layer, resulting in their better extraction efficiency. The higher sample pH, the lower extraction efficiency of target analytes. Therefore, best extraction efficiency of all analytes was achieved at pH 1.
Importantly, this study found our method able to identify what oral anticoagulant a patient was taking. For example, Patient #7 did not have any information about what anticoagulant was taking before analysis. However, our analysis of his urine revealed that he was taking dabigatran, confirmed by Taiwan’s PharmaCloud system. PharmaCloud system is a cloud-based system developed by Taiwan's National Health Insurance (NHI) to provide physicians a patient's entire pharmaceutical history from different healthcare institutions under their consent to avoid possible medication errors (Liao et al., 2019). Thus, our analytical method can potentially be used by clinicians to monitor the use of anticoagulant drugs in a clinical setting quickly. The limitation of this work is that our real sample size was small. Much larger-scale sample analysis studies are needed. Still, another limitation is that we did not analyze the target drug’s metabolites in urine samples. Until now, it is not clear if any of these metabolites are pharmacologically active. This information is relevant to the evaluation of treatment response and adverse effects.
5 Conclusion
The developed method is fast, sensitive, and simultaneously identified and quantified warfarin and four NOACs in human urine samples to biomonitor five anticoagulants in one single run for clinical use. This non-invasive analytical method can help emergency ward clinicians determine drug dosages and withdrawal times and help other clinicians monitor patient adherence to drug prescription recommendations. In addition, the microextraction technique consumes less solvent and energy; therefore, this method is considered to be an eco-friendly method. Moreover, this method can be applied to simultaneous analysis of the NOACs, and their metabolites in urine and blood samples in our upcoming studies to understand the metabolic mechanisms better.
Acknowledgments
This work was supported by grants from Kaohsiung Medical University Hospital (KMUH108-8R71), Kaohsiung Medical University Research Center Grant (KMU-TC108A01), Ministry of Science and Technology (MOST 106-2632-B-037-001-; MOST 106-2314-B-037-030-MY3 & MOST 110-2113-M-037-009-). The authors extend their appreciation to the Researchers Supporting Project number (RSP-2021/20), King Saud University, Riyadh, Saudi Arabia.
Declaration of Competing Interest
The authors declare that they have no known competing financial interests or personal relationships that could have appeared to influence the work reported in this paper.
References
- The role of the laboratory in treatment with new oral anticoagulants. J. Thromb. Haemostasis. 2013;11:122-128.
- [Google Scholar]
- Validation of an LC–MS/MS method for the simultaneous quantification of dabigatran, rivaroxaban and apixaban in human plasma. Bioanalysis. 2016;8(4):275-283.
- [Google Scholar]
- Rapid determination of triclosan in personal care products using new in-tube based ultrasound-assisted salt-induced liquid–liquid microextraction coupled with high performance liquid chromatography-ultraviolet detection. Anal. Chim. Acta. 2013;767:81-87.
- [Google Scholar]
- Ultrasound-assisted emulsification microextraction for rapid determination of unmetabolized synthetic polycyclic and nitro-aromatic musks in human urine. J. Chromatogr. B. 2018;1092:440-446.
- [Google Scholar]
- Rapid determination of apixaban concentration in human plasma by liquid chromatography/tandem mass spectrometry: application to pharmacokinetic study. J. Pharm. Biomed. Anal.. 2013;78-79:150-153.
- [Google Scholar]
- Determination of rivaroxaban in patient’s plasma samples by anti-Xa chromogenic test associated to High Performance Liquid Chromatography tandem Mass Spectrometry (HPLC-MS/MS) PLoS ONE. 2017;12(2):e0171272.
- [Google Scholar]
- Comparative pharmacodynamics and pharmacokinetics of oral direct thrombin and factor Xa inhibitors in development. Clin. Pharmacokinet.. 2009;48:1-22.
- [Google Scholar]
- Low-density solvent-based dispersive liquid–liquid microextraction followed by high performance liquid chromatography for determination of warfarin in human plasma. J. Chromatogr. B. 2012;899:66-71.
- [Google Scholar]
- Importance of pharmacokinetic profile and variability as determinants of dose and response to dabigatran, rivaroxaban, and apixaban. Can. J. Cardiol.. 2013;29(7):S24-S33.
- [Google Scholar]
- Determination of amoxapine and nortriptyline in blood plasma and serum by salt-assisted liquid–liquid microextraction and high-performance liquid chromatography. J. Sep. Sci.. 2010;33(23-24):3774-3780.
- [Google Scholar]
- Development of a simple device for dispersive liquid–liquid microextraction with lighter than water organic solvents: isolation and enrichment of glycyrrhizic acid from licorice. Anal. Chim. Acta. 2009;655(1-2):60-65.
- [Google Scholar]
- Pharmacokinetic and pharmacodynamic drug interactions with new oral anticoagulants: what do they mean for patients with atrial fibrillation? Ann. Pharmacother.. 2013;47(11):1478-1487.
- [Google Scholar]
- A validated high-throughput UHPLC-MS/MS assay for accurate determination of rivaroxaban in plasma sample. J. Thromb. Thrombolysis. 2015;39(1):79-88.
- [Google Scholar]
- Simultaneous determination of rivaroxaban and dabigatran levels in human plasma by high-performance liquid chromatography–tandem mass spectrometry. J. Pharm. Biomed. Anal.. 2014;100:230-235.
- [Google Scholar]
- Improving medication safety by cloud technology: progression and value-added applications in Taiwan. Int. J. Med. Inform.. 2019;126:65-71.
- [Google Scholar]
- Rapid and sensitive analytical procedure for biomonitoring of organophosphate pesticide metabolites in human urine samples using a vortex-assisted salt-induced liquid–liquid microextraction technique coupled with ultra-high-performance liquid chromatography/tandem mass spectrometry. Rapid Commun. Mass Spectrom.. 2020;34(S1)
- [CrossRef] [Google Scholar]
- Determination of rivaroxaban–a novel, oral, direct Factor Xa inhibitor–in human plasma by high-performance liquid chromatography–tandem mass spectrometry. J. Chromatogr. B. 2008;872(1-2):43-50.
- [Google Scholar]
- Application of hollow fiber liquid phase microextraction and dispersive liquid–liquid microextraction techniques in analytical toxicology. J. Food Drug Anal.. 2016;24(2):264-276.
- [Google Scholar]
- Drug interactions with new oral anticoagulants in elderly patients. Expert Rev. Clin. Phar.. 2017;10(11):1191-1202.
- [Google Scholar]
- Determination of Apixaban Levels in Human Plasma by a High-Throughput Liquid Chromatographic Tandem Mass Spectrometry Assay/Determinarea rapidă a apixabanului în plasma umană prin cromatografie de lichide de înaltă performanță cuplată cu spectrometrie de masă în tandem. Rev. Rom. Med. Lab.. 2015;23:115-125.
- [Google Scholar]
- Paramagnetic micro-particles as a tool for rapid quantification of apixaban, dabigatran, edoxaban and rivaroxaban in human plasma by UHPLC-MS/MS. Clin. Chem. Lab. Med.. 2017;55:1349-1359.
- [Google Scholar]
Appendix A
Supplementary data
Supplementary data to this article can be found online at https://doi.org/10.1016/j.jksus.2021.101602.
Appendix A
Supplementary data
The following are the Supplementary data to this article:


