

Translate this page into:
Quantum chemical calculations, spectroscopic properties and molecular docking studies of a novel piperazine derivative
⁎Corresponding authors. issaoui_noureddine@yahoo.fr (Noureddine Issaoui), omar@ksu.edu.sa (Omar Al-Dossary)
-
Received: ,
Accepted: ,
This article was originally published by Elsevier and was migrated to Scientific Scholar after the change of Publisher.
Peer review under responsibility of King Saud University.
Abstract
Abstract
This work is devoted to investigating the molecular geometry, biological activities, electronic and vibrational characteristics of 1-phenylpiperazin-1,4-diium nitrate monohydrate (1PPNO3) by combining quantum chemical calculations with molecular docking. The geometric structure has been optimized with the Density functional theory (DFT) method using B3LYP-D and WB97XD functional. By referring to the values of the RMSD, the DFT calculation reproduces well the bonds lengths and the angles. Atoms-in-molecules, reduced density gradient and electron localization function analyses have been carried out to study the intra and intermolecular interactions within molecule, in particular to study the properties of hydrogen bonds. NBO orbital analysis has been reported to study electronic exchanges and transfer reactions between donor and acceptor compounds. In addition, Hirshfeld Surface Analysis (HS) was evaluated in order to discern the interactions in the crystal structure. The molecular electrostatic potential was calculated to identify the electrophilic and nucleophilic sites which favor the formation of hydrogen bonds. Inhibitor characteristics of 1PPNO3 on Kalirin-7 and monoamine oxidase B enzymes with several selective inhibitors were examined by molecular docking. Finally, thermal (DTA) and thermogravimetric (TG) analyses for the title compound have been conducted and the thermodynamic properties were determined via model chemistry.
Keywords
DFT
AIM
NBO analysis
Hirshfeld surface
Docking calculations
Parkinson

1 Introduction
Alzheimer's and Parkinson diseases are incurable to date, but treatments for the symptoms are available and research continues. These diseases often start between 45 and 70 years of age, where they belong to the class of psychotic disorders. Alzheimer's manifests in the progressive loss of mental function (Alzheimer's Association, 2015). While, Parkinson is a chronic degenerative neurological disease that affects the central nervous system (Saura et al., 1994). In this context, various theoretical studies have shown that the phenylpiperazine derivatives allow treating diseases related to disturbances in the dopaminergic systems like Parkinson (Noureddine et al., 2020a, 2020b) and Alzheimer's disorders (Gray et al., 2019). Also, they exhibit an important effect in the treatment of the cardiovascular and autonomic diseases (Conrado et al., 2008). The utilization of the phenylpiperazine derivatives moiety as a part of ligand system has gained considerable attention in the recent years (Noureddine et al., 2020a, 2020b). The application of phenylpiperazine ligand lies in medical research-complex, since it is considered to be a new class of anthelmintic, promising anticancer and antidepressant agents (Pompeu et al., 2013).
In the present work, we report on Density Functional Theory (DFT) calculations of 1-phenylpiperazin-1,4-diium nitrate monohydrate (abbreviated as 1PPNO3) molecule. Phenylpiperazine consists of a bulky phenyl group attached to one of the nitrogens of piperazine. These two groups are linked with high basic strength. Nitrate is a very important nutrient for plants, algae, and certain photosynthetic bacteria since it is a salt which facilitates the entry of water into the roots of plants (in low doses). The quantum chemical calculations on the structural, electronic and vibrational properties of 1PPNO3 were studied combining available experimental results with theoretical DFT calculations. Currently, the DFT method has been approved as a popular post-HF approach by ab-initio community (Tahenti et al., 2020) and precision with respect to the estimation of a number of molecular properties. DFT is the best method used for the theoretical study of hybrid materials since it gives a good compromise between calculation time and precision of the results. Therefore, the present study aims is to highlight the structural, topological properties, NBO, Mulliken atomic charges, Hirshfeld surface and IR spectroscopic (theoretical and experimental). Moreover, electrostatic potential (MEP), frontier molecular orbitals (FMOs) and their energy gaps have been constructed for understanding the electronic properties, nucleophilic and electrophilic site of the considered compound. Also, thermal behavior and thermodynamic properties have been determined. In addition, a molecular docking analysis was performed whose purpose is to determine the biological activities of 1PPNO3. It is a significant method in molecular modeling applications and drug design.
2 Experimental section
2.1 Synthesis of (C10H16N2)(NO3)2·H2O
The mentioned molecule was prepared by dissolving 0.001 mol of the 1-phenylpiperazine compound in an ethanol–water solution (10 ml of ethanol in 20 ml of water). Thereafter, 0.002 mol of nitric acid was added. Brown monocrystals of (C10H16N2)(NO3)2·H2O of suitable size for a crystallographic study were formed after two days of slow evaporation (at room temperature). The synthesis reaction is as follows: C10H14N2 + 2 HNO3 + H2O → (C10H16N2)(NO3)2·H2O
2.2 Spectroscopic and thermal measurements
The infrared measurements of 1PPNO3 were determined by Perkin Elmer FT-IR Spectrophotometer in the scan region 4000–400 cm−1. It was synthesized by using pellets enclosing the sample in question and KBr as a dispersant with 1.0 cm−1 resolution.
The thermal analyses (DTA/TG and DSC) of 1PPNO3 were performed by means of a multimodule 92 Setaram analyzer with an average heating rate of 5 K/min under an argon atmosphere on a sample of mass m = 11.90 mg for DTA/TG and m = 4.90 mg for DSC
3 Computational details
The quantum chemical calculations of 1-phenylpiperazin-1,4-diium nitrate monohydrate molecule have been performed using density functional theory (DFT) (Sagaama et al., 2020) embedded in Gaussian09 program (Frisch et al., 2009). The optimization of the geometry was carried out using WB97XD (Chai and Head-Gordon, 2008) and B3LYP-D (Becke, 1993; Lee et al., 1988) levels of theory with the standard 6-311++G** basis set. The visualization of the achieved results was effected by the GaussView software (GaussView, 2003). Multiwfn program (Lu and Chen, 2012) was used to determine the topological analysis of non covalent interactions. The Hirshfeld surface was performed by using Crystal explorer 3.1software (Wolff et al., 2012). The electronic properties (frontier molecular orbitals, energy gap…) were calculated using the time-dependent TD-DFT method with 6-311++G** basis set. Docking calculation was carried out using iGEMDOCK program (Yang and Chen, 2004). This latter is based on generic evolutionary method (GA), whose setting is as follows: population size is 800, the number of generations is 80, and the number of solutions is 10. The clear view of the ligand–protein interactions was done by the Discovery Studio Visualizer (Visualizer, 2005). We performed our approach on ten ligands–proteins complexes. The vibrational assignments were carried out using the VEDA4 program (Jamróz, 2004).
4 Results and discussion
4.1 Geometrical structure
The geometric structure of 1-phenylpiperazin-1,4-diium nitrate monohydrate has been optimized with the Density functional theory (DFT) method using B3LYP-D and WB97XD levels of theory with 6-311++G** basis set (Fig. 1). Dispersion parameter is added to account for long range interactions (VDW). It provides energy corrections. The absence of imaginary frequencies confirms that the optimized structure corresponds to the minimum area of potential energy. Results reveal that the global minimum energy obtained by WB97XD is equal to −30945 eV (as seen in Table S1), whereas the value calculated by B3LYP-D was found to be −30955 eV (in the gas phase). In water, the lowest energy value is found also with B3LYP-D (E = −30957 eV). From the obtained energy values, it can be seen that with the functional B3LYP-D, 1PPNO3 is slightly more stable. Otherwise, the dipole moment is in the order of 10.222 D and 10.257 D using B3LYP-D and WB97XD, respectively in the gas. Whereas, when we take into account the solvation (water), we found that the dipole moment value increases (32.112 and 23.140 Debye). This augmentation of the dipole moment promotes the formation of the hydrogen bond interactions. Furthermore, the dipole moment can impact the interaction between the receptor and the ligand.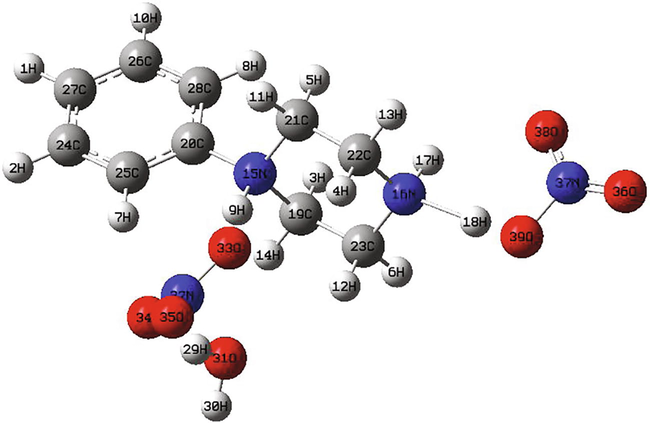
The optimized structure of (C10H16N2)(NO3)2·H2O molecule obtained from WB97XD/6-311++G** in gas phase.
The geometric parameters of 1PPNO3 optimized by the methods B3LYP-D/6-311++G** WB97XD/6-311++G**, compared with the experimental values are listed in Table 1 and S2. These results are discussed in terms of RMSD (Root Mean Square Deviation). The RMSD value is equal to 0.1606 Å using WB97XD and 0.1645 Å using B3LYP-D functional (in the gas phase). As clearly seen, the low RMSD values are noticed by using WB97XD/6-311++G** basis sets. We notice that the value of RMSD decreases in water (RMSDWB97XD = 0.1054 Å; RMSDB3LYP-D = 0.1351 Å). The inspection of this table shows that the calculated distances have provided an excellent agreement with the experimental value based on the value of RMSD. So, from these results we can conclude that WB97XD functional is more reliable than B3LYP-D. We can therefore admit that this method has well optimized the geometry of the determined structural model. Thereby, we continue our calculation by WB97XD functional at 6-311++G** level of theory.
Calculated
Experimental
B3LYP-D/6-311++G**
WB97XD/6-311++G**
Gas
Water
Gas
Water
H1-C27
1.084
1.084
1.084
1.084
0.94 (4)
H2-C24
1.083
1.084
1.083
1.083
1.04 (4)
H3-C19
1.093
1.09
1.094
1.091
0.89 (3)
H4-C22
1.091
1.089
1.092
1.090
0.89 (4)
H5-C21
1.092
1.089
1.093
1.090
0.95 (3)
H6-C23
1.091
1.088
1.091
1.088
0.89 (4)
H7-C25
1.085
1.083
1.086
1.084
0.80 (4)
H8-C28
1.083
1.083
1.084
1.083
0.85
H9-N15
1.076
1.043
1.069
1.052
0.82 (3)
H9-O31
2.955
1.824
2.849
1.732
1.94
H10-C26
1.084
1.083
1.083
1.084
0.91 (5)
H11-C21
1.09
1.088
1.090
1.088
0.94 (4)
H12-C23
1.092
1.09
1.093
1.09
0.92 (4)
H13-C22
1.092
1.089
1.091
1.088
1.01 (3)
H14-C19
1.088
1.087
1.089
1.089
0.97 (3)
N15-C19
1.512
1.514
1.500
1.500
1.514 (4)
N15-C20
1.475
1.478
1.468
1.470
1.496 (4)
N15-C21
1.511
1.515
1.499
1.499
1.496
N16-H17
1.019
1.025
1.018
1.023
0.900
N16-H18
1.604
1.048
1.620
1.045
0.900
N16-C22
1.472
1.496
1.464
1.488
1.480 (4)
N16-C23
1.477
1.499
1.468
1.487
1.479 (4)
H18-O39
1.040
1.732
1.029
1.743
1.9189
C19-C23
1.523
1.516
1.519
1.512
1.488 (5)
C20-C25
1.39
1.389
1.386
1.386
1.372 (6)
C20-C28
1.393
1.391
1.389
1.387
1.351 (5)
C21-C22
1.531
1.517
1.526
1.512
1.515 (5)
C24-C25
1.395
1.394
1.391
1.390
1.385 (6)
C24-C27
1.393
1.394
1.388
1.390
1.356 (6)
C26-C27
1.395
1.396
1.391
1.391
1.368 (8)
C26-C28
1.392
1.393
1.388
1.39
1.393 (6)
H29-O31
0.981
0.976
0.977
0.977
0.86 (1)
H29-O33
2.786
1.862
2.744
2.699
2.24
H29-O34
1.776
0.965
1.772
1.818
2.124
H30-O31
0.961
1.263
0.957
0.962
0.86 (3)
N32-O33
1.291
1.258
1.279
1.243
1.218 (6)
N32-O34
1.264
1.247
1.254
1.256
1.205 (6)
N32-O35
1.218
1.248
1.21
1.242
1.194 (7)
O36-N37
1.202
1.252
1.195
1.239
1.236 (4)
N37-O38
1.227
1.271
1.219
1.242
1.229 (5)
N37-O39
1.368
1.084
1.349
1.260
1.242 (4)
RMSD
0.164
0.135
0.161
0.105
–
Indeed, a phenylpiperazine molecule consists of an aromatic ring which is phenyl (–C6H5) linked to one of the nitrogen atoms of piperazine ring (C4H10N2) which is perpendicular to phenyl group. This compound has been utilized as a ligand in several complexes (Gatfaoui et al., 2020, 2014). The calculated bond lengths of the phenyl ring (C–C) vary between 1.3857 Å and 1.3908 Å (Table 1). Also, two independent nitrates (NO3 groups exist in our molecule. This group consists of one nitrogen and three oxygen atoms, which form a plane; the average deviation from its mean plane is ±0.000000 Å. These two nitrate groups are attached to each other via the water molecule through hydrogen bonds (as shown in Fig. S1). By examining the interatomic distances between the different entities, we can determine the geometric characteristics of the hydrogen bonds. Results reveal several types of interactions: the O – H… O interaction which establish the links between the water molecules and the nitrate ions. From the determined values of the bond distance O–H and the bond angles O–H…O, we can see that our compound has medium strong hydrogen bonds. Also, N–H… O bond ranging from 2743 to 3180 Å which ensure the anchoring of organic molecules to the group [(NO3)2·H2O]. C–H… O interaction with the donor–acceptor distances varying between 3.198 and 3.415 Å relatively long in comparison with those of type O (N)… O.
4.2 Topological analysis
This work reviews the most essential contributions to the study of the localization of electrons performed by using the Atoms In Molecules theory and the Electron Localization Function. We will discuss the most pertinent applications of the AIM and ELF examining to the study of the chemical bond and electronic structure.
4.2.1 AIM analysis
AIM theory, developed by R. Bader (Bader and Austen, 1997), is a reliable method of analyzing intra and inter interactions, particularly the hydrogen bonding interactions. It gives a fairly simple description of the atom and the bond by using topological parameters which are determined at each bond critical points (BCPs) (Ben Issa et al., 2020; Ghalla et al., 2018). The electronic density ρ(r) and its Laplacian ∇ρ(r) are the most important topological parameters. The topological analysis of the density makes it possible to give a description on the bond, the electronic structure, the reactivity, etc…. The AIM calculation was carried out using Multiwfn program. Fig. S2 shows the graphical representation of critical points of 1PPNO3 molecule. The topological analysis display the existence of four ring critical points (RCPs) and six bond critical points (BCPs). From the topological parameters (electron density ρ(r), Laplacian ∇ρ(r), eigenvalues (λ1, λ2, λ3) total energy densities H(r), kinetic energy densities G(r), potential V(r) and the bond energy E(r)) listed in Table 2, it is observed that the total electron density ρ(r) occupy the range of 0.0104–0.0658 a.u and the Laplacian varies between 0.0395 a.u and 0.1460 a.u. The sum of the three eigenvalues of the electron density defines its Laplacian. As shown the Laplacian values of electron density are all positive, which indicates charge depletion. In this context, Koch and Popelier (Koch and Popelier, 1995) have proposed criteria to show the existence of a hydrogen bond among which: the presence of a critical point between the hydrogen atom of the donor group and the acceptor group confirms the presence of a bond hydrogen.
Interactions
ρ (r)
∇2 ρ (r)
H
G
V
λ1λ
λ2
λ3
Ebond kJ.mol−1
ELF
RCP1
0.0218
0.1600
0.0075
0.0324
−0.0248
0.0870
0.0898
−0.0169
–
0.0222
RCP2
0.0191
0.1180
0.0054
0.0241
−0.0187
0.0601
−0.0157
0.0736
–
0.0261
NRCP1
0.0081
0.0395
0.0017
0.0081
−0.0063
0.0335
0.0113
−0.0053
–
0.0132
NRCP2
0.0021
0.0114
0.0007
0.0021
−0.0014
−0.0072
0.0038
0.0083
–
0.0022
N16…H18-O39
0.0658
0.0889
−0.0198
0.0421
−0.0620
0.3346
−0.1236
−0.1220
81.39
0.3484
O31…H14-C19
0.0155
0.0566
0.0021
0.0119
−0.0098
−0.0153
0.0895
−0.0176
12.86
0.0505
O34…H29-O31
0.0322
0.1153
0.0010
0.0278
−0.0267
−0.0489
−0.0461
0.2103
35.05
0.1020
O34…H7-C25
0.0146
0.0468
0.0014
0.0102
−0.0087
−0.0148
0.0775
−0.0159
11.42
0.0569
O33…H9-N15
0.0658
0.1460
−0.0154
0.0519
−0.0673
−0.1295
0.3999
−0.1243
88.35
0.2601
O33…H4-C22
0.0104
0.0395
0.0015
0.0083
−0.0068
0.0566
−0.0078
−0.0092
8.93
0.0284
To determine the energy values of intermolecular H-bonds, Espinosa and al. (Espinosa and Molins, 1998) developed the equation E = 1/2[V (BCP)], which demonstrate that a potential V(r) increase leads to H-bonds strengthening. Based on the AIM analysis, six hydrogen bonds were detected which are: N16…H18-O39, O31…H14-C19, O34…H29-O31, O34…H7-C25, O33…H9-N15 and O33…H4-C22. The energy values of these bonds range between 8.93 kJ.mol−1 and 88.35 kJ.mol−1. It is seen that the value of the electron density for N16…H18-O39 and O33…H9-N15 interactions does not belong to the Koch and Popelier interval, which states ρ(r) and ∇ρ(r) must be in between [0,0020–0,0400 a.u] and in [0,0240–0,1390 a.u], respectively. This can be justified by the presence of remarkably strong H-bonds interactions. Likewise with the values of their energies, we can notice that these two H-bonds are strong (E(N16…H18-O39) = 81.39 kJ.mol−1; E(O33…H9-N15) = 88.35 kJ.mol−1), which gives preliminary evidence that the electron density and its Laplacian are linked to the strength of hydrogen bonding.
4.2.2 Analysis of the electron localization function
The electron localization function (ELF) was introduced by Becke and Edgecombe (Becke and Edgecombe, 1990) to describe the chemical bond for approximately all classes of compounds. The topological analysis of the ELF function allows a partition of the molecular space not in atomic basin as in Bader's theory, or in regions of charge concentration, but in basins of electronic localization within which the excess of kinetic energy due to Pauli repulsion is minimum. This approach is capable of generating easily understandable images. Its graphed language earns it to determine the nature chemical bond. ELF gives very meaningful, easily comprehensible, and visually informative patterns of the chemical bonds. The 2D representation of the ELF isosurface for 1PPNO3 compound has been carried out using Multiwfn program. This function can be projected on to a very precise plane of the crystal structure considered. Fig. 2 shows the evolution of ELF along the molecular axis for N15, N16, N37 atoms. Another ELF surface map, on the plane of O31, N16, O36 atoms, is plotted as shown in supplementary Fig. S3-a. The dashed lines show the regions that have decrease in electron density, while Fig. S3-b represents a colored ELF map. The blue color circle and particularly dark blue circle represent a depletion region between inner shell and valence shell. As it is shown, the carbon and the hydrogen regions have the minimum values of the localized orbital locator. A strong electronic localization is seen around the oxygen atoms (red and orange color) (Fig. S4).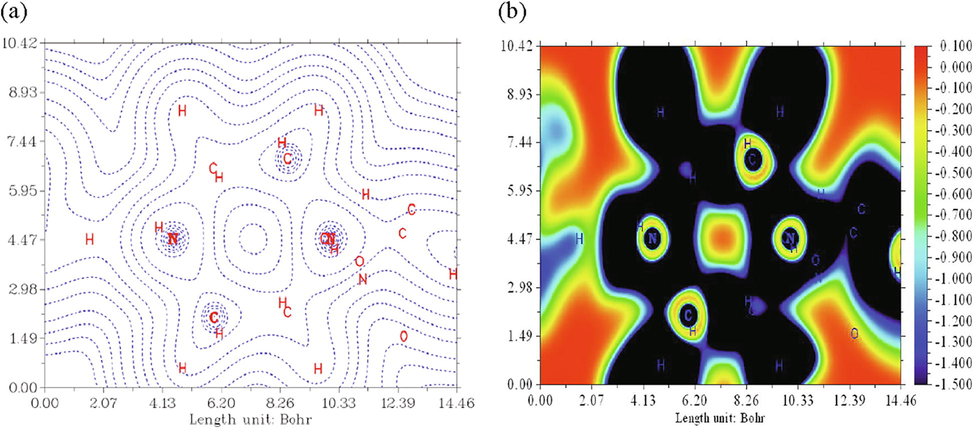
Electron localization function (ELF) maps of 1PPNO3 along the molecular axis for N15, N16, N37 atoms compound.
4.2.3 NCI-RDG analysis
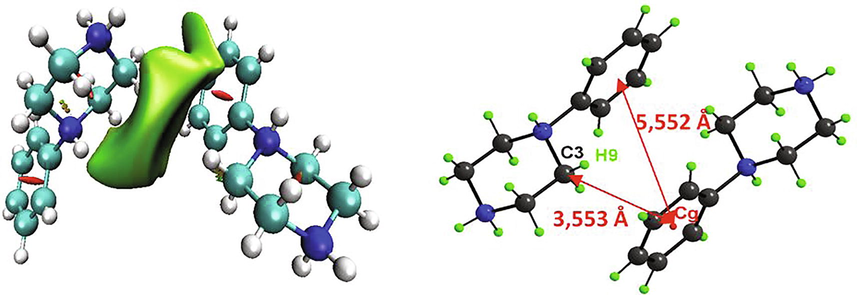
Reduced density gradient (RDG) is an approach to determine the nature of interactions, in particular non-covalent interactions (NCI). Owing to their important properties, NCI have attracted growing attention. Intermolecular interactions make it possible to understand how the molecules interacted and constitute biological organisms. It allows a description of H-bond, steric effect and van der Waals interactions. In Fig. 3, we present the classification of the different interactions of 1PPNO3 compound, by giving a simple color code to distinguish between the different regions. The results were carried out and plotted by using Multiwfn and VMD programs. Fig. 3a illustrates the evolution of the RDG (a.u) as a function of the product sign of λ2 time’s density (ρ). λ2 represent the greatest eigenvalue of Hessian matrix. It characterizes the fluctuation of the electron density near the critical point. With the signλ2 * ρ, we can discriminate between the three regions. So, we have tried to understand the nature of strength of the different interactions presenting in our compound. The strength and type of bond are related to the values of electron density and the Laplacian sign of electron density at critical points. Blue, red and green color codes are utilized to describe stabilizing H-bond, destabilizing steric and VDW interactions, respectively. As shown, the regions corresponding to the hydrogen bond (weak interaction) and the steric effect have a high density, while the van der Waals interaction zones have a low density. As clearly seen, these interactions appear as regions marked respectively by blue, red and green colors (Fig. 3b). A clear blue spot is checked between the hydrogen–oxygen- and the hydrogen–nitrogen atoms, which indicate the strong attractive interactions O…H–N and N…H–O (Table 2). The elliptic red plate situated at the center of the two rings is attributed to describe destabilizing steric interaction. The green plates indicate the weak interaction region situated between the hydrogen atoms, which is associated to VDW interactions. The graphical visualization of the NCI between two organic cations involved in a CH/π bond is given in Fig. 4. The benzene cycle of the phenylpiperazine cation is perfectly planar, since its average deviation from its mean plane is ±0.000311 Å. The two anti-parallel benzene rings are separated by a distance equal to 5.552 Å, which is fairly long to generate π-π interactions. But, between the two organic groups we notice the existence of CH/π interaction. If we compare this distance with the distances found in my previous work, where we studied two other phenylpiperazine derivatives “1-phenylpiperazine-1,4-diium bis(hydrogen sulfate)” (Noureddine et al., 2020a) and “4-phenylpiperazine-1-ium dihydrogen phosphate” (Noureddine et al., 2020b), we find that d1PPNO3 = 5.552 Å> d4PPHP = 4.870 Å> d1PPHS = 3.985 Å.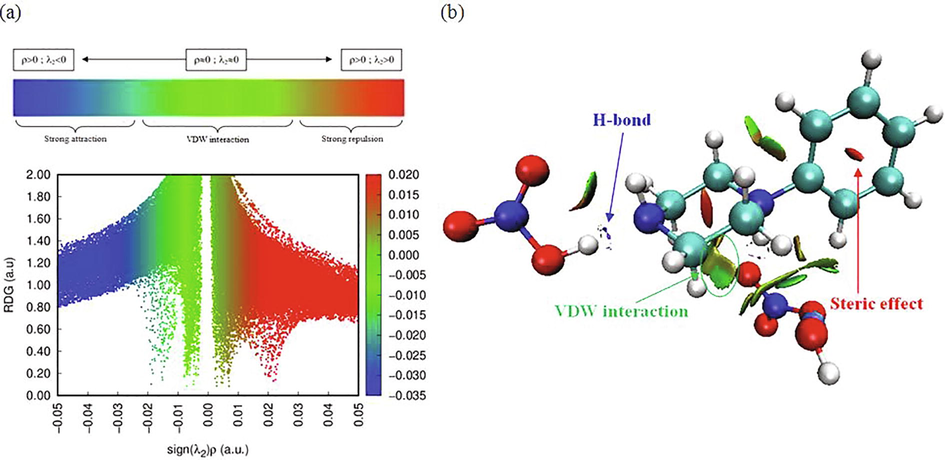
Classification of the different interactions of 1PPNO3.
Different interactions between two organic cations involved in a CH/π bond.
4.3 NBO and Mulliken charges analysis
Natural Bond Orbital (NBO) analysis is deemed as one of the most prevalent methods for examining the electronic transitions and the mutual interactions in molecular systems, especially for studying intra and intermolecular hydrogen bonding. Therefore, the interacting stabilization energy E(2) is the most essential parameter to study the interactions between electron donors and acceptors.
qi: represents the occupation of the donor orbital; F (i, j): represents the operator of Fock and εi, εj: represent the energies of the NBO orbitals.
NBO analysis has been performed by using WB97XD/6-311++G** level of theory to better understand the interaction within 1PPNO3 molecule. It gives much information about the nature and strength of interactions. Table 3 groups the energy values for the significant donor acceptor interactions. The increase in stabilization energy E(2) generates the increase in electron donor–acceptor interactions (Tahenti et al., 2020). Results reveals that the bonding orbital σ → the anti- bonding orbital σ* interaction has a smaller E(2) than that of π → π* and the lone pairs LP → σ*. It is varied between 0.72 kcal/mol and 6.44 kcal/mol. The intra molecular interactions of σ(C20-C25) to σ*(H7-C25; σ(C24-C25) to σ*(H7-C25) and of σ(C26-C28) to σ*(N15-C20) leads to large stabilization of 6.38, 6.23 and 6.44 KJ/mol, respectively. The strong interaction of the LP to the anti-bonding orbital of the ring conducts to stabilization of some part of the ring as shown in Table 3. The stabilization energy between LP*(O)-σ*(N-O) roughly equal to 17.29 kcal/mol. Also, it can be seen the existence of strong H-bond interaction between oxygen lone electron pairs LP(2)-O39 and the empty antibonding orbitals σ*(N16-H18). The interacting energy value is obtained as 12.35 kcal/mol. E(2): stabilization energy (in kcal. Mol−1). E(j)-E(i): energy difference between the donor orbital (i) and the acceptor orbital (j). (in u.a). F (i.j): the Fock matrix element (in u.a).
Donor (i)
Acceptor(j)
E(2)a [kcal/mol]
E(j)_E(i)b [a.u.]
F(i.j)c [a.u.]
σ(H2-C24)
σ*(C26-C27)
4.39
1.13
0.063
σ(H8-C28)
σ*(C20-C25)
4.20
1.23
0.064
σ(H12-C23)
σ*(H6-C23)
4.62
1.32
0.070
σ(C20-C25)
σ*(H7-C25)
6.38
1.87
0.098
σ(C20-C28)
σ*(H8-C28)
5.91
1.66
0.089
σ(C24-C25)
σ*(H7-C25)
6.23
1.83
0.096
σ(C24-C25)
σ*(N15-C20)
5.41
0.96
0.065
σ(C24-C25)
σ*(C20-C25)
4.05
1.27
0.064
σ(C26-C28)
σ*(N15-C20)
6.44
0.95
0.070
σ(C26-C28)
σ*(H8-C28)
4.21
1.59
0.073
σ(C24-C27)
σ*(H7-C25)
1.25
1.86
0.043
σ(N16-C23)
σ*(H14-C19)
0.94
1.30
0.031
σ(N15-C21)
σ*(H13-C22)
0.72
1.22
0.027
σ(N15-C21)
σ*(H14-C19)
0.81
1.29
0.029
π(C20-C28)
π*(C24-C25)
18.31
0.33
0.070
π(C20-C28)
π*(C26-C27)
15.29
0.33
0.064
π(C24-C25)
π*(C20-C28)
25.75
0.26
0.074
π(C24-C25)
π*(C26-C27)
21.32
0.29
0.072
π(C26-C27)
π*(C20-C28)
21.82
0.27
0.069
π(C26-C27)
π*(C24-C25)
22.62
0.29
0.073
π(O36-N37)
π*(O36-N37)
14.04
0.35
0.076
LP(1)-O33
σ*(H9-N15)
0.05
1.53
0.008
LP(2)-O31
σ*(H9-N15)
8.44
1.20
0.090
LP(2)-O33
σ*(N32-O34)
14.05
0.76
0.092
LP(2)-O33
σ*(N32-O35)
16.86
0.71
0.099
LP(2)-O34
σ*(N32-O33)
15.30
0.73
0.094
LP(2)-O34
σ*(N32-O35)
18.79
0.70
0.104
LP(2)-O35
σ*(N32-O33)
19.96
0.72
0.107
LP(2)-O35
σ*(N32-O34)
19.27
0.74
0.108
LP(2)-O39
σ*(N16-H18)
12.35
0.86
0.093
LP(2)-O36
σ*(N37-O38)
16.69
0.69
0.096
LP(2)-O36
σ*(N37-O39)
17.47
0.66
0.096
LP(2)-O36
σ*(N37-O39)
17.47
0.66
0.096
Mulliken charges investigation has been developed to describe atomic charges distribution of molecular wave functions. They are principally based on first-order density functions within a LCAO MO approach (Pople and Beveridge, 1970). The atomic charge of the title compound, calculated by B3LYP-D/6-311++G** and WB97XD/6-311++G** level of theory, is tabulated in Table S3. As results, we found that all hydrogen atoms are positively charged. The charges on carbon atoms C19, C21, C22, C23, C24, C26, and C24 are negative, whereas C20 and C25 are positive. Hydrogen H18 has the maximum of positive Mulliken charges. The Highest values of negative charges are located on O31. The existence of substantial negative charges on oxygen atoms indicates that these atoms may have H-bond acceptors.
4.4 Hirshfeld surface investigations
Hirshfeld surfaces analysis (HS) has turn a precious tool for crystallographers, since it identifies each type of intermolecular interaction in the crystal structure. This surface outcome from the partition of the space separating one atom to the rest of the crystal. Hirshfeld surface of the title compound was determined by means of Crystal Explorer 3.1. This study allows a much detailed scrutiny by viewing intermolecular interactions and quantifying them in 2D fingerprint plot (Spackman and McKinnon, 2002). Fig. 5 illustrate the three-dimensional Hirshfeld dnorm (a) surface, Shape Index (a) and Curvedness (c) of (C10H16N2)(NO3)2·H2O molecule. Normalized distance dnorm (varies between −0.5429 and 1.1528) is one way of representing Hirshfeld surfaces. It makes it possible to generate a representation which implies standardized contact distances taking into account the van der Waals radius of the atoms involved in the analysis. Shape index (ranges −1.000 to 1.000) and curvedness (varies between −4.000 and 0.4000) maps can also be used to identify characteristic conditioning patterns existing in the crystal. Each point on the Hirshfeld surfaces can be defined by two distances di (is the distance to the nearest nucleus internal to the surface) and de (is the distance from the point to the nearest nucleus external to the surface). These two distances give a 2D fingerprint plot of inter-molecular interactions in crystals. We estimate in Fig. 6, the percentages of different intermolecular contacts existing in the structure of 1PPNO3 molecule and the 2D fingerprints plots of important contacts. The examination of these figures shows that the principal contributions are from O…H /H…O (59.6%; Fig. 6a) with a maximum de + di ∼ 2.22 Å less than the sum of the van der Waals radii of involved atoms (H: 1.09 Å O: 1.52 Å), H…H (21.6%; Fig. 6b), these inter contacts centered around a sum di + de ∼ 2.4 Å greater than the sum of the van der Waals radii of the hydrogen atoms, H…C/C…H (Fig. 6c) comprise 12.2% of the entire Hirshfeld surface, these contacts represented in the form of two wings located around a sum de + di ∼ 2.8 Å greater than the sum of the van der Waals radii of considered atoms (C: 1.70 Å, H : 1.09 Å). According to this comparison concludes that only the H … O / O … H contacts considered close together they are attributed to the hydrogen bonds N–H … O, O–H … O and C–H … O. The very high percentage of C … H / H … C contacts confirms the presence of C–H … π interactions in the 1PPNO3 material.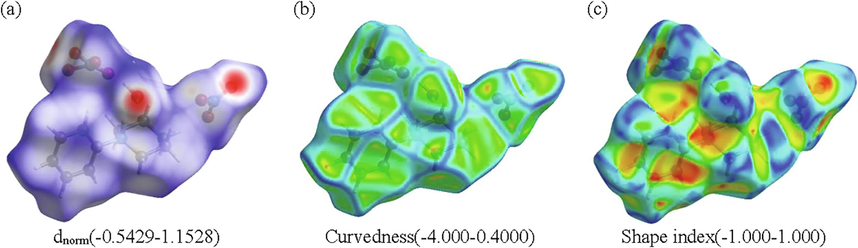
Hirshfeld surfaces plotted with (a) dnorm; (b) curvedness) and (c) shape-index for the title compound.
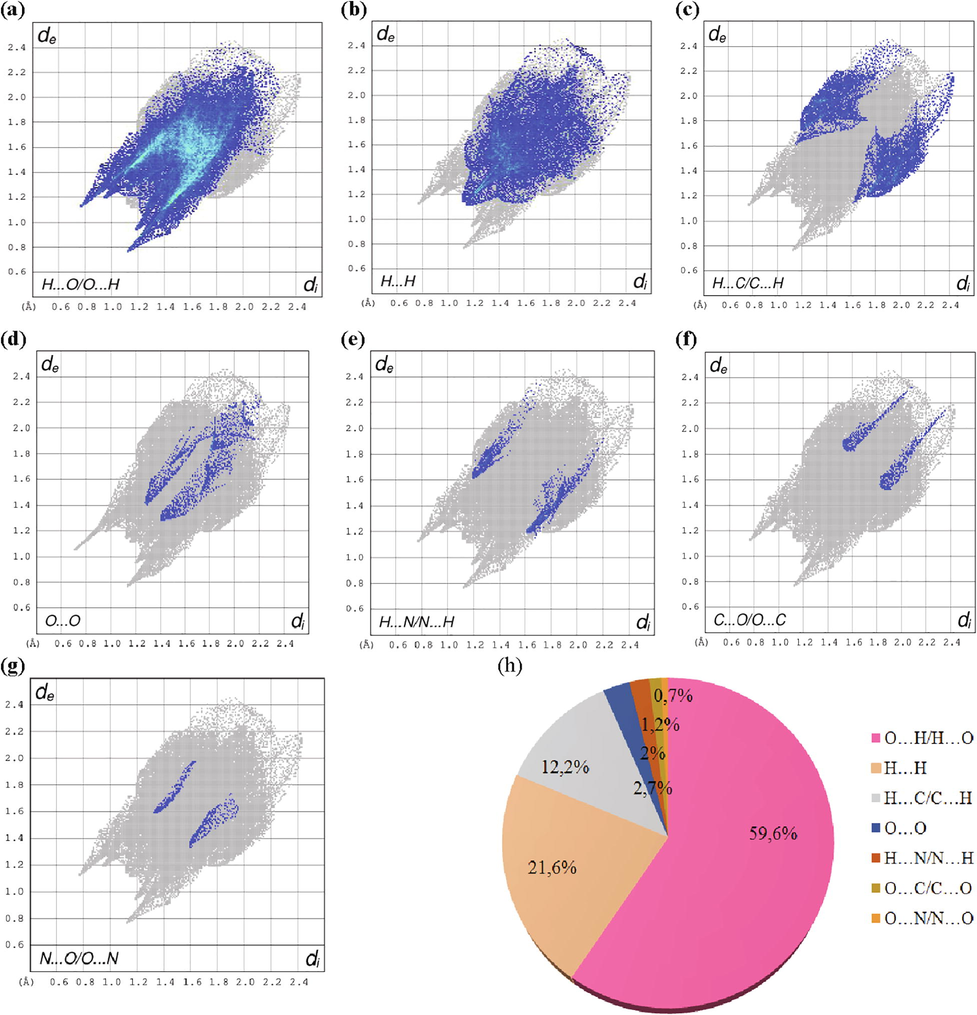
Fingerprint plots of the various intermolecular contacts existing in the Hirshfeld surface of (C10H16N2)(NO3)2·H2O compound.
4.5 MEP analysis
To investigate the chemical reactivity; the nucleophilic and electrophilic sites within molecule, molecular electrostatic potential (MEP) maps were determined using WB97XD/6-311++G** process (Fig. S5). It confirms the positive and the negative potential regions with the total electron density surface. The nucleophilic and electrophilic regions promote the formation of hydrogen bonds. MEP surface was obtained by mapping electrostatic potential to the total electron density in simple color code, where the potential decrease in the order of blue > green > yellow > orange > red. As seen in Fig. S5, the color code is between −6.890.10−2 (red color: corresponds to the potential negative values) and 6.890.10−2 (blue color: corresponds to the potential positive value). The blue color indicates the strong attraction (electrophilic sites) while the red color shows a region of strong repulsion (nucleophilic sites) and the green indicates the neutral zone. It is clear that the oxygen atoms (especially O35 and O34) mainly exhibit a negative charge (red color region). Also, the nitrogen atom N32 is localized in the negative region. Whereas all the hydrogen atoms represent a positive potential value (blue color). Results obtained may justify the presence of hydrogen-bond interactions in the 1PPNO3 molecule.
4.6 HOMO-LUMO molecular orbital study
The electrons transition from the highest occupied molecular orbital (HOMO) to the lowest unoccupied molecular orbital (LUMO) happen liberally when the energy gap is small. LUMO and HOMO are named frontier molecular orbitals (FMOs). The HOMOs are able to denote an electron, while the LUMO is able to accept an electron. These orbitals participate in large part in the chemical stability of the molecule and play an important role in determining its electronic properties (Fukui, 1975). The molecular reactions are permitted if the FMOs are placed in such a way that the lobes of the same sign overlap. The difference between the energy of the HOMO and LUMO orbitals is defined as the gap energy ΔE. This latter reflect the polarizability and chemical activity within a molecule. It promotes the transfer of charges in the molecule. This energy quantity allows characterizing the chemical reactivity and the kinetic stability of the molecule. When the HOMO-LUMO energy gap is high, the flow of electrons at the higher energy state is difficult, making the molecule hard and less reactive. On the other hand, the lower HOMO-LUMO energy gap results in an easy flow of electrons, which makes the molecule soft.
The chemical reactivity behaviors of 1PPNO3 have been carried out via TD-DFT approach. This method display its effectiveness compared to semi-empirical approaches and traditional ab-initio computations. We present, in Fig. 7, the frontier molecular orbitals LUMO and HOMO of the mentioned molecule as well as their calculated gap energies in gas phase and taking into account solvation. The green color corresponds to the negative phase and the red color indicates the positive phase. Results reveal that the HOMO-LUMO energies gap (EHOMO-ELUMO) in gas, water and in methanol is equal to −5.180 eV, −5.190 eV and −5.135 eV, respectively. We can notice that these energies take negative values. This indicates the stability of our compound, although band gap validate the eventual charge transfer interactions. We can conclude that 1PPNO3 is more reactive in ethanol due to its lower value of gap energy
. The Orbital Density Spectrum (DOS) is represented in Fig. S6 using GaussSum software (O'Boyle et al., 2008). These spectra describe the energy levels per unit energy increment and its composition in energy between −15 and 5 eV. Analysis of these figures show that the green and red lines in the DOS spectrum represent the HOMO (EHOMO) and the LUMO (ELUMO) levels, respectively. As predicted, the energies gaps determined by the DOS spectra are compatible with the calculated values. Starting from the energy orbitals, chemical parameters like the chemical potential, the global hardness, the softness and the electrophilicity maximum charge transfer index between the frontier molecular orbital of 1-Phenylpiperazin-1, 4-Diium Nitrate Monohydrate are calculated in different solvents using the TD-B3LYP method (Table 4). These parameters are often determined through Koopmans' theorem (Geerlings et al., 2003). The chemical potential is donated as; μ ≈ 1/2(ELUMO + EHOMO) ≈ 1/2 (I + A), where I and A represent the ionization potential and the electron affinity (I = −EHOMO; A = −ELUMO), respectively. These parameters are found to be −4.889; −3.836 and −3.836 eV in gas; water and methanol, respectively. Similarly, the electro negativity χ can be defined as χ = 1/2(I + A). The global hardness (η) calculated based on the LUMO and HOMO energies: η ≈ (ELUMO − EHOMO) ≈ (I − A). Indeed, we found that the hardness in water (2,595 eV) greater than those obtained in gas and in methanol. Additionally, 1PPNO3 has a softness Swater = 0.192 eV−1 < Sgas = 0.193 eV−1 < Smethanol = 0.194 eV−1.
HOMO and LUMO frontier molecular orbitals of (C10H16N2)(NO3)2·H2O compound by using TD-DFT calculations in methanol (a), in gas phase (b) and in water (c).
DFT/B3LYP/6-311++G(d.p)
Gas
Water
Methanol
EHOMO (eV)
−7.479
−6.431
−6.404
ELUMO (eV)
−2.299
−1.241
−1.269
ΔEHOMO–LUMO gap (eV)
−5.180
−5.190
−5.135
EHOMO–1 (eV)
−7.600
−6.855
−6.830
ELUMO+1 (eV)
−1.639
−1.162
−1.902
ΔE (HOMO–1)–(LUMO+1) gap (eV)
−5.961
−5.693
−4.928
Chemical Potential µ (eV)
−4.889
−3.836
−3.836
Electronegativity χ (eV)
4.889
3.836
3.836
Global hardness η (eV)
2.590
2.595
2.567
Softness S (eV) − 1
0.193
0.192
0.194
Electrophilicity (eV)
4.614
2.835
2.866
Maximum charge transfer index (ΔNmax = –µ/η)
1.887
1.478
1.494
4.7 Docking calculations
In this paper, we have used docking calculations of GDP (5O33), JGA (5QQD), PPHS, 4PPHP, 1PPNO3 ligands with “Kalirin-7” protein and of 1PPNO3, 1-PPHS, 4PPHP, Farnesol (2BK3) and Isatin (2BK5) ligands with “monoamine oxidase B” protein to specify the zone of interactions. Only the ligand is mobile and the flexibility of the protein is not taken into account. It is a technique for describing the molecular docking binding sites available in discovery studio visualizer. This calculation has been used to exhibit how these proteins interact with small molecules (ligand) (Noureddine et al., 2021) for the purpose of prognosticate the most possible of interaction for the efficacy of the drugs. Treatments are determined predicated on the individual’s symptoms and how they react to different medicinal drug. Molecular docking algorithms engender a vast number of incorrect docking poses; we chose the position that has the lowest energy called “the best pose”. To explore how these inhibitors interact with the active sites of two enzymes, we have illustrated in Table 5, the energetic related results of the docking calculations. IGEMDOCK program makes it possible to determine the Van der Waals interactions and the hydrogen bonds which are the most important among the weak bonds. The hydrogen interaction can be constituted by the atom-pair types: donor–acceptor, acceptor–both, donor-both and both–both. If there are other combinations of pairs of atoms, then in this case they must form the steric state. Subsequently, the corresponding docked poses are given in Fig. 8 and different types of interaction between protein-ligands and their available interactions in 2D diagrams are represented in Fig. S7 and S8. As it is shown, the ligand is attached to the receptor by different types of interactions like pi-cation, pi-alkyl, alkyl, pi-sigma, pi-anion, amide pi-stacked, pi-sulfur, attractive charge, salt bridge, acceptor–acceptor, conventional hydrogen bonding, carbon-hydrogen bond, etc…
Kalirin-7
Ligands
GDP
1PPNO3
JGA
1-PPHS
4PPHP
Total energy
−92.939
−90.762
−75.021
−57.544
−53.219
VDW
−62.251
−40.910
−53.156
−38.324
−46.724
H-bond
−27.478
−47.550
−21.865
−19.219
−6.495
Electronic
−3.209
−2.301
0
0
0
Affinity
−7.0
−1.5
−5.0
−3.6
−3.5
MAOB
Ligands
1PPNO3
1-PPHS
Farnesol
4PPHP
Isatin
Total energy
−106.944
−97.845
−92.493
−83.580
−73.108
VDW
−60.141
−93.000
−86.535
−76.580
−59.112
H-bond
−46.812
−3.500
−5.958
−7.000
−13.996
Electronic
0.008
−1.345
0
0
0
Affinity
−1.9
−3.3
−4.4
−3.7
−6.7
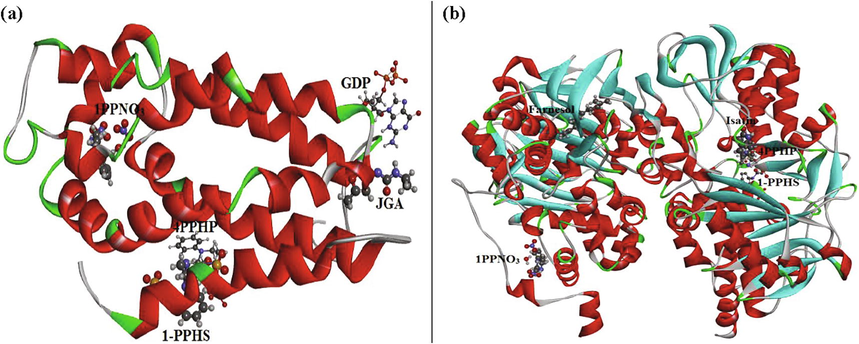
Best docked poses of GDP, 1PPNO3, JGA. 1-PPHS. 4PPHP ligands inside Kalirin-7 protein (A); and of 1PPNO3, 1-PPHS, Farnesol, 4PPHP, Isatin ligands inside the MAOB protein (B) in 3D views.
Starting with Kalirin receptor (well-known as Huntingtin-associated protein-interacting protein (HAPIP)), which is a protein determined in 1997, interacting with huntingtin-associated protein 1. It helps in nerve growth and axonal development. Kalirin-7 is one of their isoforms; it has been informed that this protein is closely correlated with the development of Schizophrenia and Alzheimer's diseases. The examination of Table 5 revealed that the GDP ligand possessed agreeable total energy score (−92.939 kcal/mol) with the target protein Kalirin-7. This high total energy demonstrates that the ligand interacted powerfully with the receptor. Also, it has the highest VDW interaction with a value of −62.251 kcal/mol. Visual inspection of the 2D representations of GDP ligand reveals that the following atoms: N2, O2, N4 and O11 are linked to A:GLU14, A:GLU83, A:GLU84 and A:LYS12 binding residues respectively via conventional hydrogen bond interactions, with a range of distances varies between 2.40 and 2.96 Å (as clearly seen in Table S4). A:LYS13 form a pi-cation interaction with the pyrimidine ring and a pi-alkyl interaction with the imidazoline group indicating bond lengths 3.19 and 4.36 Å, respectively. In addition, the oxygen atoms O6, O9, O10 also exhibit a pi-cation interaction with A:LYS13 residues with distances 3.04, 1.96 and 2.16 Å. Thereafter, we find our present compound 1PPNO3 with such an important energy of the order of −90.762 kcal/mol and a VDW interaction equal to −40.910 kcal/mol. The docking pose of this complex showed that the benzene ring of 1PPNO3 molecule is oriented with two pi-alkyl interactions surrounded by the chains of A:ILE117 and A:ILE138 residues with bond lengths values 4.50 and 4.91 Å. The amino residues A:GLY122 and A:THR123 form 2 carbon-bond interactions with C19 and C23, having distances 3.63 and 3.21 Å. Subsequently, two conventional hydrogen bonds were being formed with the following amino acids: A:THR123 and A:GLN129. The JGA molecule has a lower energy than the two ligands mentioned (-75.021 kcal/mol) and the last two ligands (1-PPHS, 4PPHP) have weaker energies than the other complexes but as even remain important. In order to improve the recognition of the interactions which exist between proteins and ligands, we determined the affinities of these complexes by using AutoDockTools (ADT) (Morris et al., 2008). This affinity makes it possible to describe the strength of a non-covalent interaction between the protein and the ligand which binds to a site on its surface. It is based on the number and nature of the physicochemical interactions between the ligand and its target. From Table 5, it is observed that the affinities values (in ultimate value) are in the order of 7.0 > 5.0 > 3.6 > 3.5 > 1.5 kcal/mol for GDP, JGA, 1-PPHS, 4PPHP and 1PPNO3, respectively.
After the analysis of the best docking positions presented in Fig. 8, we can be concluded that the studied compounds are bound mainly by the many non-covalent interactions at the active site of the receptor. Recall that, most of the molecular docking methods are paying attention on effective prediction of the binding mode of non-covalent inhibitors in so-called reversible inhibition. Covalent inhibition is a strategy that is used to achieve irreversible inhibition. Covalent inhibitors possess some significant advantages over non-covalent inhibitors such as stronger binding affinity with the receptors because of the covalent linkage formed between the ligand (electrophilic) and the target (nucleophilic), stronger potency and prolonged duration of the biological effect of a ligand. The distribution of negative charges along the 1PPNO3 ligand indicates that it has a nucleophilic character. Therefore, the explanation for the non-covalent bond of this compound lies in their charge distribution and the methodology applied.
Now going to the second MAO-B protein, it represents a group of oxidoreductases involved in thrombocytes and chromaffin cells. It is found in neurons and astrocytes. The dysfunction of this protein is responsible for several neurological disorders, because of its vital role in the inactivation of neurotransmitters. Parkinson's and Alzheimer's diseases are both linked with high levels of MAO-B in the brain. Adding a MAO-B inhibitor slows the breakdown of dopamine in the brain. Among the five inhibitors tested, our compound 1PPNO3 displayed better inhibition when compared with others. It is found to form the most stable protein–ligand complex since it has the best inhibitory effect with a total energy equal to −106.944 kcal/mol. It has a significant VDW interaction of value equal to −60.141 kcal/mol; moreover it has the strongest hydrogen bond of the order of −46.812 kcal/mol. Calculations show that for MAOB-1PPNO3 complexes, B:THR195 and B:THR196 residues formed conventional H-bond interactions with O5 and O6 atoms having distances 2.65 and 2.54 Å. The oxygen atom O3 exhibit an attractive charge with B:ASP124 amino acids residues (4.28 Å) and a salt bridge with B:ARG127 (2.86 Å) (as illustrated in Table S3). Likewise 1-PPHS and Farnesol ligands have a good binding interaction with MAOB protein and it exhibited the total energy scores of −97.845 and −92.493 kcal/mol, respectively. Their VDW interactions are found to be −93.000 and −86.535 kcal/mol. As seen, several types of interactions appear in the 1-PPHS/MAOB complex as attractive charge, pi-alkyl, pi-sigma, pi-anion, pi-sulfur…, whose distances vary between 3.06 and 5.42 Å. We find also that the 4PPHP molecule interact well than Isatin with the receptor, indicating total energy score of −83.580 kcal/mol, EVDW = −76.580 kcal/mol and EH-bond = −7.000 kcal/mol. All those complexes present weaker affinities −1.9 kcal/mol (for 1PPNO3), −3.3 kcal/mol (1-PPHS), −4.4 kcal/mol (Farnesol), −3.7 kcal/mol (4PPHP) and −6.7 kcal/mol (for Isatin ligand).
The results obtained during our study reveal that the phenylpiperazine derivatives (1PPNO3, 1-PPHS and 4PPHP) penetrates well into the active site of the two enzymes, so we can consider it as potent inhibitors of Parkinson, Schizophrenia and Alzheimer's disorders.
4.8 Thermal analysis
Thermal analysis methods (DTA, TGA and DSC) aim to study the transformations that affect the structure of solid materials when the temperature is varied. These methods are complementary to X thermal diffraction. Differential thermal analysis (DTA) is a very simple technique for monitoring the endothermic and exothermic phenomena that take place during a reaction. Thermogravimetric analysis (TGA) allows studying variations in the mass of samples, when they are subjected to a variation in temperature under a monitored atmosphere. Whereas, Differential Scanning Calorimetry (DSC) is a technique for measuring the differences in heat exchange between the sample and the reference (thermally inert material). The differential and thermogravimetric thermal analysis of 1PPNO3 (Fig. 9a) is carried in temperature range (ambient temperature to 723 K) on a mass sample is equal to 11.90 mg with a heating rate of 5 K. min−1 and under an argon atmosphere. DTA curve presents a fine and very intense exothermic peak at 396 K accompanied by a small loss of mass on the TG curve, this thermal transformation corresponds to the first stage of decomposition and elimination of a water molecule. A second endothermic peak appears around 438 K without loss of mass is attributed to a phenomenon of fusion during which our material loses its crystalline state and passes to the liquid state, this phenomenon is further confirmed by heating our compound on a Kofler bench which allows us to estimate the melting temperature of a material, this temperature (440 K) is close to that observed on DTA curve. Finally a series of peaks located respectively at 552, 554 and 560 K accompanied by a very large loss of mass relative to the rest of decomposition mechanism. During this decomposition stage, a transfer of protons between the cationic part and anionic part at high temperatures which leads to an internal redox reaction between the amine and nitric acid, and various other reactions can suppose, which leads to the ignition of the material (Gatfaoui et al., 2019). The transfer of protons to the NO3− anions is due to the weakening of the N–H bonds at high temperatures in the condensed phase.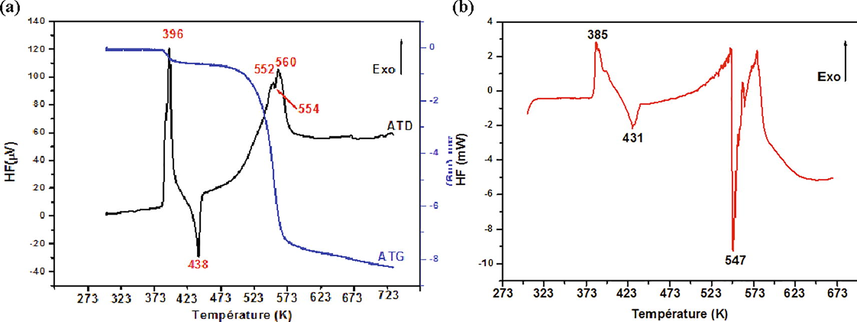
DTA, TGA (A) and DSC (B) thermograms of 1PPNO3 molecule.
The differential enthalpy analysis (DSC) of 1PPNO3, is carried out in the temperature range from 303 to 673 K with a speed equal 5 K. min−1, on a sample of mass m = 4.90 mg, under an atmosphere of argon. The curve obtained (Fig. 9b) shows the presence of an exothermic peak at 385 K indicating dehydration and decomposition and an endothermic peak at 392 K corresponding to the fusion of the remaining compound, observed in thermal and thermogravimetric analyzes differential in the same temperature range with ΔHfusion = 11.51 kJ.mol−1. A second very fine endothermic peak at 547 K is observed on the DSC curve. The same peak is observed on the DTA curve but with a very low intensity, the accuracy of the DSC compared to the DTA is may be due to the small mass of the sample used since the two analyzes are performed with the same speed.
4.9 Thermodynamic properties
The thermodynamic functions provide a diversity of formula that reveals many properties of the compounds. Among the most important properties, we can mention: the entropy S; the heat capacity Cp and the enthalpy H. All these thermodynamic properties strongly depend on the temperature and they are determined from the theoretical frequencies by using a Perl script “thermo.pl” (NIST) on various ranges of temperature (100–1000 K) and at atmospheric pressure are illustrated in Table S5. Note that generally these thermodynamic calculations can only be done in the gas phase and not in solution. The variations of the parameters as a function of the temperature are illustrated in Fig. S9. As clearly seen, the thermodynamic properties are increasing with temperature, since the vibrational intensities increase when the temperature increases. The correlation between these parameters with temperatures is an integrated quadratic formula. The corresponding fitting factors R2 are equal to 0.9990, 0.9900 and 0.9990, respectively and adjusted by the following quadratic formulas:
The thermodynamic data gives important information for the study of the title compound. We can calculate other thermodynamic energies as a function of these thermodynamic relationships.
4.10 IR absorption spectroscopy study
To obtain more information on the crystal structure, we have undertaken a vibrational analysis by determining infrared spectroscopy and Raman scattering (Leela et al., 2015; Gunasekaran et al., 2009). IR spectroscopy can be used to distinguish molecular groups and to find microscopic information on their conformations. It is a very important technique to find the actual binding sites. The IR absorption spectrum was recorded with a spectral resolution in the region 4000–400 cm−1. Both experimental and theoretical IR spectrum are compared in Fig. 10 (a and b), respectively. Also the Raman spectrum (4000–500 cm−1) is determined in gas phase by using the WB97XD/6-311++G** method (Fig. S10). Table 6 shows the IR and Raman intensity, experimental and calculated frequencies (scaled and unscaled) and also vibrational assignments for 1PPNO3 on the gaseous phase assigned by VEDA program (based on the percentage total energy). Using Gauss View program, these assignments are confirmed by molecular visualization effects. For vibrational frequency, we adopt uniform correlation coefficients: frequencies below 1700 are multiplied by 0.983, so that greater than 1700 are multiplied by 0.958. This correction is made to find a good agreement with the experimental frequencies. Theoretically, the calculated scaled values correlate greatly with observed values. (C10H16N2)(NO3)2·H2O molecule crystallizes in a monoclinic mesh with the space group P21/c (C2h). Nitrate (NO3) groups have C1 symmetry. As a result, our molecule consists of 39 atoms, it has 3 N-6 (=3x39-6) = 111 fundamental normal modes of IR vibrations. All these modes are guessed using the PED calculations. The vibrational modes of 1PPNO3 are classified in many group vibrations. Of the 111 modes, only 7 bands of vibration are observed on the IR absorption spectrum. This can be explained by the interaction between the different nitrate groups, which produces modes to which fairly wide bands correspond and which can correspond to several lines. For the organic cation, the attribution of the normal modes of vibrations is rather complex since these modes overlap with that of the nitrate group. In the configuration below, they exist many kinds of hydrogen bonds like C–H…O, O–H…O, N–H…O and O–H…N. Intra-molecular and inter-molecular hydrogen bonding arise when H atoms and O, N atoms exist within a molecule or between two molecules. The chosen compound contains aromatic and hetero-aromatic rings: the aromatic structure of the molecule of benzene is very sensitive by the nature of the substituent. Nowadays, in the spectroscopic field, much paper is dedicated to investigate the vibrational spectra of benzene derivatives (Rastogi et al., 2002).
Theoretical (a) and experimental (b) IR spectra.
Frequency observed (Cm−1)
Frequencies calculated (Cm−1)
IIR
IRAMAN
Vibrational assignments
Unscaled
Scaled
3967
3801
85.48
95.01
νOH (99)
3574
3424
626.32
96.52
νOH (97)
3483
3527
3378
6.90
49.65
ν NH (100)
3228
3092
8.62
302.56
νCH (92)
3221
3085
5.19
39.28
νCH (91)
3208
3073
6.00
64.77
νCH (91)
3201
3066
5.60
60.04
νCH (89)
3192
3058
54.24
93.66
νCH (89)
3174
3041
9.99
36.01
νCH (84), νCH (14)
3160
3027
1.24
33.88
νCH (93)
3149
3017
0.76
106.73
νCH (93)
3149
3016
7.28
27.12
νCH (93)
3095
2965
14.48
125.69
νCH (94)
3090
2961
12.87
42.88
νCH (87)
3089
2959
6.34
122.17
νCH (88)
3040
3077
2948
9.51
64.82
νCH (13), νCH (78)
2789
2702
2589
1364.63
114.80
νNH (90)
2507
2607
2497
3384.57
271.02
νOH (86)
1762
1787
1712
294.72
3.21
νON (53), δHON (29)
1694
1665
26.44
9.10
νCC (51), δHNC (16)
1681
1652
79.11
12.05
νCC (28), δHOH (52)
1676
1648
75.67
10.96
νCC (35), δHOH (36)
1601
1627
1599
173.04
6.75
νCC (14), δHNC (41)
1596
1568
560.07
8.67
νON (76)
1571
1545
450.67
5.98
νON (37), δHON (43)
1550
1524
74.59
1.10
δHCC (47), τHNCC (12)
1546
1519
31.20
2.11
δHCC (12), τHNCC (36)
1510
1509
1483
9.92
3.74
δHCH (71)
1505
1480
13.97
1.35
δHCH (21), τHNHC (16), τHCHN (36)
1501
1476
20.14
4.11
δHCH (56), τHNHC (12)
1495
1469
19.74
2.58
νCC (15), δHCC (51)
1492
1466
32.25
6.69
δHCH (13), δHCH (32), τHCHN (18)
1484
1458
15.64
6.37
δHCH (67)
1446
1421
30.19
4.15
δHCN (62)
1427
1403
0.77
2.09
δHCN (59)
1400
1415
1391
3.43
0.27
δHCC (42)
1386
1362
7.48
0.95
δHCC (64)
1384
1360
200.03
15.50
νON (56)
1376
1352
14.05
3.52
δHCC (70)
1369
1345
223.36
0.52
νCC (14)
1366
1342
85.63
26.15
νON (12), δHCC (14)
1339
1341
1318
289.67
4.30
νON (53)
1330
1307
113.84
1.83
νCC (41)
1299
1312
1289
36.80
1.09
δHCC (52), νCC (10)
1259
1246
1225
12.46
16.76
νNC (55), δHCC (16)
1229
1208
3.53
3.93
δHCC (37)
1222
1201
17.62
2.06
δHCC (51)
1200
1179
29.23
8.22
δHCC (25)
1194
1174
16.26
7.07
δHCC (48)
1186
1166
19.36
1.99
νNC (47)
1158
1145
1126
49.56
1.60
νNC (24), τHNHO (43)
1130
1111
10.76
1.68
νCC (44), δHCC (23)
1116
1097
36.11
3.71
νNC (61)
1108
1114
1095
116.37
31.73
νON (91)
1071
1053
7.45
5.67
δHCC (11), δCCC (47), δCCN (16)
1058
1040
19.83
19.63
νCC (56)
1053
1035
0.95
13.59
δCCC (13)
1046
1028
3.17
0.27
τHCCH (75)
1037
1038
1020
21.99
0.53
δHCN (45)
1026
1009
0.81
21.08
δCCC (48)
1023
1006
0.43
2.54
τHCCH (73)
1020
1003
125.76
13.41
νON (70), δONO (18)
974
958
10.78
1.16
τHCCH (49)
968
951
14.13
3.18
δHNC (28), τHCCH (22)
939
923
22.54
0.46
νCC (48), δHNC (12)
917
922
906
197.70
2.66
νNC (62)
886
876
861
2.09
0.32
τHCCC (87)
875
860
33.75
5.17
νCC (71)
853
839
21.32
0.27
γOOON (9)
848
833
0.86
2.25
τHCCN (39)
826
820
806
14.99
15.57
νNC (39), τHCCN (11)
817
803
13.22
0.18
γOOON (98)
791
777
36.65
0.04
τ HCCC (76)
766
753
740
6.02
1.92
δONO (74)
747
734
16.90
1.47
δONO (57), τNOHO (21)
725
725
713
36.63
0.27
τ HCCC (54), τCCCC (24)
722
710
9.52
2.93
νON (18), δONO (71)
695
699
687
75.40
0.63
δONO (15), τNOHO (62)
684
673
45.35
5.51
δONO (70)
645
659
648
7.38
2.01
δCCC (53)
634
623
1.30
5.28
δCCC (85)
574
564
7.27
0.57
δCCN (33), τHCCN (12)
524
553
543
17.13
0.11
δCNC (13), γNCCC (61)
4.10.1 4000–2000 cm−1 zone
The benzene ring contains five adjacent hydrogen atoms and hence five C–H bonds. The five expected C–H stretching vibrations in the benzene ring refers to stretching modes of C27-H1, C26-H10, C28-H8, C25-H7 and C24-H2 units. Theoretically, these vibrations are equal to 3092, 3085, 3073, 3066, 3057 cm−1, with contributions 92%, 91%, 91%, 89% and 89% respectively. The hetero-aromatic organic molecule contains two nitrogen atoms. The symmetrical and anti-symmetrical stretching modes of N–H are normally assigned between 3378 and 2588 cm−1, whereas experimentally is in 3483–2789 cm−1 region. The hetero-aromatic structure present the C–H stretching vibrations assigned in the 3041–2497 cm−1 region. These deformation vibrations are all coupled vibrations with major contributions from C–C stretching vibrations. The frequencies 3800, 3423 and 2497 with assignments 99%, 97% and 86%, respectively, are probably associated with OH stretching modes.
4.10.2 2000–1000 cm−1 zone
In this region are expected the C–C, C=C and C–N stretching modes, rocking and deformation modes of CH2 and NH2 groups. We also find the rocking modes of C–H and the wagging modes of CH2 groups. The infrared band of medium intensity is obviously assigned to C=C stretching modes since this bond is determined using calculations with double bond character. The CH2 deformation are obtained by calculations between 1466 and 1458 cm−1 despite the modes of the same group are foreseen between 1400 and 1390 cm−1.
4.10.3 1000–18 cm−1 zone
The assignments of the out-of-plane deformation of the OOON bond is equal to 803 Cm−1, which give rise to weak infrared and Raman bands. The torsion and deformation vibration modes of both piperazine and phenyl groups are predicted in this zone and allocated such as comparable molecules. There are other modes predicted by calculations which have a lower wavenumbers.
5 Conclusion
Hybrids materials have a great interest in different domain of the sciences regarding to their special properties and medical applications. In this paper, we report complete structural, electronic, vibrational and biological properties of the organic–inorganic hybrid 1-Phenylpiperazin-1, 4-Diium Nitrate Monohydrate based on DFT calculations. The optimization results showed that WB97XD functional with 6-311++G** level is adequate to study the physicochemical properties of 1PPNO3. A good agreement between theoretical and experimental results was observed. The dipole moment is greater in water which promotes the formation of the hydrogen bond interactions. AIM analysis has shown that all the electron density and the Laplacian of electron density were positive, indicating the presence of remarkably strong H-bonds interactions (like N16…H18-O39 and N16…H18-O3). The NCI study highlighted the interactions of hydrogen bonds, Van der Waals and the steric effect. Natural bond orbital (NBO) analysis was carried out to indicate the transfer of charge in terms of “donor acceptor” within the molecule. Hirshfeld surfaces and the contributions of the various atomic contacts have shown the presence of weak intra and inter molecular interactions. The molecular electrostatic potential (MEP) was used to predict the behavior of the reactant of 1PPNO3 in the reactions of electrophiles and nucleophiles. Results obtained justify the presence of hydrogen-bond interactions taking place within molecule. The frontier molecular orbital, calculated by TD-DFT aproach, are determined in the gas phase, water and methanol solution to explain the charge transfer interactions. Results reveal that 1PPNO3 is more reactive in methanol solvent. Docking calculations were examined based on the interaction between the ligands-enzymes complexes. Results reveal that the chosen compound can be a good inhibitor against Alzheimer's and Parkinson diseases, since it has an significant total energy score which makes them an important candidate to study. The DTA curve exhibit the same phenomena obtained by DSC but with a lower intensity, explaining by the small mass of the sample utilized. The variation of the thermodynamic parameters (the entropy S; the heat capacity Cp and the enthalpy H) of 1PPNO3 versus the temperature has been performed. Finally, the vibrational frequencies and corresponding assignments of 111 fundamental normal modes of IR vibrations are reported.
Funding
Researchers supporting project number (RSP-2020/61), King Saud University, Riyadh, Saudi Arabia.
Declaration of Competing Interest
The authors declare that they have no known competing financial interests or personal relationships that could have appeared to influence the work reported in this paper.
References
- Properties of atoms in molecules: atoms under pressure. J. Chem. Phys.. 1997;107:4271-4285.
- [Google Scholar]
- Becke’s three parameter hybrid method using the LYP correlation functional. J. Chem. Phys.. 1993;98:5648-5652.
- [Google Scholar]
- A simple measure of electron localization in atomic and molecular systems. J. Chem. Phys.. 1990;92:5397.
- [Google Scholar]
- Computational study of 3-thiophene acetic acid: Molecular docking, electronic and intermolecular interactions investigations. Comput. Biol. Chem.. 2020;86:107268
- [Google Scholar]
- Long-range corrected hybrid density functionals with damped atom–atom dispersion corrections. Phys. Chem. Chem. Phys.. 2008;10(44):6615.
- [CrossRef] [Google Scholar]
- Dalla-Costa, Pharmacokinetic evaluation of LASSBio-579: an Nphenylpiperazine antipsychotic prototype. J. Pharm. Pharmacol.. 2008;60:699-707.
- [Google Scholar]
- Lecomte, Hydrogen bond strengths revealed by topological analyses of experimentally observed electron densities C. Chem. Phys. Lett.. 1998;285:170-173.
- [Google Scholar]
- Gaussian 09, Revision A.02. Wallingford CT: Gaussian, Inc.; 2009.
- Fukui, K. 1975. Theory of Orientation and Stereoselection, Springer-Verlag Berlin Heidelberg New York, 112.
- Gatfaoui, S., Roisnel, T., Dhaouadi, H., Marouani, H., 2014. Trans-2, 5-Dimethylpiperazine-1, 4-diium dinitrate. Acta Crystallographica Section E: Structure Reports Online, 70, 725-725.
- A proton transfer compound template phenylethylamine: synthesis, a collective experimental and theoretical investigations. J. Mol. Struc.. 2019;1191:183-196.
- [Google Scholar]
- Synthesis, experimental, theoretical study and molecular docking of 1-ethylpiperazine-1,4-diium bis(nitrate) Solid State Sci.. 2020;106:106326
- [Google Scholar]
- GaussView, G. Inc. (Carnergie Office Parck-Building6 Pittsburgh PA 151064 USA), Copyright© 2000-2003 Semichem.
- Conceptual density functional theory. Chem. Rev.. 2003;103(5):1793-1874.
- [CrossRef] [Google Scholar]
- Intermolecular interactions and molecular docking investigations on 4-methoxybenzaldehyde. Comput. Mater. Sci.. 2018;149:291-300.
- [CrossRef] [Google Scholar]
- Gray, J.L., Krojer, T., Talon, R., Douangamath, A., Jimenez Antunez, C., Bountra, C., Arrowsmith, C.H., Edwards, A., Brennan, P.E., Delft, F.V., 2019. PanDDA analysis group deposition.
- Vibrational assignments and electronic structure calculations for 6-thioguanine. J. Raman Spectrosc.. 2009;40:1675-1681.
- [Google Scholar]
- Jamróz, M.H., 2004. Vibrational Energy Distribution Analysis, VEDA 4, computer program, Poland.
- Characterization of CHO hydrogen bonds on the basis of the charge density. J. Phys. Chem.. 1995;99:9747-9754.
- [Google Scholar]
- Development of the Colle-Salvetti correlation-energy formula into a functional of the electron density. Phys. Rev. B. 1988;37(2):785-789.
- [CrossRef] [Google Scholar]
- Spectroscopic investigation (FTIR spectrum), NBO, HOMO–LUMO energies, NLO and thermodynamic properties of 8-Methyl-N-vanillyl-6-nonenamideby DFT methods. Spectroc. Acta A.. 2015;146:177-186.
- [Google Scholar]
- Multiwfn: a multifunctional wavefunction analyzer. J. Comput. Chem. 2012;33:580-592.
- [Google Scholar]
- Using autodock for ligand-receptor docking. Curr. Protoc. Bioinformatics.. 2008;24:8-14.
- [Google Scholar]
- http://www.nist.gov/mml/csd/informatics_research/thermochemistry_cgi.cfm.
- Experimental and DFT studies on the molecular structure, spectroscopic properties, and molecular docking of 4-phenylpiperazine-1-ium dihydrogen phosphate. J. Mol. Struct.. 2020;1207:127762
- [Google Scholar]
- Structural, docking and spectroscopic studies of a new piperazine derivative, 1-phenylpiperazine-1,4-diium-bis (hydrogen sulfate) J. Mol. Struct.. 2020;1202:127351
- [Google Scholar]
- DFT and molecular docking study of chloroquine derivatives as antiviral to coronavirus COVID-19. J. King Saud Univ.- Sci.. 2021;33(1):101248.
- [CrossRef] [Google Scholar]
- A library for package independent computational chemistry algorithms. J. Comput. Chem.. 2008;29:839-845.
- [Google Scholar]
- Synthesis and pharmacological evaluation of new N-phenylpiperazine derivatives designed as homologues of the antipsychotic lead compound LASSBio-579. Eur. J. Med. Chem.. 2013;66:122-134.
- [CrossRef] [Google Scholar]
- Pople, J.A., Beveridge, D.L., 1970. Approximate Molecular Orbital Theory, Mc Graw Hill, New York, 96, 91.
- Spectrochim. Acta Part. 2002;58:1987-2004.
- Molecular docking studies, structural and spectroscopic properties of monomeric and dimeric species of benzofuran-carboxylic acids derivatives: DFT calculations and biological activities. Comput. Biol. Chem.. 2020;87:107311.
- [CrossRef] [Google Scholar]
- Neuroscience. 1994;62:15-30.
- Fingerprinting intermolecular interactions in molecular crystals. Cryst. Eng. Comm.. 2002;4:378.
- [Google Scholar]
- A tetrachlorocobaltate(II) salt with 2-amino-5-picolinium: Synthesis, theoretical and experimental characterization. J. Mol. Struct.. 2020;1207:127781
- [Google Scholar]
- Visualizer, D.S., 2005, Accelrys software Inc. Discovery Studio Visualizer 2.
- Wolff, S.K., Grimwood, D.J., McKinnon, J.J., Turner, M.J., Jayatilaka, D., Spackman, M.A., 2012. Crystal Explorer (Version 3.1), UWA.
- GEMDOCK: A generic evolutionary method for molecular docking. Proteins. 2004;55(2):288-304.
- [CrossRef] [Google Scholar]
Appendix A
Supplementary data
Supplementary data to this article can be found online at https://doi.org/10.1016/j.jksus.2020.101283.
Appendix A
Supplementary data
The following are the Supplementary data to this article:


