

Translate this page into:
Predicting Stripe Rust Severity in Wheat Using Meteorological Data with Environmental Response Modeling
⁎Corresponding author. ahmed.ipfp.11740@pern.edu.pk (Ahmed Raza)
-
Received: ,
Accepted: ,
This article was originally published by Elsevier and was migrated to Scientific Scholar after the change of Publisher.
Peer review under responsibility of King Saud University.
Abstract
Objective
The main objective of current investigation was to develop a predictive disease model based upon meteorological data, viz., maximum temperature, minimum temperature, rainfall, relative humidity, and wind speed to predict stripe rust severity (%).
Methods
Five years' data of stripe rust severity on three wheat varieties, namely SA-42, Sandal-73, and Barani-70, continuously cultivated for five years (2013–2017), were collected from experimental trials of Deputy Director of Agriculture Extension Layyah to develop a predictive disease model. For validation of the model, a research trial was conducted in the Research Area of the Department of Plant Pathology, Bahadar Sub-Campus Layyah, during the crop seasons of 2018–2019, following procedures similar to those utilized in five years investigation. The data on epidemiological variables used in the present investigation was collected from the Pakistan Meteorological Observatory at Karor-Layyah. To evaluate the association between meteorological factors and disease severity correlation and regression analysis was performed.
Results
All meteorological variables contributed significantly in disease development and showed 89 % variability in stripe rust severity (%). Root means square error (RMSE) and residual (%) were used to evaluate the model's predictions. Both indices were below 20, showing that the model could accurately predict the progression of disease. The regression equations of 5 years model (Y = -63.11 + 0.96x1 + 1.72x2 + 3.72x3 + 0.43x4) and 2 years model (Y = -40.2 + 1.80x1 + 1.18x2 + 2.29x3 + 0.39x4) validated each other. Scatter plots indicated that environmental factors such as maximum temperature (12.8–22.5 °C), minimum temperature (8.7–14.8 °C), relative humidity (50–85 %), and wind speed (1.3–4.5) influenced the progression of stripe rust epidemic.
Conclusion
Understanding the epidemiology of stripe rust will help us to forecast its progression, allowing wheat growers to more precisely adapt plant protection measures.
Keywords
Epidemiology
Regression model
Stripe rut
Wheat

1 Introduction
The rusts pathogens are wheat's most important and widespread pathogens that cause significant yield losses if uncontrolled (Singh et al., 2008). For example, stripe rust epidemics can cause 6 million tons of crop losses annually worldwide (Khanfri et al., 2018). Stripe rust epidemics have repeatedly threatened the world grain production (Hovmøller et al., 2010). Temperature is most important for successful germination and rapid outbreaks. According to Mert et al., (2016), temperature ranging from 13 to 16 °C is ideal for fungal growth. Moisture plays a role in condensation, seed germination, pathogen transmission, and organism survival. Rapilly and Foucault (1976) reported that urediniospore attachment efficacy was enhanced by high relative humidity. Urediniospores require 3 h of wetness before germinating and infecting plants. Desiccation stops urediniospore germination irreversibly (Rapilly and Foucault, 1976).
The stripe rust epidemics have caused a significant reduction in grain yields in the past, still threaten the future production of grains. The pathogen is polycyclic and infects several hosts, including common wheat, durum wheat, triticale, wild emmer wheat, Oregon grape (Mahonia aquifolium) and Barberry (Chen et al., 2014). The 7–9 weeks or 10–12 weeks are the most critical periods for disease development, and fast progress depends upon the pathogen's survival in the susceptible host and conducive environmental conditions (Ali et al., 2020a). When emerging pathogen races come into contact with susceptible hosts and favourable environmental conditions, they can travel fast to new locations, even if they are endemic to certain regions (Ali, 2018).
Foliar fungicides reduce disease pressure effectively when sprayed before 5 % pathogen infection and again 3–5 weeks later, depending on disease severity or the active ingredient. More than 40 fungicides have been registered to control disease epidemics, the majority of which are in the QoI (strobilurin) and DMI (triazole) classes. Both propiconazole (Tilt® in the DMI class) and pyraclostrobin (Headline® in the QoI class) have been used for over three decades. Quilt Xcel® or Quilt® (propiconazole and azoxystrobin) are popular due to their dual DMI and QoI mechanisms of action (Chen, 2014; Kang et al., 2019).
Several disease predictive models with varying data requirements and degrees of complexity have been developed to forecast disease severity in wheat (El Jarroudi et al., 2017; Ali et al., 2017; Newlands, 2018). A warning system for effective fungicide treatments in wheat fields was developed in Luxembourg using a weather-based disease forecasting model. Even though the results were region-specific, the authors noted that the methodology and assumption may be applied elsewhere. These models reduce environmental concerns, economic costs, and yield losses while enhancing fungicide effectiveness and timeliness (Newlands, 2018). Hence, the main objective of the present investigation was to develop a predictive disease model for predicting stripe rust severity using meteorological data from Layyah Pakistan.
2 Materials and methods
2.1 Development of disease predictive model based on five years data set (2013–2017)
2.1.1 Disease severity data
Five years' data of stripe rust severity on three wheat varieties, namely SA-42, Sandal-73, and Barani-70, continuously cultivated for five years (2013–2017), were collected from the evaluation Varietal Trials (EVT) experiments of the Deputy Director Agriculture Extension Layyah (30°45' N and 70° 44' E). In addition, for each year of data collection, the sowing date was also recorded. The varieties SA-42, Sandal-73, and Barani-70, along with other local and zonal check varieties and new elite lines, were cultivated in 6 m rows with 45 cm row-to-row distance. A rust spreader row of Morocco variety was planted after every 15th genotype.
The disease severity data were recorded in each 6 m row of the genotypes SA-42, Sandal-73, and Barani-70. The data records started from the beginning of the inoculation when the disease symptoms not appear and continued at eight days until crop maturity. Five times during the growing season, data were collected, and the final observation was made on a flag leaf between crop development stages (GS) 71 and 79 on the Zadok's scale (Zadoks et al., 1974). The modified Cobb scale was used to record the percentage of disease severity (Peterson et al., 1948). These information on disease severity were used in the statistical analysis and the predictive disease model.
2.2 Meteorological data
Daily environmental data recorded at the Pakistan Observatory Meteorological Station of Karor-Layyah was used in current investigation. The data on meteorological variables that were predicted to be connected to disease epidemics, such as maximum and minimum temperature, relative humidity, rainfall, and wind speed, were collected for the same years that stripe rust severity data were available of that location. The weekly means for 17 weeks were calculated using the daily values of each epidemiological variable starting from the day of sowing. The genotypes SA-42, Sandal-73, and Barani-70, take 20 weeks from planting to maturity, but during the final three weeks before harvest, meteorological factors have no impact on crop yield or pathogen infection.
2.3 Development of regression model
Stepwise regression models were carried out between the five years (2013–2017), epidemiological variables (independent variables), and disease severity data (dependent variable). The correlation also determined the impact of environmental conditions on disease severity (Steel et al., 1997).
2.4 Model assessment
The model's validity was determined using a method proposed by Chatterjee et al (2000). Three steps were performed to evaluate the model: (i) dependent variable (stripe rust severity) and regression coefficients were compared with physical theory, (ii) predictor and observed variables were comparison, and (iii) collected new data to check predictions. The error, represented as a percentage, and the root mean square error were used to evaluate the predictions by using the expression given below (Chatterjee et al., 2000).
The variables under study are represented by the predicted values (Pi), the observed values (Oi), and the overall number of observations (n).
2.5 Collection of new data
To collect the new data, a research trial was conducted in the Research Area of the Department of Plant Pathology, Bahadar Sub-Campus Layyah, throughout the crop seasons of 2018–2019, using the same methodology as the previous five-year investigation, because the meteorological conditions and soil type of both locations are similar. Three susceptible to moderately susceptible wheat varieties SA-42— Sandal-73 and Barani-70—were sown during the third week of November 2018–2019 under augmented design, with 45 cm R × R distance and 15 cm P × P distance, respectively.
To develop high disease pressure, one row of Morocco was planted next to each row of cultivated genotypes on each side. From mid-January to the last week of February, experimental plots were artificially inoculated with urediniospores at a concentration of 106/ml of distilled water. Inoculation was done twice a week using the dusting and hypodermal needle injection techniques proposed by Rao et al., (1989). The applied inoculum consisted of stripe (80E85) rust races collected from Kaghan, Murree, Faisalabad, and farmer fields of Layyah. The crop was kept in healthy condition by applying the suggested doses of nitrogen, phosphorus, and potassium at 120, 30, and 60 kg ha−1, respectively, according to the recommended practises for the region. Herbicides were also applied at recommended amounts for the management of weeds. Data recording procedures for stripe rust severity (%) and the epidemiological variables were the same as earlier experiments.
2.6 Model validation
The stripe rust severity of three wheat varieties cultivated at the Bahadar Sub-Campus Layyah Research Area during crop seasons 2018–2019 was used to develop a two-year model to validate the five-year model (2013–2017) through a comparison of regression coefficients (R2) produced by the F-test (Steyerberg, 2016). The data relating to the meteorological factors for the periods 2018–2019 were collected from the Pakistan Observatory Meteorological Station, Karor-Layyah. Meteorological factors exhibiting a strong association with stripe rust severity on all three wheat genotypes were plotted, and conducive disease development ranges were also calculated.
2.7 Statistical analysis
The data were analyzed by using the SAS/STAT statistical software V.9.01 Steel et al., 1997) and Minitab V.17 (Minitab Inc., USA). The meteorological variables and stripe rust severity data was subjected to analysis of variance and correlation analysis. To compare the means least significant difference (LSD) test was used (p ≤ 0.05). A stepwise multiple regression analysis was used to develop a predictive model for stripe rust severity (Steyerberg, 2016). The coefficient of determination (R2) and R2 Adjusted were determined using the expression below to assess the accuracy of model's prediction as well as the relationship between meteorological variables and stripe rust severity (Steyerberg, 2016):
Where, k and n represent independent variables and sample size, respectively. By using following equations, Mallows Cp and mean square error were also determined to examine the impact of environmental conditions in the predictive-models (Steyerberg, 2016):
While n and p in the Cp equation represent the sample size and regression model beta coefficients, respectively. Whereas, mean square error (MSE) equation shows the predicted ( ), observed (yi), and number of data values (n).
3 Result
All the epidemiological variables showed positive correlation with the stripe rust development during all five growing seasons (2013–2015) (Fig. 1). Based on a five-year data set, a multiple regression model (Y = -63.11 + 0.96x1 + 1.72x2 + 3.72x3 + 0.43x4) indicated that major factors responsible for disease development were minimum and maximum temperature, wind speed, and relative humidity. It is evident from the model equation that for one unit change in minimum and maximum temperature, wind speed, and relative humidity, there would be a probable change of 0.96, 1.72, 3.72, and 0.43 units in stripe rust development, respectively. The model explained 85–90 % variability in disease development (Table 1). *Significant at P ≤ 0.05.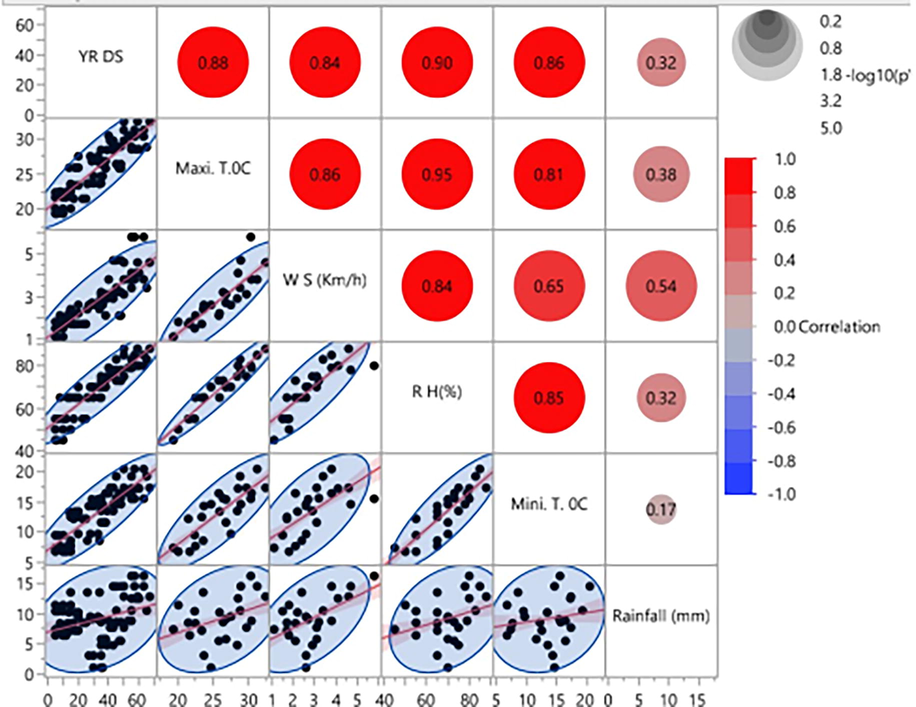
Pearson correlation indicating the interaction between environmental conditions and stripe rust severity during five years (2013–2017).
Parameter
No. in Model
Model R2 (%)
C(p)
MSE
F value
Prb. > F
Minimum Temperature (℃)
1
0.85
36.54
6.86
6.96
0.01*
Maximum Temperature (℃)
2
0.88
13.65
6.06
8.36
0.04*
Wind speed (km/h)
3
0.89
9.96
5.88
9.79
0.03*
Relative Humidity (%)
4
0.90
5.00
5.65
6.05
0.01*
3.1 Model assessment
3.1.1 Comparison of the dependent variable (stripe rust severity) and regression coefficients with physical theory
The model exhibited a higher R2 value (90.67) and a low standard error of estimate (5.65) that are considered fairly good, mainly under natural environmental conditions when no studied variables are controlled (See Appendix 1 in the supplementary file). The regression model's F-distribution was significant at P < 0.05 (See Appendix 2 in the supplementary file). Minimum and maximum temperature, wind speed, and relative humidity significantly affected stripe rust severity at P < 0.05, and each demonstrated a low standard error (Table 2). Regression-significant statistics, a higher R2 value, and a lower standard error value showed that the model accurately predicted the stripe rust severity. *Significant at P ≤ 0.05.
Parameters
Coefficients
Standard Error
T-Value
P-Value
Constant
−63.11
9.46
−6.67
0.00*
Minimum Temperature (℃)
0.96
0.36
2.64
0.01*
Maximum Temperature (℃)
1.72
0.59
2.89
0.05*
Wind speed (km/h)
3.72
1.19
3.13
0.03*
Relative Humidity (%)
0.43
0.17
2.46
0.01*
3.2 Evaluation of model by comparing the observed and predicted data
The model predictions were evaluated using error (%) and RMSE. The majority of the data points for the five-year model (2013–2017) were close to the reference line, with only a small number deviating and leading to an error in the regression model. Overall, the recorded 20 % residual represents a good match between observed and projected data points (Fig. 2). All three wheat varieties, SA-42, Sandal-73, and Barani-70, had higher R2 values greater than 89 % and lower RMSE values ≤ 20, which indicated that the model was effective at predicting the severity of the stripe rust (%) (Fig. 3).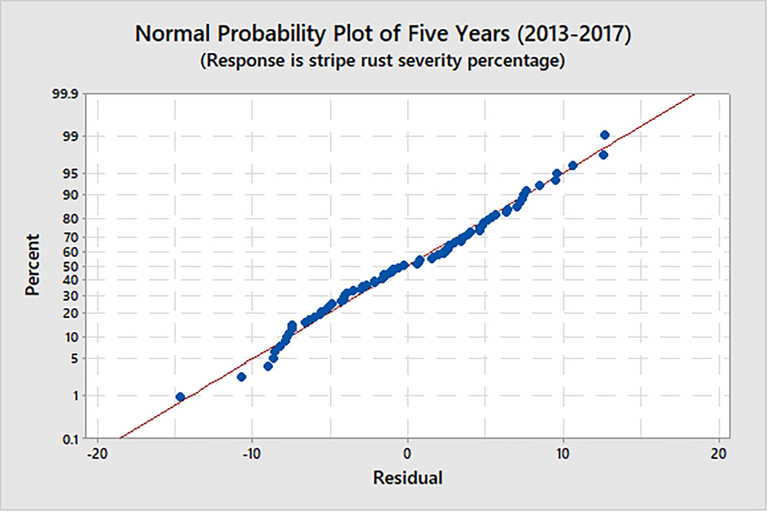
Normal probability plot for five years (2013–2017) model of stripe rust severity (%).
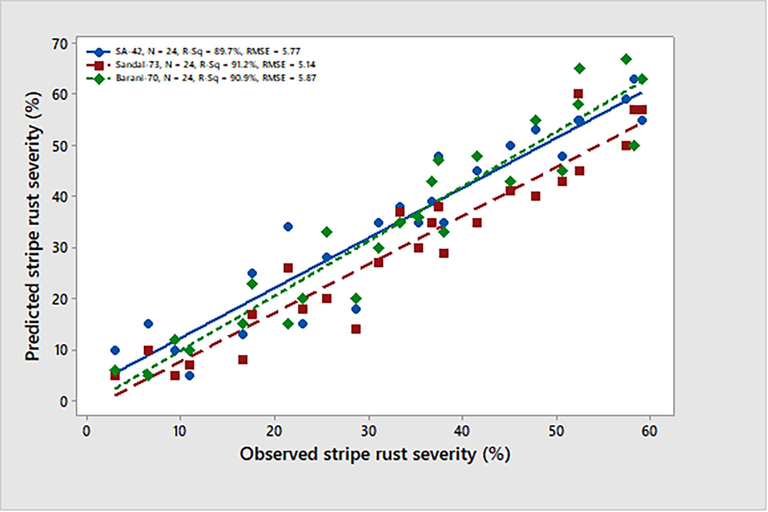
Comparison of observed & predicted data points of stripe rust severity on three wheat varieties SA-42, Sandal-72, and Barani-70 during crop seasons of five years (2013–2015).
3.3 Model validation
In order to validate the five-year stepwise multiple regression model, data from a two-year research trial at the Bahadar Sub-Campus Layyah were used. The stripe rust severity (%) was significantly influenced by meteorological variables, as shown by the R2 values of both models I (90.67 %) and II (85.09 %). A strong proximity was recorded between the regression equations of both models (Table 3). Model (I) = Five years model; Model (II) = two years model; Y = stripe rust severity; x1 = minimum temperature; x2 = maximum temperature; x3 = wind speed; x4 = relative humidity; Sig. at P ≤ 0.05.
No. of Model
Regression Equations
R2 (%)
Adj. R2 (%)
Prob. > F
I
Y = -63.11 + 0.96x1 + 1.72x2 + 3.72x3 + 0.43x4
90.67
90.13
< 0.01*
Vs
II
Y = -40.2 + 1.80x1 + 1.18x2 + 2.29x3 + 0.39x4
85.09
81.99
< 0.01*
3.4 Characterization of environmental factors conducive to stripe rust severity (%) during 2018–2019
The environmental conditions conducive to the stripe rust epidemic were characterized on three wheat varieties, viz., SA-42, Sandal-73, and Barani-70, during two crop seasons, 2018–2019. Temperature (minimum and maximum) contributed significantly to the stripe rust severity (%) on all three wheat varieties. Maximum disease severity (%) was recorded during both growing seasons by increasing minimum temperature ranging from 8.7 to 14.8 ℃ and maximum temperature ranging from 12.8 to 22.5 ℃, respectively. The linear regression models provided the best explanation for this relationship, as shown by the correlation coefficient (r) values (Figs. 4-5). The significant correlation between wind speed and stripe rust severity (%) was found. Stripe rust severity (%) increased during the crop seasons, 2018 and 2019, as wind speed increased from 1.3 to 4.5 km/h (Fig. 6). On all wheat varieties, a strong correlation between stripe rust severity (%) and relative humidity was observed. In both crop seasons, the maximum disease severity was noted between 50 and 85 % relative humidity; this indicated that stripe rust severity increased as relative humidity increased, as showed by their r values, which were respectively 0.84, 0.86, and 0.72 for the 2017–2018 crop season and 0.80, 0.96, and 0.94 for the 2018–2019 crop season (Fig. 7). In both growth seasons, a very low correlation was observed between rainfall and stripe rust severity (%). By increasing rainfall ranging from 1.5 to 11.7 mm, disease severity also increased to some extent and explained 20–53 % variability in disease development. Their r values best explained this relationship, i.e., 0.20, 0.40, 0.53 during 2017–2018, and 0.25, 0.33, 0.46 in 2018–2019 (Fig. 8).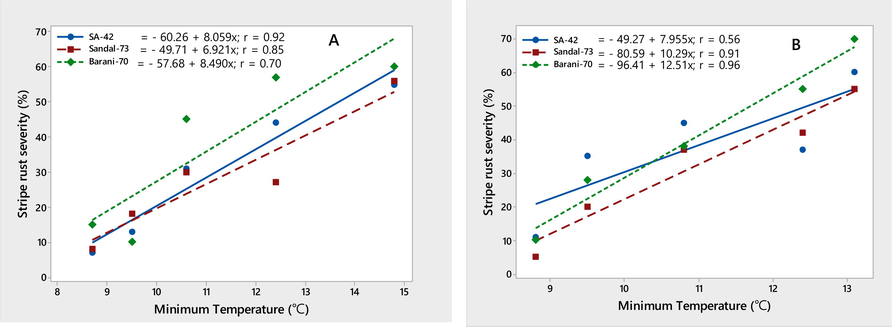
Relationship between minimum temperature & stripe rust severity (%) recorded on wheat varieties SA-42, Sandal-73, and Barani-70 during two years 2017–2018 (A) and 2018–2019 (B).
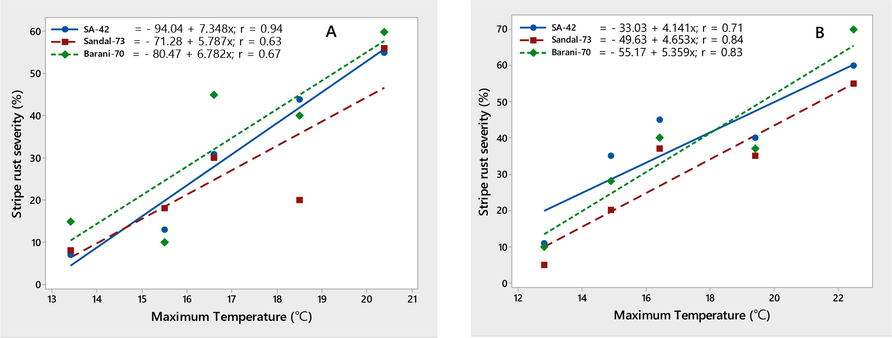
Relationship between maximum temperature & stripe rust severity (%) recorded on wheat varieties SA-42, Sandal-73, and Barani-70 during two years 2017–2018 (A) and 2018–2019 (B).
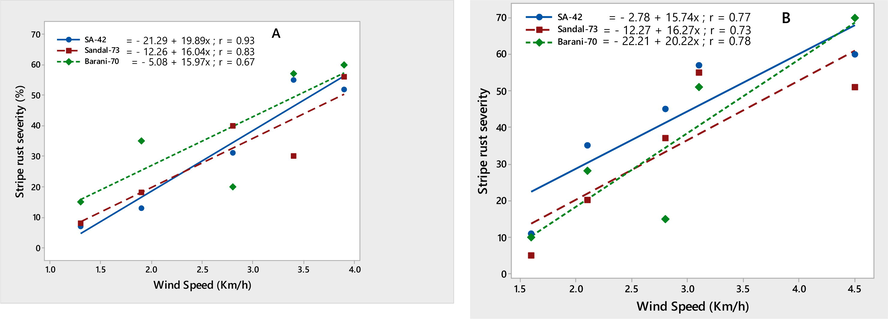
Relationship between wind speed (km/h) & stripe rust severity (%) recorded on wheat varieties SA-42, Sandal-73, and Barani-70 during two years 2017–2018 (A) and 2018–2019 (B).
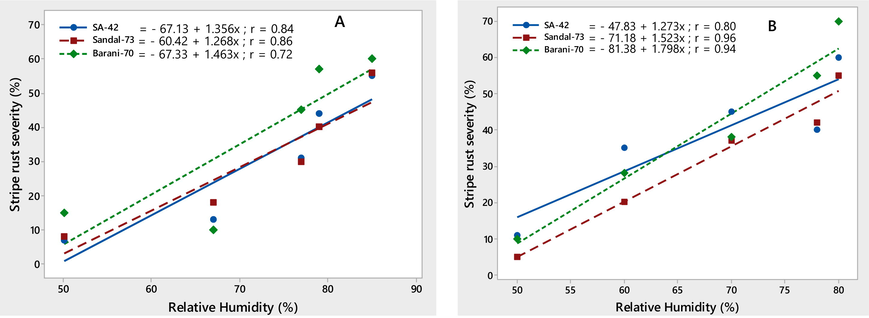
Relationship between relative humidity (%) & stripe rust severity (%) recorded on wheat varieties SA-42, Sandal-73, and Barani-70 during two years 2017–2018 (A) and 2018–2019 (B).
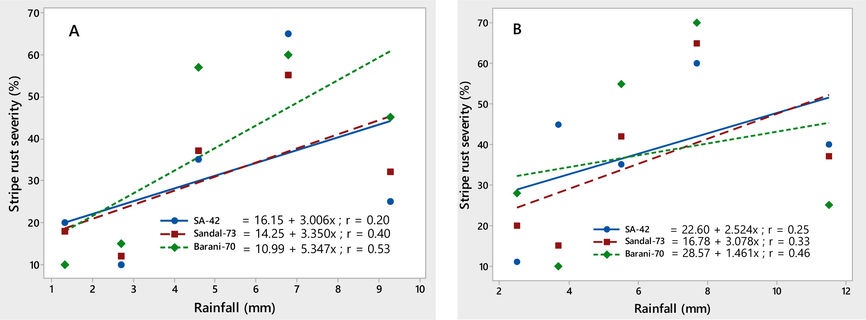
Relationship between rainfall (mm) & stripe rust severity (%) recorded on wheat varieties SA-42, Sandal-73, and Barani-70 during two years, 2017–2018 (A) and 2018–2019 (B).
4 Discussion
Quantifying disease and weather relationships is likely to be crucial in developing an early forecasting model for stripe rust in wheat because environmental conditions have a significant impact on the development of pathogens on any crop. Rusts diseases are influenced mainly by relative humidity, temperature (minimum and maximum), rainfall, and wind speed (Ali et al., 2020b; Lyon and and Broders, 2017). However, the degree of correlation explored here between stripe rust severity (%) and environmental conditions was limited to rainfall. The positive relationship of temperature with stripe rust severity showed that it could have a significant role in the various stages of disease progress, viz., spore germination and infection, latent period, spore liberation, and disease development (Mahapatra et al., 2018). Vallavieillie et al., (1995) described that under optimum temperature and non-limiting humidity, Puccinia striiformis infection efficacy was ten times greater. The positive association between disease severity and relative humidity was due in part to its essential role in the spread of urediniospores in clusters or individually. These spores increase in clusters as relative humidity increases. High relative humidity (70–80 %) favors the stronger attachment of urediniospores with the leaves. Moreover, high relative humidity frequently enhances the stripe rust severity by increasing the infection incidence. Rapilly and Fournet (1968) stated that relative humidity must be greater than 50 % for sporulation. Furthermore, the production of urediniospores increased exponentially with increasing relative humidity. Wind speed also influenced the disease severity by drying the urediniospores, ultimately reducing the on-site spore germination and increasing the duration of spore viability. More essentially, wind speed played a vital role in the dispersal of stripe rust severity.
The sexual stage of the pathogen life cycle starts with the production of dikaryotic urediniospores (n + n) on primary hosts. This phase causes cereal stripe rust epidemics. The pathogen later produces two-celled, thick-walled teliospores during the epidemic phase. A mature teliospore cell has a karyogamy-generated diploid (2n) nucleus. Even in similar conditions, Pst isolates form telia differently (Jin et al., 2010; Wang and Chen, 2013; Chen et al., 2012). The Pst teliospores lack dormancy and germinate fast (24 h) to form a four-cell promycelium under free water conditions at 12 °C. A single haploid nucleus is produced during meiosis, which transforms into a basidiospore after 48 h and emerges from the sterigma after 60 h. These basidiospores infect Berberisand Mahoniaspecies (72 h). A minimum dew period of 40 h is necessary for basidiospore infection of barberry leaves (Rapilly, 1979).
The factors that persisted after stepwise multiple regression analysis showed that the temperature, relative humidity, and wind speed were the meteorological conditions that contributed most to the spread of the disease. All four predictive models in the current investigation showed 85–90 % variability in disease development and will enable disease prediction in the ninth week of the crop, providing enough time to take disease control measures. These regression models greatly vary from the other disease predictive models for forecasting stripe rust severity, which were usually multivariable equations (Räder et al., 2007; Park and Wellings, 1992). The regression models such as these do not explain the 100 % of variability in disease development. Kumar (2014) developed the empirical models and explained 28–30 % unexplained variability when only meteorological factors were used to forecast disease severity. In the current investigation, only 10–20 % of the disease severity variance remained unexplained, which is acceptable considering the meteorological variables. As predictor factors, biological traits and the initial inoculum in the field may help reduce the variability that can't be explained. However, users may need access to such data, which makes it hard to use multiple regression models in decision support systems. Predictive disease models were primarily qualitatively validated by comparing the observed and predicted data sets for the disease, by using the independent data on disease severity. A similar method for the validation of prediction models was used by Kumar (1991). The validation results of both Model-I and II showed similar coefficients of determination (R2) values (Table 3), indicating close association with one another for predicting disease severity.
In the present investigation that was confined to field results, stripe rust severity levels of 70 % were recorded with the change in environmental conditions. In an investigation on stripe rust, Park (1991) reported that while pathogen infection decreased in the lab from 100 % at 15.4 °C to 0.8 % at 21 °C, under field conditions, a severe disease outbreak occurred at any temperature between 19 and 30 °C. The moderate success of disease prediction models may be due to stripe rust's polycyclic nature, with multiple pathogen generations per crop season. However, in the field, stripe rust environmental conditions may be different than in the lab (Grabow et al., 2016). Short, irregular deviations in environmental conditions that impact how the disease develops later cause difficulty in predicting stripe rust severity under field conditions. Hakro and Khan (2012) reported that Pakistan's plain regions lack a local source for developing the stripe rust disease. It comes from the mountains, Northern areas, and high lands of Baluchistan, several kilometers away from plains areas. The stripe rust severity in these areas depends on the multiplication of the inoculum of the pathogen at the source (Hakro and Khan, 2012; Khushboo et al., 2021).
5 Conclusion
The percentage of stripe rust severity and all meteorological factors were significantly correlated. The five years stripe rust disease predictive model validated with a two years data set explained 89 % variability in disease development. The maximum temperature (12.8–22.5 ℃), minimum temperature (8.7–14.8 ℃), relative humidity (50–85 %), and wind speed (1.3–4.5) demonstrated significant effects on stripe rust severity (%). Predictive models are helpful in reducing outbreaks of stripe rust because the environment plays a significant role in the disease's development. The model predicts when to spray a crop to prevent the spread of disease. Thus, understanding the epidemiology of stripe rust will allow us to predict its epidemics, enabling wheat growers to modify plant protection measures more precisely.
Funding/Acknowledgment
As received funding from Higher Education Commission, Pakistan, to complete research project No. 21–2663/SRGP/HRD/HEC/2020 under Start-Up Research Grant Program (SRGP), the authors acknowlede HEC for the grant. The funders had no role in study design, data collection, analysis, decision to publish, or manuscript preparation. The authors extend their appreciation to the Researchers supporting project number (RSP-2021/229) King Saud University, Riyadh, Saudi Arabia.
Declaration of Competing Interest
The authors declare that they have no known competing financial interests or personal relationships that could have appeared to influence the work reported in this paper.
References
- Optimization of environmental factors conducive for stripe rust of wheat. Pak. J. Phytopathol.. 2017;29(2):239-245.
- [Google Scholar]
- Characterization of environmental conditions conducive for stripe rust epidemic on wheat. Int. J. Biosci.. 2020;17(5):75-84.
- [Google Scholar]
- Virulence analysis of leaf and stripe rust populations in Pakistan through avirulence to virulence formula. Arch. Phytopathol. Plant Prot.. 2020;53(17–18):844-855.
- [CrossRef] [Google Scholar]
- Ali, Y., 2018. Phenotypic and genetic attributes conferring non-specific resistance genes against leaf and stripe rusts on wheat. Doctoral dissertation, University of Agriculture, Faisalabad. DOI: 10.13140/RG.2.2.18511.92324
- Regression analysis by example. New York: John Wiley & Sons. Inc.; 2000. [Google Scholar]
- Integration of cultivar resistance and fungicide application for control of wheat stripe rust. Can. J. Plant Pathol.. 2014;36:311-326.
- [Google Scholar]
- Chen, X.M., Wang, M.N., Wan, A.M., Cheng, P. and Cheng, J.J., 2012. Sexual or asexual reproduction, which one is more important for stripe rust. In Disease Risk and Food Security. Proceedings of the 13th International Cereal Rust and Powdery Mildew Conference pp. 36-37. Beijing: China Agricultural Science and Technology Press. [Google Scholar].
- Wheat stripe (yellow) rust caused by P uccinia striiformis f. sp. tritici. Mol. Plant Pathol.. 2014;15(5):433-446.
- [Google Scholar]
- Comparative effects of temperature and interrupted wet periods on germination, penetration, and infection of Puccinia recondita f. sp. tritici and P. striiformis on wheat seedlings. Phytopathology. 1995;85(4):409-415.
- [Google Scholar]
- A threshold-based weather model for predicting stripe rust infection in winter wheat. Plant Dis.. 2017;101(5):693-703.
- [Google Scholar]
- Environmental conditions associated with stripe rust in Kansas winter wheat. Plant Dis.. 2016;100(11):2306-2312.
- [Google Scholar]
- Hakro, A. and Khan, A., 2012. Role of yellow rust-resistance genes of wheat in Pakistan. In Meeting the Challenge of Yellow Rust in Cereal Crops. p. 127.
- Hovmøller, M.S., Walter, S. and Justesen, A.F., 2010. Escalating threat of wheat rusts. Science 329(5990), 369-369.
- Century-old mystery of Puccinia striiformis life history solved with the identification of Berberis as an alternate host. Phytopathology. 2010;100(5):432-435.
- [Google Scholar]
- Differential sensitivity among Puccinia striiformis f. sp. tritici isolates to propiconazole and pyraclostrobin fungicides. Canadian J. Plant Pathol.. 2019;41(3):415-434.
- [Google Scholar]
- Yellow rust (Puccinia striiformis): a serious threat to wheat production worldwide. Not. Sci. Biol.. 2018;10(3):410-423.
- [Google Scholar]
- Khushboo, S.S., Gupta, V., Pandit, D., Abrol, S., Choskit, D., Farooq, S., and Hussain, R., 2021. Epidemiology of Stripe Rust of Wheat: A Review. 0(01), 1158-1172
- Development of weather-based prediction models for leaf rust in wheat in the Indo-Gangetic plains of India. Eur. J. Plant Pathol.. 2014;140(3):429-440.
- [Google Scholar]
- Lyon, B., and Broders, K., 2017. Impact of climate change and race evolution on the epidemiology and ecology of stripe rust in central and eastern USA and Canada. 39(4), 385-392
- Plant disease forecasting in the era of climate change: trends and applications. In: Recent Approaches for Management of Plant Diseases. New Delhi: Indian Phytopathological Society; 2018. p. :1-26.
- [Google Scholar]
- First incursion of the warrior race of wheat stripe rust (Puccinia striiformis f. sp. tritici) to Turkey in 2014. Plant Dis.. 2016;100(2):528.
- [Google Scholar]
- Model-based forecasting of agricultural crop disease risk at the regional scale, integrating airborne inoculum, environmental, and satellite-based monitoring data. Front. Environ. Sci.. 2018;6:63.
- [CrossRef] [Google Scholar]
- Pathogenic specialization of Puccinia recondita f. sp. tritici in Australia and New Zealand in 1990 and 1991. Aust. Plant Pathol.. 1991;25(1):12-17.
- [Google Scholar]
- Pathogenic specialization of wheat rusts in Australia and New Zealand in 1988 and 1989. Aus. J. Plant Pathol.. 1992;21:61-69.
- [Google Scholar]
- A diagrammatic scale for estimating rust intensity of leaves and stems of cereals. Can. J. Res.. 1948;26:496-500.
- [Google Scholar]
- PUCREC/PUCTRI–a decision support system for the control of leaf rust of winter wheat and winter rye. EPPO Bull.. 2007;37(2):378-382.
- [Google Scholar]
- Effect of growth stage and initial inoculum level on leaf rust development and yield loss caused by Puccinia recondita f. sp. tritici. J. Phytopathol.. 1989;127(3):200-210.
- [Google Scholar]
- Rapilly, F., Fournet, J., 1968. Observation sur la dissémination de Puccinia striiformis, enfonction del’humidité relative, relation avec la structure morphologique des urédospores. Proceedings of the Cereal Rust Conference, Oeiras, Portugal: Tip. AnvaÂrioComercõÁal de Portugal 26-29.
- Premières étudessur la rétention de spores fongiques par des épidermes foliaires. Ann. Phytopathol.. 1976;8:31-40.
- [Google Scholar]
- Singh, R.P., Hodson, D.P., Huerta-Espino, J., Jin, Y., Njau, P., Wanyera, R., Herrera-Foessel, S.A., Ward, R.W., 2008. Will Stem Rust Destroy the World's Wheat Crop? In Advances in Agronomy; Academic Press: Cambridge, MA, USA 98, 271-309
- Principles and Procedures of Statistics: A Biometrical Approach. New York: McGraw-Hill; 1997.
- Steyerberg, E.W., 2016. FRANK E. HARRELL, Jr., Regression Modeling Strategies: With Applications, to Linear Models, Logistic and Ordinal Regression, and Survival Analysis, Heidelberg: Springer.
- Wang, M.N. and Chen, X.M., 2013. First report of Oregon grape (Mahonia aquifolium) as an alternate host for the wheat stripe rust pathogen (Puccinia striiformis f. sp. tritici) under artificial inoculation. Plant Dis. 97(6), 839-839.
Appendix A
Supplementary material
Supplementary data to this article can be found online at https://doi.org/10.1016/j.jksus.2023.102591.
Appendix A
Supplementary material
The following are the Supplementary data to this article:


