

Translate this page into:
Physical properties of PEG coated Y doped ZnO nanoparticles and their potential as high gamma dose thermoluminescence material
⁎Corresponding author. thongbo@kku.ac.th (Thongchai Botmart)
-
Received: ,
Accepted: ,
This article was originally published by Elsevier and was migrated to Scientific Scholar after the change of Publisher.
Peer review under responsibility of King Saud University.
Abstract
Objectives
The purpose of this research is to synthesize the Yttrium doped PEG-coated ZnO nanostructures and characterize them especially as thermoluminescence material for gamma dosimetry. The dosimetry characteristics were evaluated by irradiating the sample with gamma radiation with different doses (10 and 100 Gray) at a temperature range of 0–400 °C.
Methods
Uncoated undoped ZnO NPs and PEG-coated ZnO Nanoparticles (NPs) with 0, 5, 7, and 10 at% Yttrium (Y) doping concentration were synthesized via hydrothermal technique. Synthesized nanoparticles were examined through various characterization techniques (XRD, SEM, EDS, UV, Tyndall test and TLD) for their morphology, PEG-coating confirmation and to evaluate their Thermoluminescence properties.
Results
XRD analysis confirmed the wurtzite hexagonal structure and doping of Yttrium into ZnO. SEM analysis showed PEG-coated ZnO has well-rounded nanoplates <100 nm confirming the successful growth inhibition of PEG working as surfactant. The particle size was found to grows with increasing Y concentration. UV visible results reveal an increase in the optical band gap of ZnO with Yttrium doping. With doping, TL response has enhanced significantly, and glow peak shifted towards higher temperature. TL analysis showed two broad peaks following the second-order of kinetics and five traps with activation energies 1.25, 0.87, 0.75, 0.82, 1.99 eV, present in the Y doped ZnO.
Conclusions
Y doped ZnO is a suitable candidate for high-dose thermoluminescence dosimetry.
Keywords
TLD
Hydrothermal
Doped
Gamma dosimetry
Thermoluminescence

- TLD
-
Thermoluminescence dosimeter
- UV
-
Ultraviolet
- FOK
-
First-order kinetics
- PEG
-
Polyethylene Glycol
- SOK
-
Second-order kinetic
- PL
-
Photoluminescence
Abbreviations
1 Introduction
The quest for an efficient, sensitive, and versatile phosphor is never-ending owing to their ever-emerging use in optical dating, high power LEDs, fluid temperature sensors (Huntley et al., 1985; Chung and Nam, 2019; Salah, 2015; Abram et al., 2018), etc. This quest has produced many attractive phosphors among which ZnO has been the focus of researchers worldwide because of its facile synthesis, high binding energy (60 meV), broader bandgap (∼3.35 eV) (Kumaresan et al., 2017a; Hjiri et al., 2017; Bekeny et al., 2006; Williams and Kamat, 2009) potential uses as sensors, fast scintillators, transparent conductive electrodes, particle detectors (Grigorjeva et al., 2015; Liu et al., 2013; Neal et al., 2009). But pure ZnO has little to low potential for the above-mentioned application in its intrinsic form, due to its weak optical characteristics (Talam et al., 2012; Kumaresan et al., 2017a,b), doping can, however, enhance ZnO potential for the above-mentioned applications (Kumaresan et al., 2017b). Özgür et al. showed extensive studies for assessing chemical, optical, physical, electrical, thermal, and mechanical characteristics of ZnO (Ozgür et al., 2005). Recently, doped ZnO NPs has attracted researchers attention as a thermoluminescent material and has been evaluated for its thermoluminescence by doping with Silver, Magnesium Gadolinium etc. (Abraheem et al., 2021; Isik and Gasanly, 2019; Thabit et al., 2021). The luminescence of phosphor can be shifted from the UV region to the lower region by employing doping techniques (Dhar et al., 2005).Fig. 1.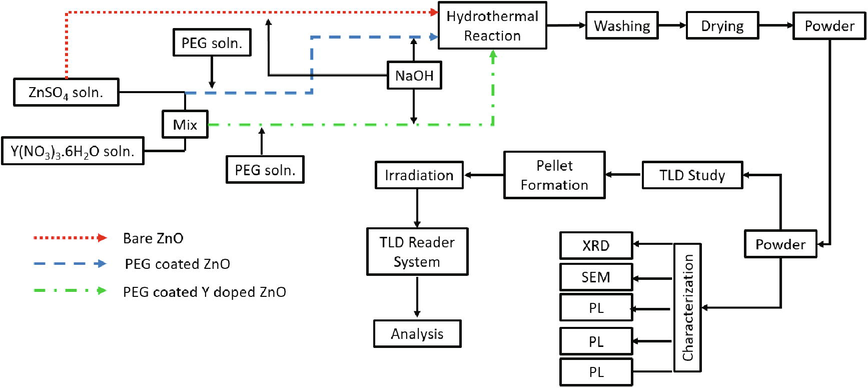
Schematic diagram of work being done.
ZnO nanomaterials have been fabricated by using innovative methods to get different morphology and dimensions (Zhang et al., 2009). The yield of nanostructures in large amounts is a challenge and hence there is a need for the development of new technologies for material fabrication (Nickel et al., 2006). Chemical methods for the synthesis of nano-materials are found to be superior in terms of cost and control of synthesis parameters. ZnO nanoparticles have enormous applications (Huang et al., 2001; Ali et al., 2015; Atif et al., 2011a, 2011b, 2014; Fakhar-e-Alam et al., 2011a, 2011b, 2012; Fakhar-E-Alam et al., 2014; Ibupoto et al., 2013; Iqbal et al., 2019; Khun et al., 2013; Willander et al., 2014) owing to their quantum confinement effect, enhanced surface area, and surface energy (Sun et al., 2007). Recently, researchers have been keen to explore the quantum size effects of doping on material physical properties. Several studies have shown the effects of doping of different metals in ZnO and its enhanced properties for gas sensing, optoelectronics and photocatalysis, dielectric and ferroelectric properties (Goel et al., 2018, Bharat et al., 2019). Dopants are used to modulate material properties in desirable ways, due to which these play an important role in semiconductor devices. Among doping materials, trivalent lanthnide elements as dopants have attracted a lot of attention due to the use of end products in major fields including solar applications and thermoluminescence properties (Liu et al., 2007).
Optical energy bandgaps, conductivity, and band structure influence by Y doping and its potential use as a gas sensor have been studied (not making sense, needs rephrasing) (Jia et al., 2009). Yogamalar et al. have prepared ZnO: Y through hydrothermal route and discussed bandgap narrowing in materials employing different dopant concentrations using UV–vis (Yogamalar et al., 2012). Morphological changes observed through SEM and TEM were related to dopant concentration in their study. Zheng, et al. prepared Yttrium-doped ZnO nanoparticles via a sol–gel method that exhibited increased photoluminescence and enhanced UV emission (Zheng et al., 2012). A bunch of nano-geometries have been developed by using Y as a dopant in ZnO with versatile applications of each shape like Nanosheets as piezo-electric devices (Sinha et al., 2018), nanorods as a catalyst for acetone (Yu et al., 2013), and nanospheres as gas sensors (Guo et al., 2013).
Detectors working on Thermoluminescence principal are termed Thermoluminescence Dosimeters (TLD). Dosimeters are employed in detecting dose for food sterilization, preservation, material processing, and personnel (Kalpana et al., 2017; Sanyal et al., 2019). TLDs are preferred as they can act as human tissue equivalent which makes them perfect for dose measurement purposes (Dubey et al., 2014). Common TLD materials made up of ceramics, crystals and phosphors have the problem of fast fading, saturation, moisture attack, difficulty in annealing, and opaque nature (Dubey et al., 2014; Swamy et al., 2014; Saidu et al., 2018). Thabit et al. used a co-doping technique employing silver as co-dopant in ZnO: Y nanoparticles obtaining nano-flowers and nano-rod geometry showing some promising results to use it as a TLD dosimeter.
Based on these studies, this study aims at a systematic investigation of Y doping in PEG-coated ZnO and its effect on morphology, crystal structure, Special focus is given to the potential of these nanostructures as TLD materials for measuring gamma irradiation dose. Hydrothermal synthesis was chosen in this study owing to its better compositional and morphological control (Yoshimura and Sōmiya, 1999). The results suggest that PEG coating and Y doping both affect profoundly the morphology and luminescence characteristics of the nanostructure. These promising results suggest that ZnO: Y can be a good dosimeter for high-dose applications like irradiation of foods and seeds.
2 Materials and methods
Zinc sulfate heptahydrate (ZnSO4·7H2O) Sigma Aldrich 99.99%, Sodium Hydroxide (NaOH) 99.99%, Yttrium Oxide (Y2O3), commercially available Nitric Acid(HNO3), PEG were used for the preparation of pure and doped material. Pure and Y doped ZnO materials (of 0, 5, 7, 10 mol%) were prepared through the hydrothermal method (Gupta et al., 2014).
For a typical reaction 60 ml of 0.5 M ZnSO4·7H2O aqueous solution was prepared using de-ionized water, pH of the solution was maintained using NaOH. The solution was then moved to the hydrothermal autoclave for the reaction at 150 °C for 8 h. After cooling, particles were collected and washed with deionized water. NPs were obtained by drying them in an oven at 80–90 °C for 12 h, the product obtained was converted to a fine powder using mortar and pestle. For PEG-coated products, the same procedure was repeated with equal volumes of ZnSO4·7H2O and PEG. In the synthesis of yttrium (Y) doped ZnO NPs above procedure was repeated with Y(NO3)3 as an additional precursor. The summary of synthesis is provided in Table 1 with suitable Labeling for each sample. Molarity was calculated by the following equation:
Terms
Conc. (M)
Quantity (ml)
Required Weight (g)
Y Doping
ZnSO4.7H2O
Y(NO3)3.6H2O
ZnSO4.7H2O
PEG
Y(NO3)3.6H2O
ZnSO4.7H2O
PEG
Y(NO3)3.6H2O
0 at.%
UCZ
0.5
0
30
30
0
4.31
3
0
0 at.%
CY0Z
0.5
0
30
30
0
4.31
3
0
5 at.%
CY5Z
0.475
0.025
25
25
10
3.41
2.5
0.0957
7 at.%
CY7Z
0.465
0.035
25
25
10
3.34
2.5
0.134
10 at.%
CY10Z
0.45
0.05
25
25
10
3.23
2.5
0.192
2.1 Characterization techniques
Structural characterization of the prepared samples were done using X-ray diffraction (Philips X'Pert Pro MPD) with Cu Kα radiation (λ = 1.54 Å). EDS was performed for qualitative analysis, UV–Vis analysis for bandgaps, and Tyndall test. The morphological studies were done using SEM (FESEM, MAIA-3, TESEAN) with an electron beam of 10 kV. TL studies were done for prepared pellets using the TL RA94 reader available at the lab facility. Spent FUEL PARR-1 (Pakistan Research Reactor-I) was used as gamma radiation source.
3 Results
The Y doped ZnO nanostructures were characterized structurally using XRD, SEM, and EDS, the thermoluminescence performance was evaluated thermoluminescence dosimetry (TLD). Fig. 2(a) represents the XRD patterns for different doped samples, the crystallite data for these samples is represented in Fig. 2(b). The SEM images for the as-synthesized samples were performed for particle size and morphology analysis, as shown in Fig. 3. The EDS was done to confirm Y doping (Fig. 4). Finally, the photoluminescence and dosimetry characterization of the samples was done to evaluate the TLD performance of the samples. Fig. 4(b) represents the Tyndall effect of the Y doped samples, Fig. 5 shows the UV–Vis absorption and bandgap data whereas Fig. 6 and Fig. 7 demonstrate the TLD response of the samples after gamma irradiation.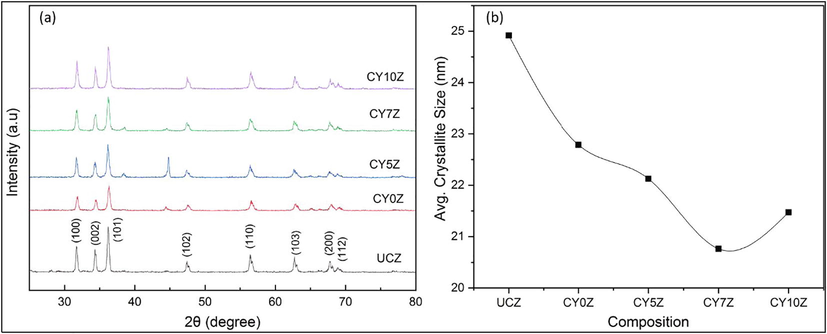
(a) XRD patterns and (b) average crystallite size of uncoated (UCZ), PEG coated Y doped ZnO NPs prepared hydrothermally (CY0Z, CY5Z, CY7Z, and CY10Z).
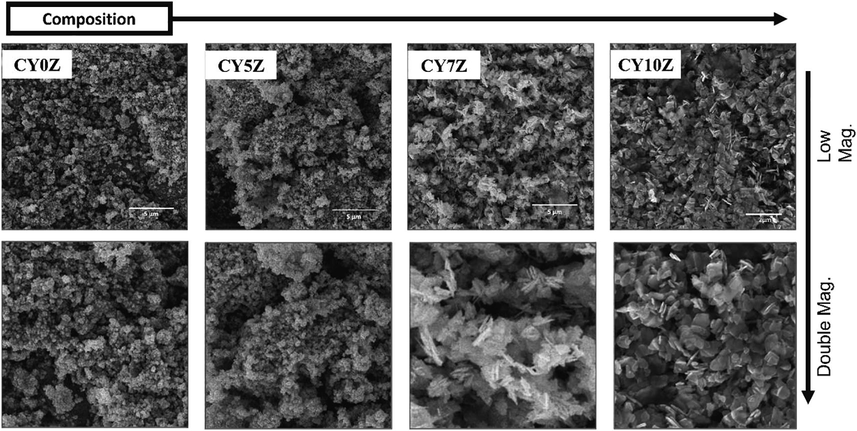
SEM images of CY0Z, CY5Z, CY7Z, and CY10Z NPs.
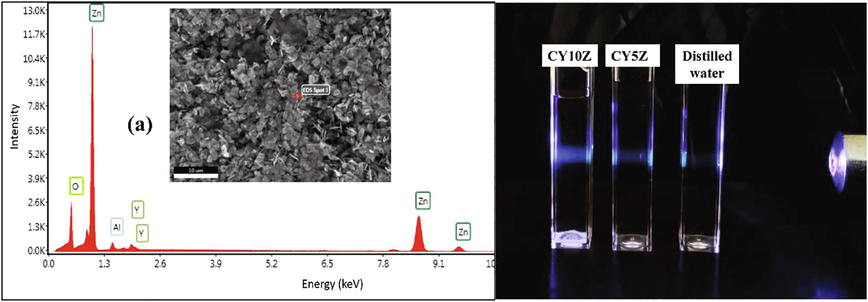
(a) EDS of 10 at% Y doped ZnO sample, (b) Tyndall effect for CY10Z and CY5Z NPs.
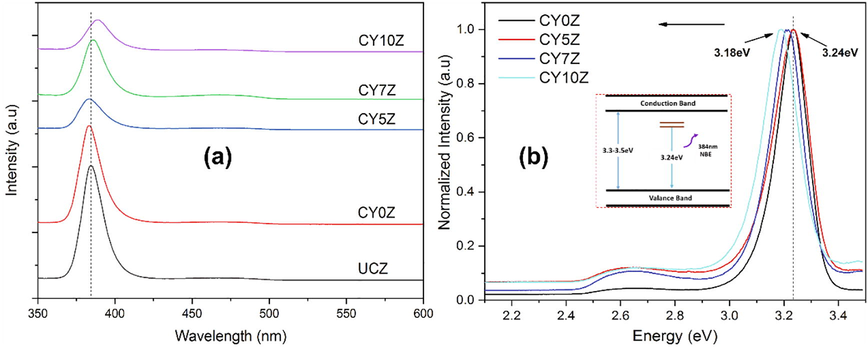
(a) UV–Vis spectra of prepared samples; (b) Badgap energy plot fro PEG-coated samples.
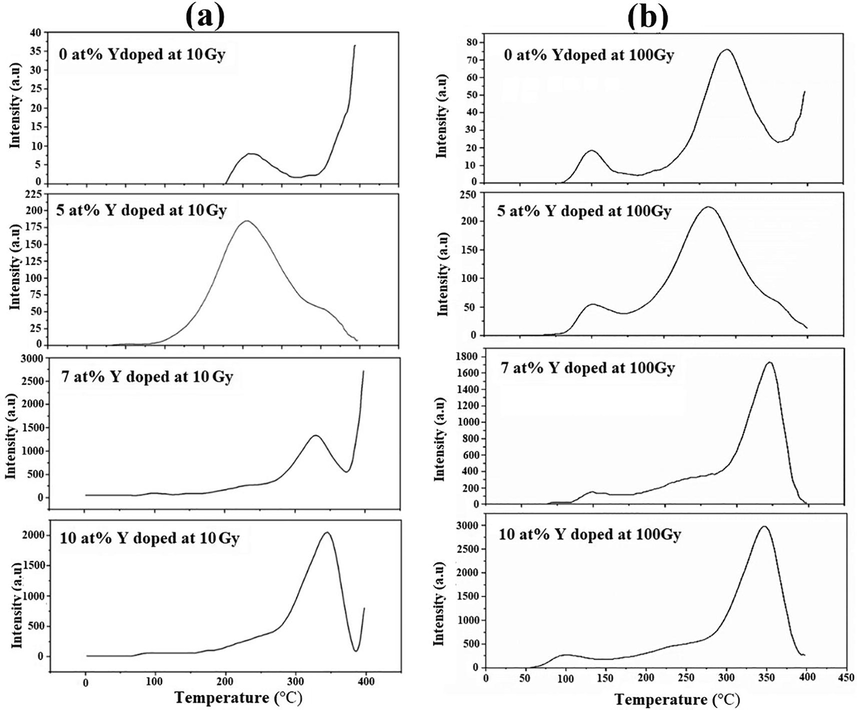
TLD response of Y doped NPs at (a) 10 Gy dose (left column) and (b) 100 Gy dose (right column).
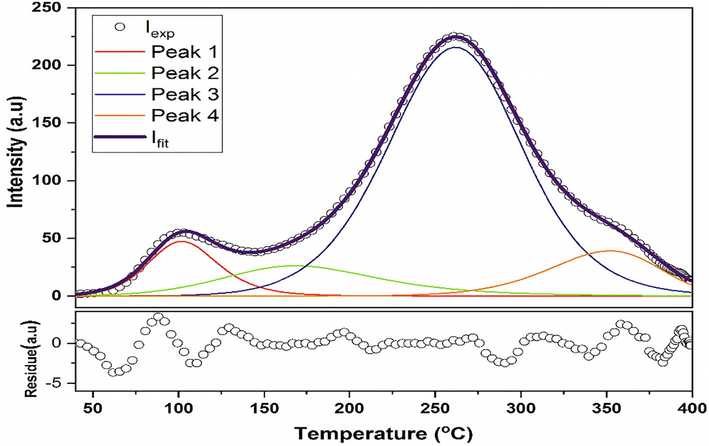
Deconvoluted peak of TLD response for 5 at% Y doped ZnO for 100 Gy dose.
4 Discussion
XRD patterns of UCZ, CY0Z, CY5Z, CY7Z, and CY10Z NPs have been shown in Fig. 2(a). XRD patterns of these synthesized specimens are in agreement with the standard JCPDS (card no. 00-036-1451). There is no extra peak that depicts the presence of any external impurity or phase. The average crystallite size is plotted in Fig. 2(b). It is observed from the index pattern that peaks of doped materials (CY0Z, CY5Z, CY7Z, and CY10Z) got broadened as compared to uncoated ZnO peaks depicting reduction in crystal sizes which is in agreement with calculated crystallite sizes. It also demonstrates PEG's potential as a good surfactant for synthesizing nanocrystals of small size. The doped ZnO peaks have clearly shifted towards the lower 2θ value; the maximum shift was observed for CY7Z NPs. This is evidence of increased interplanar spacing thus marking successful doping of Y in ZnO lattice as Y+3 substitute and occupy Zn+2 ions site in lattice(Cheng et al., 2008).
SEM micrographs of PEG-coated ZnO CY0Z, CY5Z, CY7Z, and CY10Z are shown in Fig. 3. Size of particle varied from 100 to 500 nm, with morphology varying from irregular plates and rods to well-rounded plates and then needles. PEG-coated doped ZnO NPs with low doping concentration have small particle size of ∼ 100 nm while higher doping concentration leads to the larger size of ∼400 nm size and a plate and rod-like morphology. An increase in particle size can be attributed to the high concentrations of Y ions. This doping dependent change is morphology and size of NPs has been observed before by many researchers (Zamiri et al., 2014; Ishaq et al., 2013; Shanmugam et al., 2015).
Fig. 4(a) shows an EDS study for 10 at% Yttrium doped ZnO nanoparticles material. EDS analysis confirmed the presence of only Zinc (Zn), Yttrium (Y), Oxygen (O) in the specimen. Tyndall test was performed for two doped samples (CY10Z and CY5Z). Tyndall effect shows very good colloidal stability of these NPs which attributes to the good PEG-Coating on these NPs.
UV visible spectra of CY0Z, CY5Z, CY7Z, and CY10Z NPs is shown in Fig. 4(a). Characteristic absorption edge is observed at ∼383 nm, which is also a confirmation for the ZnO. UV visible spectra exhibit a blue shift with an increase in the Y concentration as a dopant; indicating that the optical band gap has increased. Yttrium oxide (Y2O3) has a larger optical band gap (5.5 eV) as compared to pure ZnO (∼3.24ev).
The sharp peak at 434 cm−1 shows the crystallization and wurtzite structure of ZnO crystals. This increase in optical band gap is then logically true as with doping of Y ions, optical band increases. In actual, due to the presence of the Yttrium 4d levels in the conduction band (CB), some zinc (Zn) 4s and 4p levels will exchange with the forbidden band which consequently introduces impurity states (Wang et al., 2015).
Thermoluminescence glow peaks for undoped and doped specimens have been shown in Fig. 6(a), (b) for 10 Gy, and 100 Gy. Two broad peaks; at ∼100 °C and ∼250 °C were observed in the glow curves of CY0Z and CY5Z specimens. For CY7Z and CY10Z specimens peak shifted towards higher temperatures; observed at ∼325 °C. If linearity is the concern, then Y ion concentration below 5 at% could play a role and can be optimized. TL phenomenon in pure ZnO is due to the presence of oxygen defects (Oi). Reduction in particle size increases the number of surface states and consequently increases the amount of recombining charge carriers.
The enhancement in the thermoluminescence (TL) intensity is attributed to possible recombination centers generated as defects between valence and conduction band in Zn(1-x)YxO. The forbidden bandgap is reduced for Zn(1-x)YxO owing to the doping of Y ions. The 4d of yttrium states are set in the conduction band (CB), whereas the Zinc (Zn) levels 4 s and 4p will move to the bandgap to generate defects. Furthermore, the ionic radius of Y+3 (0.9 Å) is slightly greater than that of Zn+2 (0.74 Å). When Y+3 replaces and occupies Zn+2 ions in the crystal lattice of ZnO, the space between neighboring planes expands, causing lattice distortion and multiple interstitial defects, which results in intermediate traps. This is also confirmed by the observed blue shift in UV visible spectrum. Thus a drastic increase in the radiative transitions occurs due to e-h pairs recombination (Wang et al., 2015, Thabit et al., 2021). At higher Y ions concentrations, TL response decrease with increasing gamma radiation dose. It can be attributed to fact that increasing dopant concentration, might lead to the pile-up of Y atoms and the creation of the Y-Y-O cluster at grain boundaries. This Y-Y-O boundary produces a quenching effect and kills electrons, consequently, reducing TL (Wang et al., 2015).
TL peak with maximum intensity is located at ∼250 °C is the stable glow peak. Stable glow peak shifted towards higher temperature with increasing Y doping concentrations. The stability of this peak is mainly attributed to the presence of deep traps. Whereas the peak located at a lower temperature ∼100 °C is owing to the shallow traps that lead to an unstable peak. This peak is of no importance for TL dosimetry applications as it will fade quickly and result in information loss.
Fig. 7 shows the deconvolution of the representative glow curve of CY5Z at 100 Gy to study the kinetics parameters of TL. It is displaying deconvoluted results obtained by applying the first-order kinetics (FOK) model. FOK results have a high figure of merit (FOM) = ∼16% which is unacceptable (FOM must be ∼1%). While the second-order kinetics (SOK) model gave 1.3% FOM. It shows Z(1-x)YxO follows the second-order of kinetics (SOK) and there are a total of five small peaks within the broad peaks of the glow curve. These sub-peaks are providing information about the total number of traps present. Calculated kinetic parameters have been shown in Table 2.
Parameter
Peak #1
Peak #2
Peak #3
Peak #4
Peak #5
TL Kinetic Model
SOK
SOK
SOK
SOK
SOK
Imax (a.u.)
33.9
33.5
28.6
220.6
27.1
Tmax (°C)
93.3
116.5
175.9
260.4
355.2
Eg (eV)
1.25
0.87
0.75
0.82
1.99
Frequency Factor (s−1)
1.75 × 10¹⁶
1.3 × 10¹⁰
1.1 × 10⁷
1.8 × 10⁶
5.1 × 10¹⁴
Though Yttrium doping improves the thermoluminescence intensity of ZnO however at higher Y concentrations (>5 at%), it imparts a negative effect and deteriorates intensity at high doses.
5 Conclusions
The uncoated pure ZnO and PEG (Polyethylene glycol) coated Yttrium (Y) doped ZnO was synthesized successfully via hydrothermal reaction. PEG coating proved a good surfactant and efficiently reduced particle size, but with increasing Y ion concentration beyond 5 at% particle size increased. PEG-coated Y doped nanoparticles exhibit variation in morphology from rod-like and plate-like and a mixture of these with size ranges in 100 nm to 400 nm. Y ion doping has altered the optical band gap of ZnO; the optical band gap increased with increasing dopant concentrations. Thermoluminescence response enhanced significantly with increasing Y doping. TL spectra displayed two broad glow peaks: at ∼100 °C (unstable) and ∼250 °C (stable peak). An increase in Y ion concentration enhances the TL intensity of stable peak and shift it towards higher temperature (∼325 °C). Doping concentrations above 5 at% led to compromise on linearity. Deconvolution of broad peaks indicated the presence of five different traps with trap depth 1.25, 0.87, 0.75, 0.82, 1.99 eV, in the Y doped ZnO which followed the second-order of kinetics. In conclusion, Y doped ZnO nanoparticles were investigated which leads to the conclusion that these nanostructured materials are suitable for dosimetry applications.
Acknowledgement
Researchers Supporting Project number (RSP-2021/397), King Saud University, Riyadh, Saudi Arabia.
Declaration of Competing Interest
The authors declare that they have no known competing financial interests or personal relationships that could have appeared to influence the work reported in this paper.
References
- Temperature measurement techniques for gas and liquid flows using thermographic phosphor tracer particles. Progr. Energy Combust. Sci.. 2018;64:93-156.
- [Google Scholar]
- Structural and optical properties of pure and Ag doped ZnO thin films obtained by sol gel spin coating technique. Mater. Sci. Pol.. 2015;33
- [CrossRef] [Google Scholar]
- The synthesis and optical characterization of well aligned ZnO nanorods using seed layer of Mn3O4 nanoparticles. Optoelectron. Adv. Mater. Rapid Commun. 2014:8.
- [Google Scholar]
- Role of sensitivity of zinc oxide nanorods (ZnO-NRs) based photosensitizers in hepatocellular site of biological tissue. Laser Phys.. 2011;21:1950-1961.
- [CrossRef] [Google Scholar]
- Role of sensitivity of zinc oxide nanorods (ZnO-NRs) based photosensitizers in hepatocellular site of biological tissue. Laser Phys.. 2011;21(11):1950-1961.
- [Google Scholar]
- Bekeny, C., Voss, T., Gafsi, H., Gutowski, J., Postels, B., Kreye, M. and Waag, A., 2006. Origin of the near-band-edge photoluminescence emission in aqueous chemically grown ZnO nanorods. Journal of applied physics, 100(10), p.104317.
- Synthesis of doped zinc oxide nanoparticles: a review. Mater. Today:. Proc.. 2019;11:767-775.
- [Google Scholar]
- Plus green emission of ZnO nanorods induced by Ce3+ doping and concentration. J. Photochem. Photobiol., A. 2008;195(2–3):151-155.
- [Google Scholar]
- A review on phosphor in glass as a high power LED color converter. ECS J. Solid State Sci. Technol.. 2019;9(1):016010
- [Google Scholar]
- Effect of Eu3+ concentration on photoluminescence and thermoluminescence behavior of YBO3: Eu3+ phosphor. Superlattices Microstruct.. 2014;67:156-171.
- [Google Scholar]
- Phototoxic effects of zinc oxide nanowires (ZnO NWs) complexed with 5-ALA in RD Cell Line. Laser Phys.. 2011;21(12):2165-2170.
- [Google Scholar]
- Phototoxic effects of zinc oxide nanowires (ZnO NWs) complexed with 5-ALA in RD cell line. Laser Phys.. 2011;21:2165-2170.
- [CrossRef] [Google Scholar]
- The photodynamic effect of ZnO nanorods and their ligands with different photosensitizers. Rev. Nanosci. Nanotechnol.. 2012;1:40-51.
- [CrossRef] [Google Scholar]
- ZnO nanoparticles as drug delivery agent for photodynamic therapy. Laser Phys. Lett.. 2014;11(2):025601.
- [Google Scholar]
- 2D porous nanosheets of Y-doped ZnO for dielectric and ferroelectric applications. J. Mater. Sci.: Mater. Electron.. 2018;29(16):13818-13832.
- [Google Scholar]
- Gas sensitive luminescence of ZnO coatings obtained by plazma electrolytic oxidation. Sens. Actuators, A. 2015;234:290-293.
- [Google Scholar]
- Hollow, porous, and yttrium functionalized ZnO nanospheres with enhanced gas-sensing performances. Sens. Actuators, B. 2013;178:53-62.
- [Google Scholar]
- International conference on advances in manufacturing and materials engineering. Proc. Mater. Sci.. 2014;5:198-203.
- [Google Scholar]
- Doped-ZnO nanoparticles for selective gas sensors. J. Mater. Sci.: Mater. Electron.. 2017;28(13):9667-9674.
- [Google Scholar]
- Catalytic growth of zinc oxide nanowires by vapor transport. Adv. Mater.. 2001;13(2):113-116.
- [Google Scholar]
- Well aligned ZnO nanorods growth on the gold coated glass substrate by aqueous chemical growth method using seed layer of Fe3O4 and Co3O4 nanoparticles. J. Cryst. Growth. 2013;368:39-46.
- [Google Scholar]
- Empirical modeling of Zn/ZnO nanoparticles decorated/conjugated with Fotolon (Chlorine e6) based photodynamic therapy towards liver cancer treatment. Micromachines. 2019;10(1):60.
- [Google Scholar]
- Synthesis, characterization and luminescence properties of Y-doped and Tb-doped ZnO nanocrystals. Mater. Sci. Eng., B. 2009;162(3):179-184.
- [Google Scholar]
- Thermoluminescence features of alumina-mixed borophosphate glasses with Tb3+ ions for dosimetric applications. Int. J. Appl. Glass Sci.. 2017;8(2):188-195.
- [Google Scholar]
- Fabrication of well-aligned ZnO nanorods using a composite seed layer of ZnO nanoparticles and chitosan polymer. Materials (Basel). 2013;6(10):4361-4374.
- [Google Scholar]
- A Novel one-step synthesis of Ag-doped ZnO nanoparticles for high performance photo-catalytic applications. J. Mater. Sci.: Mater. Electron.. 2017;28(8):5872-5879.
- [Google Scholar]
- Synthesis and systematic investigations of Al and Cu-doped ZnO nanoparticles and its structural, optical and photo-catalytic properties. J. Mater. Sci.: Mater. Electron.. 2017;28(13):9199-9205.
- [Google Scholar]
- Influence of Y3+ doping on structure and electrochemical performance of layered Li1. 05V3O8. Trans. Nonferrous Met. Soc. China. 2007;17(1):110-115.
- [Google Scholar]
- Liu, Y., Li, Y. and Zeng, H., 2013. ZnO-based transparent conductive thin films: doping, performance, and processing. J. Nanomater., 2013.
- Investigation of ZnO-based polycrystalline ceramic scintillators for use as $\alpha $-particle detectors. IEEE Trans. Nucl. Sci.. 2009;56(3):892-898.
- [Google Scholar]
- Nickel, N.H., Terukov, E. eds., 2006. Zinc oxide-A material for micro-and optoelectronic applications: Proceedings of the NATO Advanced Research Workshop on Zinc Oxide as a Material for Micro-and Optoelectronic Applications, held in St. Petersburg, Russia, from 23 to 25 June 2004 (Vol. 194). Springer Science & Business Media.
- A comprehensive review of ZnO materials and devices. J. Appl. Phys.. 2005;98(4):11.
- [Google Scholar]
- Thermoluminescence response of rare earth activated zinc lithium borate glass. Radiat. Phys. Chem.. 2018;144:413-418.
- [Google Scholar]
- Thermoluminesence of gamma rays irradiated CaSO4 nanorods doped with different elements. Radiat. Phys. Chem.. 2015;106:40-45.
- [Google Scholar]
- Thermoluminescence and electron paramagnetic resonance study on rare earth/transition metal doped lithium borate glasses for dosimetry applications. J. Lumin.. 2019;216:116725
- [Google Scholar]
- Y-doped ZnO nanosheets: Gigantic piezoelectric response for an ultra-sensitive flexible piezoelectric nanogenerator. Ceram. Int.. 2018;44(7):8582-8590.
- [Google Scholar]
- ZnO nanoparticle size-dependent excitation of surface Raman signal from adsorbed molecules: Observation of a charge-transfer resonance. Appl. Phys. Lett.. 2007;91(22):221106
- [Google Scholar]
- Influence of copper ions on thermoluminescence characteristics of CaF2–B2O3–P2O5 glass system. Ceram. Int.. 2014;40(2):3707-3713.
- [Google Scholar]
- Synthesis, structural, optical, and thermoluminescence properties of ZnO/Ag/Y nanopowders for electronic and dosimetry applications. Ceram. Int.. 2021;47(3):4249-4256.
- [Google Scholar]
- The electronic structures and optical properties of yttrium-doped zinc oxide with zinc interstitial defects calculated by first-principles. Mater. Sci. Semicond. Process.. 2015;36:36-42.
- [Google Scholar]
- Willander, M., Nur, O., Fakhr-e-Alam, M., Atif, M., AlSalhi, M.S., 2014. ZnO nanostructures: Toxicity and phototoxicity characteristics in biological samples, Zinc Oxide Nanostructures: Advances and Applications. https://doi.org/10.4032/9789814411349
- Graphene− semiconductor nanocomposites: excited-state interactions between ZnO nanoparticles and graphene oxide. Langmuir. 2009;25(24):13869-13873.
- [Google Scholar]
- Synthesis, characterization, and spectroscopic properties of ZnO nanoparticles. ISRN Nanotechnol.. 2012;2012:372505
- [CrossRef] [Google Scholar]
- Dopant induced bandgap narrowing in Y-doped zinc oxide nanostructures. J. Nanosci. Nanotechnol.. 2012;12(1):75-83.
- [Google Scholar]
- Hydrothermal synthesis of crystallized nano-particles of rare earth-doped zirconia and hafnia. Mater. Chem. Phys.. 1999;61(1):1-8.
- [Google Scholar]
- Yu, P., Wang, J., Du, H.Y., Yao, P.J., Hao, Y. and Li, X.G., 2013. Y-doped ZnO nanorods by hydrothermal method and their acetone gas sensitivity. J. Nanomater., 2013.
- Morphology-controlled synthesis and a comparative study of the physical properties of SnO2 nanostructures: from ultrathin nanowires to ultrawide nanobelts. Nanotechnology. 2009;20(13):135605
- [Google Scholar]
- Enhanced UV emission of Y-doped ZnO nanoparticles. Appl. Surf. Sci.. 2012;258(18):6735-6738.
- [Google Scholar]
Appendix A
Supplementary data
Supplementary data to this article can be found online at https://doi.org/10.1016/j.jksus.2022.101958.
Appendix A
Supplementary data
The following are the Supplementary data to this article:


