

Parametric optimization of durable sheeting fabric using Taguchi Grey Relational Analysis
⁎Corresponding author. hafsa@ntu.edu.pk (Hafsa Jamshaid)
-
Received: ,
Accepted: ,
This article was originally published by Elsevier and was migrated to Scientific Scholar after the change of Publisher.
Peer review under responsibility of King Saud University.
Abstract
Objectives
The present work describes the application of Taguchi Grey Relational Analysis in order to optimize the durability of sheeting fabrics. The existing study investigates the multi-response optimization of certain parameters of yarn process including FL, RS and RT on tensile strength, tear strength and abrasion resistance of durable fabric sheets after washing.
Methods
In the development process L9 orthogonal array in Taguchi design was used. The results have been analyzed by using statistical multi-response optimization technique, grey relational analysis to set the process parameters and to decide the simultaneous optimization of responses including tensile strength, tear strength and abrasion resistance. In addition, the analysis of variance (ANOVA) was used to determine the most significant factors. Reference sheeting fabric with same construction parameters was also tested.
Results
The results show a greater improvement in parameters of developed samples quality. The experimental results show parameter fiber length has the most significant effect on the multiple performance characteristics.
Conclusions
The developed fabric sheet having durable life would help to reduce consumption of resources of both consumers and manufacturers. Manufacturers can have great chance to establish their image and can increase the profit margin over products. Therefore, the integration of grey relational analysis and the Taguchi Method can be applicable for the optimization of process parameters and help to conserve resources by extending the lifetime of sheeting fabrics.
Keywords
Durability
Sheeting fabrics
Ring yarn
Resource conservation
Taguchi method
Grey relational analysis

1 Introduction
The global demand of textiles products is increasing day by day due to number of factors, it may be due to population growth, economic growth, fashion trends etc. 24% of textile fiber used for textile related production is dominated by cotton which is considered as thirsty plant associated with water depletion (Bellon-Maurel et al., 2014). Textile processes have strong impact on resource utilization and environment with respect of 4Ms (men, material, machinery and money) for energy utilization for different process land utilization, water consumption, and toxic emissions especially in wet treatment process and production of yarn/fabrics by using fossils fuels which cause emission such as co2 and particulate (Roos et al., 2015). Extending the lifetime of textile for resource conservation can have substantial environmental benefits by avoiding the production of new textiles (Raj et al., 2021).
Durability plays a key role in saving the environment by saving resources, reducing waste and the impact of repairs and replacements on the environment (Farrant et al., 2010). Unfortunately, there is not much literature available on the specific improvement of washing durability. Researchers compared the effect of laboratory-controlled washing and home laundering on selected natural and synthetic fabrics (Sandin and Peters, 2018). In reported literature, the researchers’ main focus was on parameters like extensibility, compression, bending, shear, tensile, abrasion resistance, pilling friction coefficient, smoothness of fiber, yarn and fabric. These values relate with the washing ability of fabric (Hunter, 1968; Stamminger et al., 2018). A study was done to determine the effect of various weave types i.e., plain, twill and satin on abrasive strength of cotton fabric at three laundering intervals such as at 5, 10 and 15. From the study, plain weave results was concluded best in terms of abrasive strength (Brorens et al., 1992).
No work has been reported so far on multiple process parameters of ring yarn by using the Taguchi method and grey relational analysis for improving washing durability of fabric sheet which is the aim of current study. Although in few studies the grey –Taguchi method has been used for rotor yarn quality optimization (Ahmad and Jamshaid, 2019; Palaniswamy and Mohamed, 2006; Manich et al., 2001).
Taguchi’s orthogonal arrays are highly fractional orthogonal designs are proposed by researchers (Ijaz et al., 2020). The literature shows that the addressing multi-response problem with the Taguchi method is still an issue (Su et al., 2011). The grey relational analysis (GRA), proposed by researchers (Hasani et al., 2012) has attracted many researchers in recent past in various field of manufacturing for solving problems, where complex interrelationship between multi objectives (Hussain et al., 2017). It is an extension to the original Taguchi method for multi-response optimization (Badkar et al., 2011).
The novelty of this study is to improve the washing durability of sheeting fabric by doing some changes at yarn level. It describes the application of Taguchi Grey Relational Analysis in order to optimize the durability of sheeting fabrics. L9 orthogonal array in Taguchi design was used. The results have been analyzed by using statistical multi-response optimization technique, grey relational analysis to set the process parameters and to decide the simultaneous optimization of responses including tensile strength, tear strength and abrasion resistance.
2 Experimental
2.1 Materials
Pakistani Cotton fiber of 28 mm taken from market is blended with polyester fiber which was taken from ICI Pakistan, of three Fiber length i.e., 32 mm, 38 mm, 44 mm to make three (60:40) CVC blended yarn of 40/1 Ne of Twist multiplier (TM) 3.83.
Three factors, Fiber Length (FL), Ring Speed (RS) and Rewinding Tension (RT) were identified to study their effect on washing durability of fabric. The factors and their levels affecting the durability of the fabric sheet considered for the present study is given in Table 1.
| Factor | Code | Unit | Level 1 | Level 2 | Level 3 |
|---|---|---|---|---|---|
| FL | A | mm | 32 | 38 | 44 |
| RS | B | rpm | 17,000 | 18,000 | 19,000 |
| RT | C | tex/cN | 240 | 280 | 320 |
2.2 Taguchi method
The SN ratio, in Taguchi method, is the ratio of mean to noise (variation) of the quality parameter of the response and are generally identified as nominal-the-better, lower-the better and higher-the better (Haq et al., 2008; Ribeiro et al., 2010).
For nominal-the-better,
For lower-the-better,
For higher-the-better,
The normalized equation for SN ratios nominal-the-better (Eq. (4)), higher-the-better (Eq. (5)), and lower-the-better (Eq. (6)) respectively are as follows:
The quality loss function values of signal to noise ratio values of each response are converted to normal signal to noise ratios scaled into (0,1) interval prior to further analysis so that the variability among different responses may reduce.
2.3 GRA method
Grey relational analysis (GRA) devised by researchers is an efficient tool for solving inter-relationships among quality characteristics of multiple responses (Pandey and Panda, 2015), in this method grey grades are measured as MRPI, and the steps given below are followed for the computation of multi-response performance index (MRPI) values.
Step 1: Evaluate SN ratios,
Step 2: Normalize SN ratios named as Zij (0 ≤ Zij ≤ 1) of all the responses subject to the quality characteristics of each response using (Eq. (4) - (6)).
Step 3: Evaluate quality loss functions values using the Eq. (7).
Step 4: Obtain the grey relational coefficient (
Step 5: Evaluate the grey relational grade (Gi).
2.4 Analysis of variance (ANOVA)
Analysis of variance method is well known series of statistical methods developed by researchers (Liu and Forrest, 2007; Raza et al., 2014). The F-value is defined as the ratio of factor mean square to the mean square error, usually, a factor with larger F-value has significant effect on performance of process.
2.5 Development of fabric sheet
Fabric was made on CCI sample loom Evergreen (China). The construction is 40 × 40/130 × 64 plain weave where warp and weft linear density is 40 s and ends/cm is 55 and picks/cm is 25.
2.6 Scouring & bleaching
All the samples were scour and bleach in hydrogen peroxide (H2O2): 35 g/liter, caustic soda 10 g/liter, stabilizer 4 g/liter and Soap 2 g/liter.
2.7 Yarn testing
All the yarn testing were conducted as per international standards. Single yarn strength test was conducted on Uster Tensojet as per ASTM D 2256-02, and hairiness test was done on Zweigle 566 hairiness tester as per ASTM D 5647-07.
2.8 Washing test
All the samples were tested before and after 40 and 80 washes respectively. The accelerated laundering was done on, Laundr-o-Meter (Gyro wash) Tc-M-25 as per AATCC 61-2013.
2.9 Strength test
Tensile testing of all fabric samples was done by strip method on TITAN TNT 0086 as per ASTM 5035 standard method. Tear strength was measured by falling-pendulum on Elma digital tear tester as per ASTM 1424-9(2019) standard.
2.10 Abrasion resistance test
Abrasion resistance test was carried out at Martindale M-235-4 at 12 KPa as according to BS EN ISO 12947-1 standard method.
3 Results and discussion
3.1 Yarn testing
All the yarn testing was done after ring spinning and before winding for cone formation for weaving. The results are shown in Fig. 1.
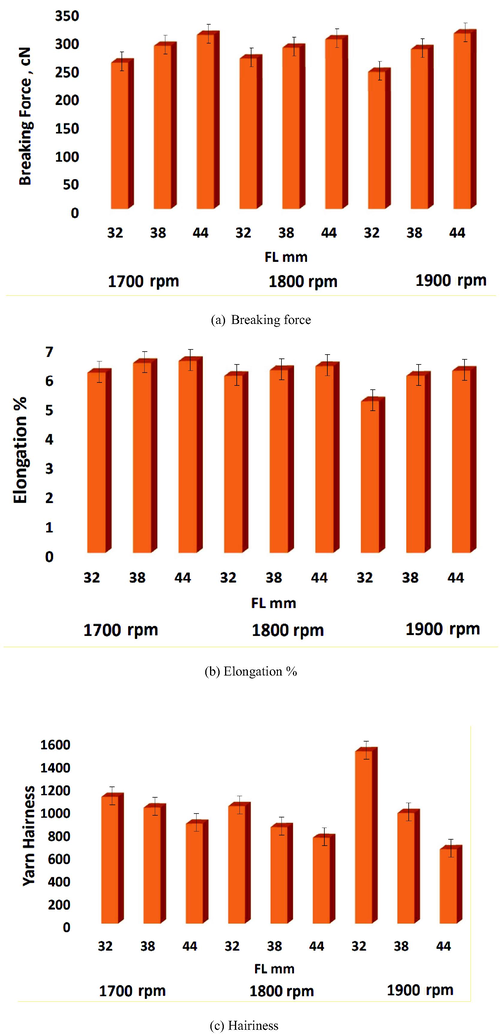
- Results of yarn tests
3.2 Breaking force
It can be seen from Fig. 1 that as the spindle speed increases, the breaking force first increases and then begins to decrease. While at further higher spindle speed i.e. 1900 rpm, the frictional/rubbing force between the yarn surface and the various parts of the machine increases, and therefore the surface fibers are more abraded and protrude from the yarn surface. Thus, while tensile testing of yarn the protruding fibres do not bear the load properly.
3.3 Elongation at break %
From Fig. 1 elongation is decreasing with increase of spindle speed. Reduction of elongation %is due to the reason explained earlier. As the length of the fibers increases.
3.4 Hairiness
It is clear that longer the FL, smaller will be the hairiness. As the RS increase from certain level, greater will be the hairiness. This is explained by the fact that as the spindle speed increase that leads to increase in spinning tension and facilitation of better twist flow till front roller, resulting in shorter spinning triangle. But at the higher level of spindle speed, more rubbing of yarn surfaces which leads to higher yarn hairiness.
3.5 Fabric testing
Nine samples with construction parameters e.g., 40 × 40/ 130 × 64 plain weave, with 15 Tex linear density, 55 ends/cm and 25 picks/cm were developed. All the nine samples and reference (R) samples were also tested for all performance properties before washing as shown in Fig. 2.
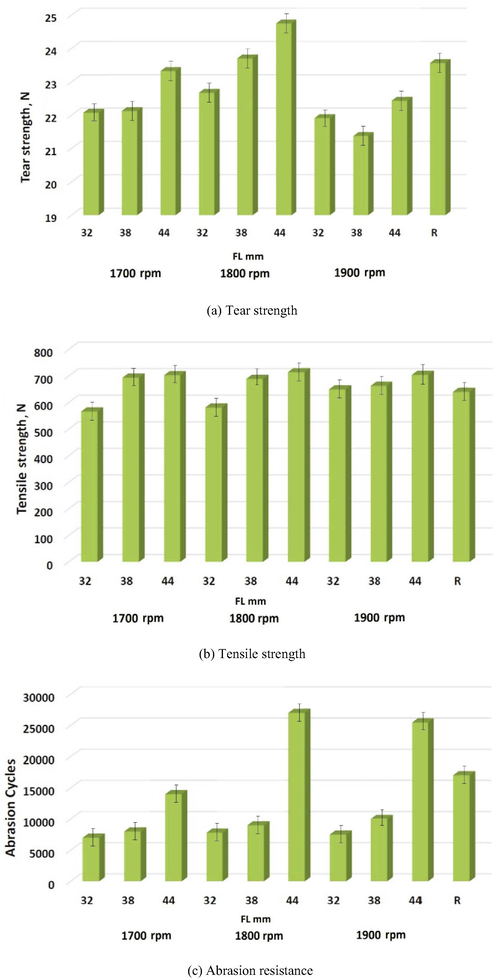
- Performance characteristics of sheeting fabrics before washing.
Fig. 2(a) shows that fabric from yarn with longer fibers exhibits higher tear force. At 1800 r.p.m which is optimum speed, fabric sample has maximum tear force.
It is clear from Fig. 2(b) that as FL increases in yarn tensile strength of fabric increased. Tensile strength of fabric is observed exhibiting high values on optimum RS and long FL because long fiber can efficiently overlap the yarn structure as well as strong interlocking of core fibers is vital.
From Fig. 2(c) it is clear that as RS increases, abrasion resistance increases. Optimum level of RS is 1800 r.p.m, where we have maximum abrasion resistance. Abrasion resistance of fabric samples having longer fiber with medium RS (1800 rpm) has highest abrasion resistance.
All the samples were tested after 40 and 80 washes. The tear strength and tensile strength of reference sample after 40 washes was 16.54 cN and 690 N respectively. After 80 washes, tear strength was 14.37 N, tensile strength 695 N and abrasion resistance was 8500 cycles. The factors and responses for L9 orthogonal array are given in Table 2.
| Run | FL (mm) | RS (rpm) | RT (tex/cN) | Tear/40 (N) | Tensile/40 (N) | Tear/80 (N) | Tensile/80 (N) | Abrasion cycle/80 |
|---|---|---|---|---|---|---|---|---|
| 1 | 32 | 17,000 | 240 | 15.54 | 639.10 | 15.58 | 644.76 | 4000 |
| 2 | 32 | 18,000 | 280 | 14.96 | 647.18 | 15.23 | 625.34 | 4500 |
| 3 | 32 | 19,000 | 320 | 14.94 | 599.11 | 15.41 | 616.31 | 4500 |
| 4 | 38 | 17,000 | 280 | 15.61 | 727.40 | 16.39 | 679.16 | 5000 |
| 5 | 38 | 18,000 | 320 | 16.60 | 749.70 | 16.79 | 685.33 | 9100 |
| 6 | 38 | 19,000 | 240 | 16.37 | 719.49 | 16.14 | 666.74 | 6000 |
| 7 | 44 | 17,000 | 320 | 17.26 | 711.56 | 17.00 | 740.52 | 9500 |
| 8 | 44 | 18,000 | 240 | 18.09 | 774.04 | 17.62 | 832.65 | 17,500 |
| 9 | 44 | 19,000 | 280 | 16.69 | 689.84 | 16.56 | 674.44 | 15,500 |
3.6 Tear strength
The effects of factors on all the single responses are shown in Fig. 4 Under the L9 OA, after 40 washes, with the increase of FL from 32 mm to 44 mm the tear strength increased from 15 N to 17.35 N (Fig. 3) Similar behavior was observed after 80 washes.
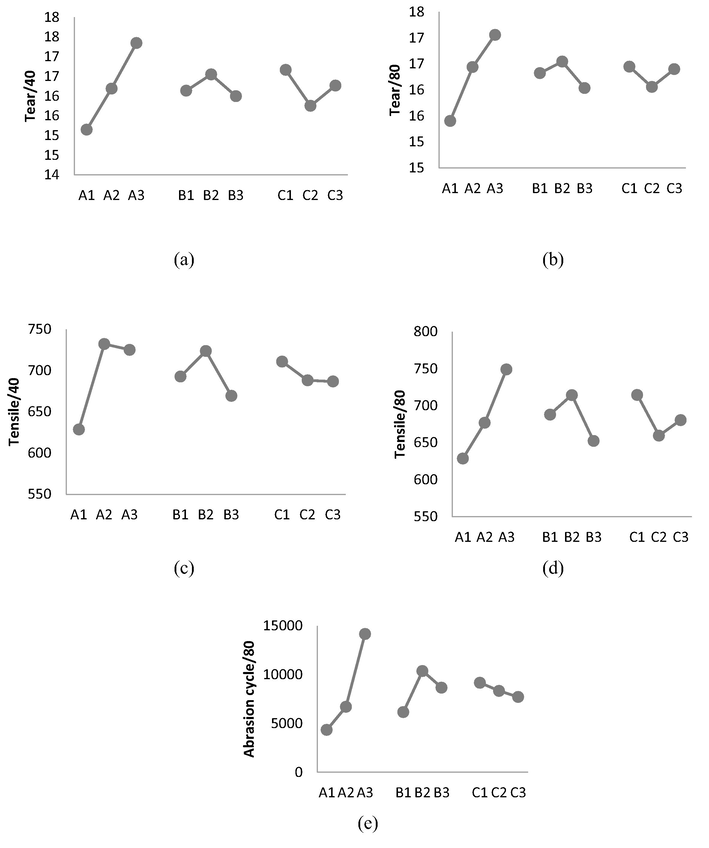
- Effects of factors on (a) tear/40, (b) tear/80, (c) tensile/40, (d) tensile/80, and (e) abrasion cycle/80.
Tear Strength of the fabric slightly increased from 16.14 to 16.55 N as spindle speed increased from 1700 to 1800 r.p.m but further increase in speed from 1800 to 1900 r.p.m resulted in decreased from 16.55 to 16 N (The reason behind this phenomenon is that as spinning tension increases with the increase of spindle speed. As traveler speed increases which leads to increase of frictional forces causes fiber damages. This ultimately reduces tensile, tear strength and abrasion resistance.
The tear strength of the fabric decreased with the increase of RT from 240 to 280 tex/cN and further increase in RT from 280 to 320 tex/cN, resulted in increase in tear strength from 15.75 to 16.27 N. This can be explained as RT increased, forces on yarn increased which reduces its flexibility while after certain limit of RT (C3), weak places is yarn reduces which improve the overall strength properties.
3.7 Tensile strength
The tensile strength of the fabric sheet after 40 washes increased from 628 to 732 N with the increase of FL from 32 to 38 mm and then slightly decrease to 725 N with further increase in FL from 38 to 44 mm. But after 80 washes tensile strength gradually increased from 628 to 749 N with the increase of FL from 32 to 44 mm as shown in Fig. 3. The reason behind this may be after 40 washes the fibers arrangement in yarn was distorted. But after 80 washes it may be due to increase in inter-fiber frictional forces which increases tensile strength with increase in FL.
3.8 Abrasion resistance
The resistance of fabric gradually increased from 4333 to 14,166 cycles with the increase of FL from 32 to 44 mm as longer fibers lead to less hairiness, which helps in more abrasion cycles. With the increase of spindle speed from 1700 to 1800 rpm, abrasion resistance first decreased and then further increased. Increase of speed from 1800 to 1900 rpm leads to decreased abrasion resistance due to reason explained before. With the increase of RT from 240 to 320 tex/cN, abrasion cycle was reduced from 9166 to 7700 cycles due to reduction of elongation of yarn which reduces its flexibility.
3.9 Taguchi method
For multiple characteristics of performance, Taguchi method could be used for optimizing process parameters (Rehman et al., 2015; Deng, 1989; Iudeepan et al., 2014; Ahmad et al., 2017; Gauri and Pal, 2010; Nalbant et al., 2007). In the present study there are three input variables, according to the Taguchi design L9 orthogonal array is employed for the design of experiment, three replicates of each run were computed and the average of these three values is taken into consideration (Table 2).
3.10 Grey relational analysis
The methodology of GRA discussed before was employed step-by-step to get the results.
Step 1: Computed the S/N ratio values of the responses, Tear/40, Tensile/40, Tear/80, Tensile/80, and Abrasion cycle/80 using one of the Eqs. (1)–(3) depending upon the quality characteristics, either higher, lower or nominal the better. The computed S/N ratio values of each response are given in Table 3.
| S/N | S/N Ratio | Normalized S/N ratios | ||||||||
|---|---|---|---|---|---|---|---|---|---|---|
| Tear/40 | Tensile/40 | Tear/80 | Tensile/80 | Abrasion cycle/80 | Tear/40 | Tensile/40 | Tear/80 | Tensile/80 | Abrasion cycle/80 | |
| 1 | 23.825 | 56.111 | 23.846 | 56.187 | 72.021 | 0.204 | 0.252 | 0.177 | 0.151 | 0.000 |
| 2 | 23.493 | 56.220 | 23.615 | 55.921 | 73.042 | 0.004 | 0.301 | 0.000 | 0.050 | 0.080 |
| 3 | 23.487 | 55.549 | 23.740 | 55.792 | 73.037 | 0.000 | 0.000 | 0.096 | 0.000 | 0.079 |
| 4 | 23.864 | 57.235 | 24.290 | 56.637 | 73.968 | 0.227 | 0.758 | 0.518 | 0.323 | 0.152 |
| 5 | 24.396 | 57.498 | 24.487 | 56.716 | 79.176 | 0.548 | 0.876 | 0.669 | 0.353 | 0.558 |
| 6 | 24.280 | 57.139 | 24.134 | 56.479 | 75.559 | 0.479 | 0.715 | 0.398 | 0.263 | 0.276 |
| 7 | 24.731 | 57.044 | 24.606 | 57.389 | 79.554 | 0.750 | 0.672 | 0.760 | 0.611 | 0.587 |
| 8 | 25.145 | 57.774 | 24.919 | 58.407 | 84.847 | 1.000 | 1.000 | 1.000 | 1.000 | 1.000 |
| 9 | 24.449 | 56.775 | 24.380 | 56.577 | 83.797 | 0.580 | 0.551 | 0.587 | 0.300 | 0.918 |
The S/N ratios were expressed as higher-the- better in the case of Tear/40, Tensile/40, Tear/80, Tensile/80, and Abrasion cycle/80. In other words, the durable life of the developed fabric sheet which causes the reduction of cost and labour along with optimized process parameters. These considerations have been done with respect to greater quality characteristics of interest.
Step 2: In this step, normalized S/N ratio values of each response were calculated using Eq. (4)–(5) according to the relevant characteristic to determine the GRA for the series of comparable characteristics. In the normalized S/N ratio, the data is made dimensionless using lower bound, or upper bound or moderate effectiveness. The results of normalized S/N rations of each response are given in Table 3.
Step 3: Quality loss function values based on the results computed in the previous step, were calculated in this step to measure the quality characteristic using the Eq.
| SN | Tear /40 | Tensile /40 | Tea r/80 | Tensile /80 | Abrasion cycle/80 | ΔY1 | ΔY2 | ΔY3 | ΔY4 | ΔY5 | GCY1 | GCY2 | GCY3 | GCY4 | GCY5 | Gi |
|---|---|---|---|---|---|---|---|---|---|---|---|---|---|---|---|---|
| 1 | 0.204 | 0.252 | 0.177 | 0.151 | 0.000 | 0.796 | 0.748 | 0.823 | 0.849 | 1.000 | 0.557 | 0.572 | 0.549 | 0.541 | 0.500 | 0.544 |
| 2 | 0.004 | 0.301 | 0.000 | 0.050 | 0.080 | 0.996 | 0.699 | 1.000 | 0.950 | 0.920 | 0.501 | 0.589 | 0.500 | 0.513 | 0.521 | 0.525 |
| 3 | 0.000 | 0.000 | 0.096 | 0.000 | 0.079 | 1.000 | 1.000 | 0.904 | 1.000 | 0.921 | 0.500 | 0.500 | 0.525 | 0.500 | 0.521 | 0.509 |
| 4 | 0.227 | 0.758 | 0.518 | 0.323 | 0.152 | 0.773 | 0.242 | 0.482 | 0.677 | 0.848 | 0.564 | 0.805 | 0.675 | 0.596 | 0.541 | 0.636 |
| 5 | 0.548 | 0.876 | 0.669 | 0.353 | 0.558 | 0.452 | 0.124 | 0.331 | 0.647 | 0.442 | 0.689 | 0.889 | 0.751 | 0.607 | 0.693 | 0.726 |
| 6 | 0.479 | 0.715 | 0.398 | 0.263 | 0.276 | 0.521 | 0.285 | 0.602 | 0.737 | 0.724 | 0.657 | 0.778 | 0.624 | 0.576 | 0.580 | 0.643 |
| 7 | 0.750 | 0.672 | 0.760 | 0.611 | 0.587 | 0.250 | 0.328 | 0.240 | 0.389 | 0.413 | 0.800 | 0.753 | 0.807 | 0.720 | 0.708 | 0.757 |
| 8 | 1.000 | 1.000 | 1.000 | 1.000 | 1.000 | 0.000 | 0.000 | 0.000 | 0.000 | 0.000 | 1.000 | 1.000 | 1.000 | 1.000 | 1.000 | 1.000 |
| 9 | 0.580 | 0.551 | 0.587 | 0.300 | 0.918 | 0.420 | 0.449 | 0.413 | 0.700 | 0.082 | 0.704 | 0.690 | 0.708 | 0.588 | 0.924 | 0.723 |
Step 4: In this step grey relational coefficients were computed to represent the best and actual normalized S/N ratios of all the responses using Eq. (7) and the results are shown in Table 4.
Step 5: Based on the grey relational coefficients, grey grades were computed by taking average of the grey coefficients of corresponding to each responses using Eq. (8). The ranking of the series of the grey grades is the optimized recipe refer to the grey relational order, shown in Table 4.
Step 6: Main effects of the predicted values of the responses were computed from the results obtained in step 5. Total mean of the grey grade values is summarized in Table 5. Fig. 4 represents the percentage contribution of the process parameters in the development of the fabric sheet with specified quality characteristics.
| Levels | |||
|---|---|---|---|
| Factors | 1 | 2 | 3 |
| FL (mm) | 0.526 | 0.668 | 0.827 |
| RS (rpm) | 0.646 | 0.750 | 0.625 |
| RT (g/tex) | 0.729 | 0.628 | 0.664 |
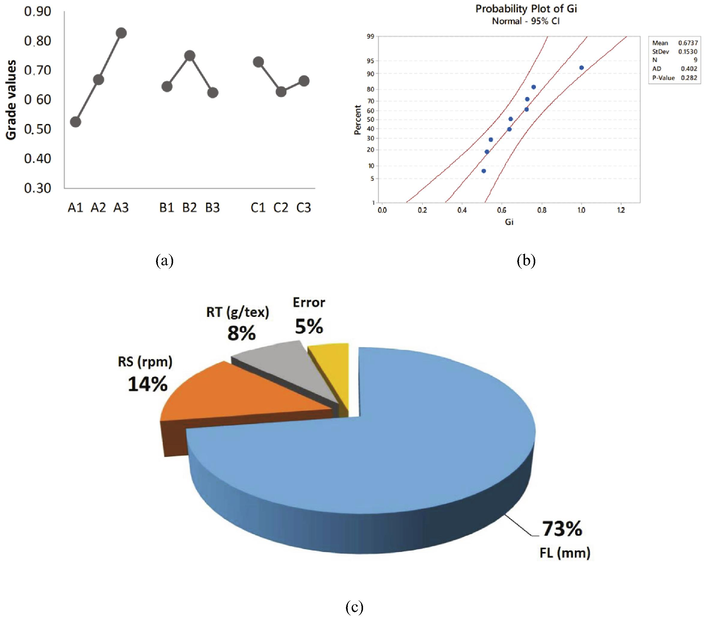
- (a) Effects of factors on the grade values and (b) plots of normal probability of Gi, and (c) percentage contribution of factors in the grey relational grade.
Step 7: Finally, based on the grey grade values of all combined responses shown in Table 5 and Fig. 4, we may obtain the optimal process parameters as A3B2C1 i.e., a FL of 44 mm, RS of 18000 rpm and RT of 240 tex/cN. Table 5 compares the experimental results of the optimal parameter.
3.11 Analysis of variance
The ANOVA analysis given in Table 6 and the percentage contribution for each term affecting GRG (Fig. 4) showed that the FL and RS are the significant process parameters affecting the multiple performance characteristics. Furthermore, FL is the most significant process parameter due to its highest percentage contribution (of 73%).
| Factor | SS | df | MS | F-Test | % Contribution |
|---|---|---|---|---|---|
| A | 0.1357 | 2 | 0.0679 | 16.05 | 72.58 |
| B | 0.0271 | 2 | 0.0135 | 3.20 | 14.49 |
| C | 0.0157 | 2 | 0.0079 | 1.86 | 8.41 |
| Error | 0.0085 | 2 | 0.0042 | 4.52 | |
| Total | 0.1870 | 8 |
4 Conclusions
The present study is an approach of integrating the Taguchi method and the multi-response technique GRA to investigate the optimal process parameters to achieve the durability functions of sheeting fabric. Initially, the outcome of varying three factor –namely FL, RS and RT on the multiple responses of the tensile strength, tear strength and abrasion resistance after 40 and 80 washes was analyzed using Taguchi, L9 OA and GRA approach. From the response table of GRE grades, the optimal sets of parameters for durability of fabric sheeting were identified. The ANOVA for GRA shows that FL (FL) has been the most significant factor followed by RS (RS) and then RT (RT).
Sheeting fabric having yarn of PET 44 mm FL and spun at slow RS provides the best results. With reference to the RS, 18,000 rpm is more feasible and economical among all the three testing RSs regarding commercial point of view. So, 44 mm FL, 18000 rpm RS and 280 tex/cN RT is concluded to be the best parameters after analyzing through the results. Min and max values in abrasion test is 7000 cycles and 27,000 cycles which means 27,000 RPM is 385.7% better than 7000 RPM (1st sample). The silent feature of the present study is the minimum number of experimental trials under Taguchi method integrated with GRA.
This paper presents an effective method for the optimization of ring spun yarn process parameters for washing durability of fabric sheets with multi response parameters based on GRA. This will cause the enhancement of manufacturer’s market significance by satisfying customers.
Acknowledgements
The authors would also like to acknowledge National Textile University, Pakistan for support.
Funding
N/A.
Declaration of Competing Interest
The authors declare that they have no known competing financial interests or personal relationships that could have appeared to influence the work reported in this paper.
References
- Streamlining life cycle inventory data generation in agriculture using traceability data and information and communication technologies – part I: concepts and technical basis. J. Clean. Prod.. 2014;69:60-66.
- [CrossRef] [Google Scholar]
- Is unbleached cotton better than bleached? Exploring the limits of life cycle assessment in the textile sector. Cloth. Text. Res. J.. 2015;3(44):231-247.
- [CrossRef] [Google Scholar]
- Remediation of textile effluents for water reuse: Decolorization and desalination using Escherichia fergusonii followed by detoxification with activated charcoal. J. Environ. Manag.. 2021;277(1):111406
- [CrossRef] [Google Scholar]
- Environmental benefits from reusing clothes. Intl. J. Life Cycle Assess.. 2010;15:726-736.
- [CrossRef] [Google Scholar]
- Environmental impact of textile reuse and recycling – A review. J. Clean. Prod.. 2018;184:353-365.
- [CrossRef] [Google Scholar]
- Factors affecting the performance and appearance of laundered synthetic fabrics. J. Am. Oil Chem. Soc.. 1968;45(5):362-366.
- [Google Scholar]
- Towards a durability test for washing machines. Resour. Conserv. Recycl.. 2018;2018(131):206-215.
- [CrossRef] [Google Scholar]
- Studies on the abrasion resistance of weaving yarns. J. Text. I. 1992;83:126-134.
- [CrossRef] [Google Scholar]
- Development of thermo-physiologically comfortable knit structure for sports application. Tekstil. Konfeks.. 2019;29(2):105-112.
- [CrossRef] [Google Scholar]
- Effect of the single-yarn twist and ply to single-yarn twist ratio on the hairiness and abrasion resistance of cotton two-ply yarn. Autex. Res. J.. 2006;6(2):59-65.
- [Google Scholar]
- Abrasion kinetics of wool and blended fabric. Text. Res. J.. 2001;71:469-474.
- [CrossRef] [Google Scholar]
- Effect of weave type on abrasive strength of cotton fiber. Pure Appl. Biol.. 2020;9(3):1807-1812.
- [CrossRef] [Google Scholar]
- Improving the quality of combed yarn spun by OE rotor spinning using the grey-Taguchi method. Fibers Tex. East Eur.. 2011;19:23-29.
- [Google Scholar]
- Grey relational analysis to determine the optimum process parameters for Open-End spinning yarns. J. Eng. Fibers Fabr.. 2012;7:81-88.
- [CrossRef] [Google Scholar]
- Use of Taguchi method and grey relational analysis to optimize multiple yarn characteristics in Open-End rotor spinning. Autex. Res. J.. 2017;17(1):67-72.
- [CrossRef] [Google Scholar]
- Parameter optimization of laser transformation hardening by using Taguchi method and utility concept. Int. J. Adv. Manuf. Technol.. 2011;52:1067-1077.
- [CrossRef] [Google Scholar]
- Multi response optimization of machining parameters of drilling Al/SiC metal matrix composite using grey relational analysis in the Taguchi method. Int. J. Adv. Manuf. Technol.. 2008;37:250-255.
- [CrossRef] [Google Scholar]
- Simultaneous optimization of the micro extraction of coffee volatiles using response surface methodology and principal component analysis. Chemom. Intell. Lab. Syst.. 2010;102:45-142.
- [CrossRef] [Google Scholar]
- Optimization of turning operations with multiple performance characteristics using the Taguchi method and grey relational analysis. J. Mater. Process. Technol.. 2009;209:2753-2759.
- [CrossRef] [Google Scholar]
- Optimization of multiple quality characteristics in bone drilling using grey relational analysis. J. Orthop.. 2015;12:39-45.
- [CrossRef] [Google Scholar]
- The current developing status on grey system theory. J. Grey System. 2007;2:111-123.
- [Google Scholar]
- Multi-response optimization of rhamnolipid production using grey rational analysis in Taguchi method. Biotechnol. Rep.. 2014;3:86-94.
- [CrossRef] [Google Scholar]
- Multi-response optimization in enzymatic desizing of cotton fabric under various chemo-physical conditions using a Taguchi approach. Cellulose. 2015;22:2107-2116.
- [CrossRef] [Google Scholar]
- Study of friction and wear properties of ABS/Kaolin polymer composites using grey relational technique. Procedia Technol.. 2014;14:196-203.
- [CrossRef] [Google Scholar]
- Multi-objective optimization in the development of oil and water repellent cellulose fabric based on response surface methodology and the desirability function. Mater. Res. Exp.. 2017;4:035302
- [CrossRef] [Google Scholar]
- Comparison of performances of five prospective approaches for the multi-response optimization. Int. J. Adv. Manuf. Technol.. 2010;48(9–12):1205-1220.
- [CrossRef] [Google Scholar]
- Application of Taguchi method in the optimization of cutting parameters for surface roughness in turning. Mater. Des.. 2007;28(4):1379-1385.
- [CrossRef] [Google Scholar]


