

Translate this page into:
Oxygen and hydrogen stable isotopes as recharge indicators, Central Nile Delta Quaternary aquifer, Egypt
⁎Corresponding author. zenhomsalem@yahoo.com (Zenhom El-Said Salem),
-
Received: ,
Accepted: ,
This article was originally published by Elsevier and was migrated to Scientific Scholar after the change of Publisher.
Peer review under responsibility of King Saud University.
Abstract
This work aims to utilize oxygen and hydrogen stable isotopes as tracers for determining the groundwater sources of recharge in the central Nile delta. The analyzed water samples were collected from canals and drains as surface water, soil water and shallow, intermediate and deep zones of the groundwater. The isotopic data indicated that surface water samples have higher isotopic content than recent Nile river water (δ 18O = 2.39‰ and δ2H = 22‰) which reflect the influence of an evaporation process that takes place in surface water bodies during its flow. Soil water samples were affected by evaporation process during water infiltration via soil. It was estimated that soil water samples have higher enrichment isotopic contents than groundwater and less than surface and recent Nile water. Studied groundwater is composed of mixed source from groundwater recharged before and that recharged after High Dam construction. Few groundwater samples have depleted isotopic content which suggested a mixing source between the rainwater and the Nile River water before High Dam construction. The evaporation is indicated in the shallow groundwater by the deviation away from the global meteoric line. In the deep groundwater, more deviation from global meteoric line was noticed which reflects the effect of mixing between freshwater and seawater. The intermediate groundwater samples average line showed an intermediate deviation indicating the effect of both evaporation and seawater intrusion.
Keywords
Nile Delta
Quaternary aquifer
Stable isotopes
Groundwater recharge
Seawater intrusion

1 Introduction
Oxygen and hydrogen stable isotopic composition of rain water are instances of conservative and tracers that utilized broadly in the hydrologic research to examine complex frameworks (Craig, 1961; Doveri and Mussi, 2014; Salem et al., 2004a,b). In general, the relationships between rain water, surface water, and subsurface water are significant to understand the water cycle dynamics, which is of extraordinary scientific importance in the arid area for water resources developing and management. One of the most important benefits of the stable isotope technique is the water circulation investigation in the arid areas. The hydrogen and oxygen stable isotopes relationship in worldwide precipitation was portrayed by Craig (1961), the GMWL (Global Meteoric Water Line) was established and the mechanism of precipitation could be accurately clarified.
In contrast to the common used techniques for aquifer recharge estimation (e.g., water balance, lysimeters, and the Darcyan technique) which have some disadvantages, stable isotope technique is giving better determination of the recharge amount (Yeh et al., 2004). If the water oxygen and hydrogen stable isotopes are not subjected to fractionation during the hydrologic cycle, they are perfect conservative tracers to give knowledge about the aquifer recharge (Joel, 2010).
The utilization of δ18O and δ2H as ecological tracers can be limited based on how much the isotopic precipitation signature lessens before achieving the water table. Damping the signature of the water stable isotopes is very much characterized in clastic permeable sediments and is related to mixing processes occur in the vadose and near surface saturated depths (Noble and Ansari, 2019). However, in regions have thin or no overlying, weakening of the occasional rain signature might be negligible preceding flowing into the crack net-work (Gleeson et al., 2009).
After development of High Dam Nasser lake water reservoir, a vital change in release system of the Nile River water occurred amid hydrological years, so the groundwater system was impacted. Due to the kinetic effect of the evaporation on 18O and 2H of the stored water in Lake Naser, the ongoing recharge to the Nile valley and Nile Delta aquifers from the streams is portrayed by advanced 18O and 2H, low d– parameter and generally higher TDS. Older recharged groundwater has exhausted 18Oand 2H, high d– parameter and moderately low TDS (Awad et al., 1999; Salem, 2009; Salem et al., 2016).
2 Methodology
For stable isotopic investigation water was sampled from chosen destinations of the channel water, drain water, soil water and groundwater. Sample location maps are shown in Fig. 1 and the list of the stable isotopic analysis results is shown Tables 1. Samples were gathered unfiltered in clean polyethylene containers and fully filled. Extraordinary consideration was taken to guarantee that no air bubbles were caught in the bottles. The samples were put away far from light in a cool dry container and after that moved to the examination Lab. The isotopic analysis was performed in the Environmental Isotope Hydrology Central Laboratory, National Center for Nuclear Safety and Radiation Control, Atomic Energy Authority, Egypt. Thermo Quest Delta Plus mass spectrometer was utilized. The result values of δ18O and δ2H were expressed as “delta” (δ), which is expressed by per mil (‰) with respect to V-SMOW a reference.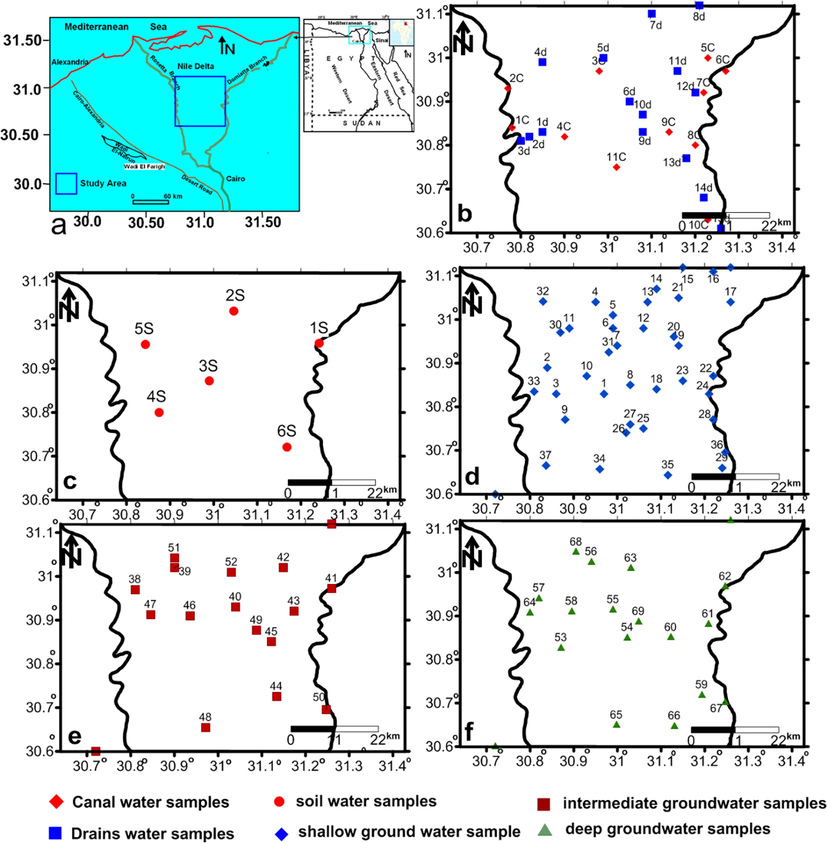
Maps show the location maps of study area (a) and the selected samples for the stable isotopic analysis for canals and drains (b), Soil water (c), shallow groundwater (d), intermediate groundwater (e) and deep groundwater (f).
Soil water
Sample No.
Min.
Max.
Mean.
Stand. Dev.
δ 18O‰
6
2.63
5.05
3.528333
0.819278
δD ‰
20.52
28.16
24.94
2.496534
d-excess‰
−12.24
0.16
−3.45333
4.497109
TDS (mg/l)
660
1950
1238.333
472.1617
Cl (mg/l)
85.11
354.61
228.4033
99.83744
Canals water
δ 18O‰
11
3.3
4.28
3.707273
0.339797
δD ‰
28.05
31.77
29.60455
1.14882
d-excess‰
−4.02
2.29
−0.05364
2.145806
TDS
262
483
359.2727
77.43138
Drains water
δ 18O‰
15
1.63
5.66
3.562667
0.987258
δD ‰
16.72
36.4
28.89733
4.931924
d-excess‰
−9.38
6.6
0.396
4.498147
TDS (mg/l)
397
1356
839.1333
230.0332
Shallow groundwater
δ 18O‰
37
−1.58
4.24
0.740811
1.213243
δD ‰
−5.23
28.53
10.04946
7.852593
d-excess‰
−8.88
9.8
4.120811
4.545794
TDS(mg/l)
210
6112
1001.682
1209.379
Cl (mg/l)
37.3
2499.2
308.7557
526.4301
Intermediate groundwater
δ 18O‰
15
−1.18
5.93
1.372667
1.739583
δD ‰
−2.07
30.06
12.37333
8.035807
d-excess‰
−17.38
9.76
1.392
7.201811
TDS (mg/l)
340
1940
683.9333
414.6836
Cl (mg/l)
56.6
867.8
163.2847
526.4301
Deep groundwater
δ 18O‰
17
−0.78
5.01
2.284118
1.476902
δD ‰
−9.23
29.46
12.88882
9.334034
d-excess‰
−14.07
2.01
−5.38412
4.48702
TDS (mg/l)
180
1940
676.0588
465.1213
Cl (mg/l)
24.47
688
182.2053
179.2223
3 Hydrogeology
The Quaternary Nile Delta aquifer was geologically, hydrogeologically and hydrogeochemically investigated widely. Several investigations were done in various areas of the Nile delta and for various targets, all aimed to characterize the aquifer and its influencing factors. The aquifer thickness starts by about one hundred meter to the south to one thousand meter to Mediterranean coast in the north (RIGW, 2002). The depth to groundwater extends between five meters in the southern parts, 3–4 m in the central regions (study area) and 1–2 m in the northern parts (RIGW, 2002). The Quaternary Nile Delta aquifer (Mit Ghamr Formation) is covered by clay layer called Bilqas Formation, which made this aquifer acts as semiconfined aquifer (Farid, 1980). The clay layer thickness in the southern and central regions ranges between 5 m and 20 m and achieves more than 50 m in the northern area. Clay thickness in the investigated region (Fig. 2) ranges from 10 m in the southern to 15 m in the middle and 20–25 m in the east. The minimum thickness of the clay cover was observed at Kotama village in the western portion the study area. Due to the good hydraulic connected between different parts of the aquifer, it acts as large storage reservoir. Water in this aquifer is provided straightforwardly by seepage from broad surface water channel systems (Abdel Maged, 1994).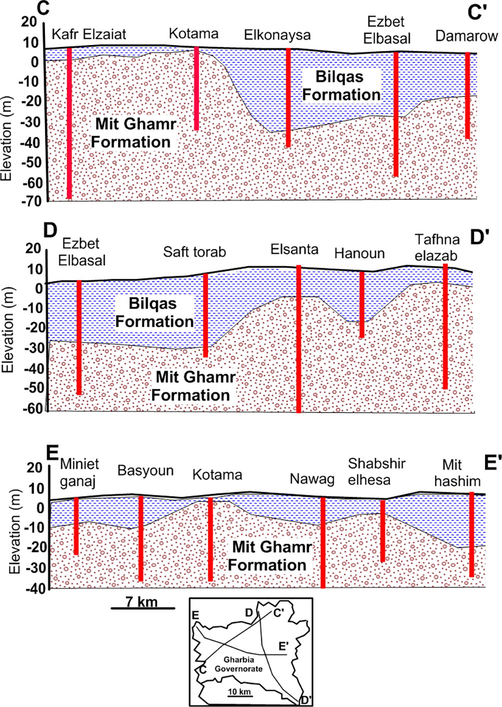
Three cross-sections showing the hydrogeology of the study area.
4 Results and discussion
4.1 Data analysis
Box plots of the isotope data for all the water media are presented in Fig. 3. It is obvious that for both isotopes, the most enriched data are those of the canals, drain water and soil water compared to groundwater whilst the most depleted samples are obviously the rainwater samples. It is also shown that groundwater zones have variable isotopic content. This may reflect different origins of the groundwater in the study area.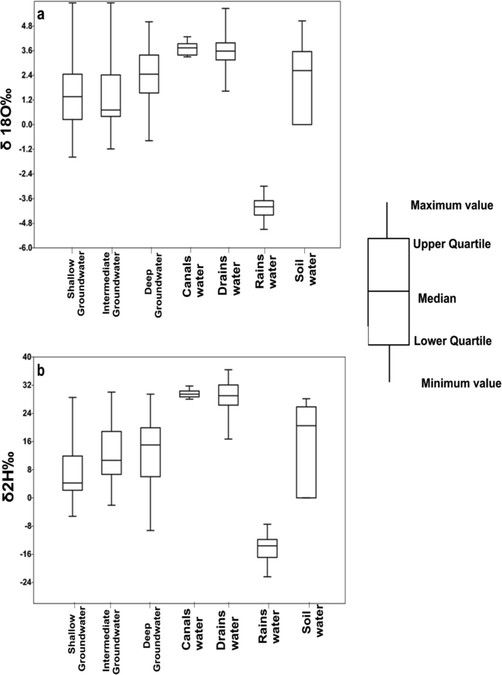
Box plots for (a) δ 18O‰ and (b) δ2H‰ for the different types of the sampled water.
4.2 Soil water
Stable isotopic content of soil water samples (Table 1) range from 1.72‰ to 5.05‰ for δ18O‰ with average value 3.25‰ and from 15.04‰ to 28.16‰ for δ2H with average value 23.307‰. It noticed that they have higher enrichment isotopic contents than groundwater and less than surface and recent Nile River water (Fig. 3) that could be due to evaporation process during infiltration via soil. The isotopic relationship between δ18O‰ and δ2H of soil water samples with respect to GMWL is represented in Fig. 4. The soil water samples are deviated from the GMWL and fall on a line affected by evaporation with intercept 10.53 and slope 3.90 according the following equation;
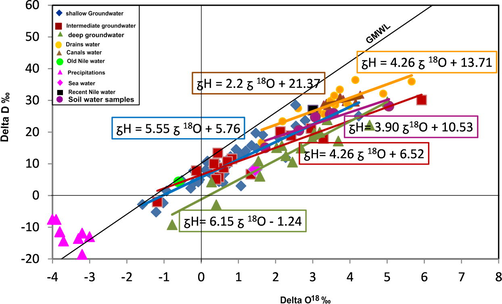
Relationship between delta 18O and delta D for the studied surface and ground waters.
4.3 Surface water
The isotopic content of canal water varies from 3.3‰ to 4.28‰ for δ18O‰ with average value 3.71‰ and from 28.05‰ to 31.77‰ for δ2Hwith average value 29.7‰ (Table 1 and Fig. 3). Drains water isotopic content ranged from 1.63‰ to 5.66‰ for δ 18O‰ with average value 3.56‰ and from 16.72‰ to 36.4‰ for δ2Hwith average value 28.9‰ (Table 1 and Fig. 3). Fig. 3 reveals that canal and drain water samples contain higher isotopic content than recent Nile River water (δ18O = 2.39‰ and δ2H = 22‰) which might be due to evaporation process that take place in surface water bodies during its flow. The higher isotopic enrichment of drain water could be due to evaporation process during recycling of drain water. Surface drain water samples are deviated from the GMWL and fall on evaporation line with slope = 4.26 and intercept = 13.71 (Eq. (2)) (Fig. 4). Canals water samples are also deviated from the GMWL along an evaporation line with slope = 2.2 and intercept = 21.37 (Eq. (3))
4.4 Groundwater
The groundwater environmental isotope data of δ18O and δ2H which represent the Quaternary aquifer are listed in Table 1 and shown in Fig. 3. In shallow groundwater, δ18O value ranged from −1.58‰ to 4.24‰ with average 0.78‰ and δ2Hvalues ranged from −5.23‰ to 28.53‰ with average value 10.098‰. For the intermediate groundwater, δ18O values ranged from −1.18 to 5.93‰ and δ2H value from −2.07 to 30.06‰ with average values 1.37‰ and 12.37‰, respectively. In deep groundwater, it ranged from −0.78 to 5.01‰ for δ18O with average value 2.38‰ and from −9.23 to 29.46‰ for δ2H with average value 13.41‰. The meteoric water stable isotopic composition helps to understand the recharge mechanism of groundwater where the groundwater isotopic composition equals to the average weighted annual values of sources of recharge such as rain water and stream water (Clark and fritz, 1997).
As shown in Fig. 4, the groundwater isotopic content in general decreased toward position of the old Nile water prior High Dam and their values increased to reach its maximum values toward the recent Nile water, canals and drain water. The investigated groundwater is mostly composed of mixed state from groundwater recharged before and that recharged after the High Dam construction. Few groundwater samples have depleted isotopic content and showed a mixing state between the rainwater and the Nile River water before High Dam construction. It is also clearly shown that, the deep groundwater is greatly influenced by of the sea water intrusion. The values of the isotopic content of the groundwater samples follow the mixing line with intercepts equal 5.7, 6.52 and 1.24 and slopes equal 5.55, 4.26 and 6.15 in shallow, intermediate and deep zone, respectively. This relation expressed by the following equations:
In the shallow groundwater (Fig. 4), the evaporation is indicated by the deviation away from global meteoric water line. Surface evaporation during infiltration process could be the major factor affecting the shallow groundwater isotopic contents. In deep groundwater, more deviation from global meteoric line was noticed which reflects the effect of mixing between freshwater and seawater. The intermediate groundwater samples average line showed an intermediate deviation indicating the effect of both processes, evaporation and seawater intrusion.
4.5 Spatial distribution
The patterns of the horizontal spatial distribution of δ18O and δD‰ are shown in Figs. 5 and 6. The soil water reached its highest values of δ18O‰ and δD‰ in sample 6 in the southwestern corner (Figs. 5a and 6a). The wide range of the stable isotopic contents of the soil samples might be related to the variable degree of evaporation process. Generally, soil water samples in the eastern part of the area have enriched isotopic contents compared to that of the western parts. Such pattern could be related to the difference in the cultivated crops between eastern and western parts of the area. The values of δ18O‰ and δD‰ for the shallow groundwater (Figs. 5b and 6b) reveal that the depleted values occupied the northeastern parts of the investigated region. In the intermediate zone, the depleted values extend from southwest to northeast parts across the central part (Figs. 5c and 6c). In contrast, the depleted values of the deep groundwater occupied the northeastern part (Figs. 5d and 6d). The wider area of the depleted isotopic contents in the shallow depths in contrast to the deeper depths might be related to different hydrological processes affecting the two zones. The shallow groundwater could be affected by soil salinity, surface evaporation process and the seepage of the irrigation channels and drains while the deep zone might be influenced by seawater intrusion.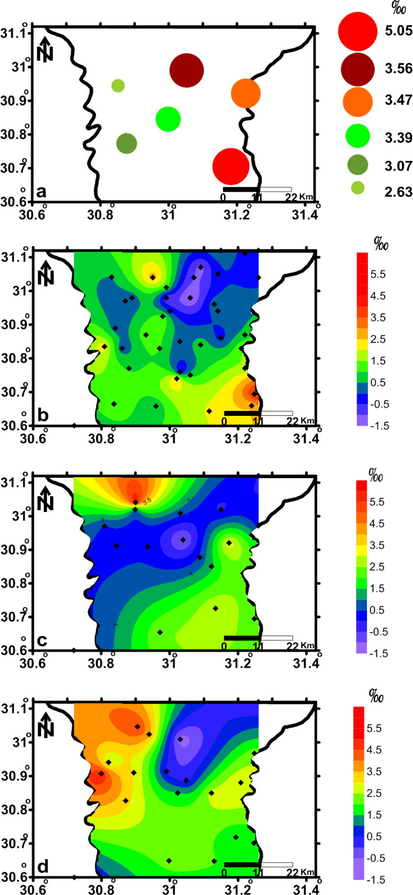
Spatial distribution maps of delta δ 18O‰ for water sampled from soil (a), shallow (b), intermediate (c) and deep (d) zones.
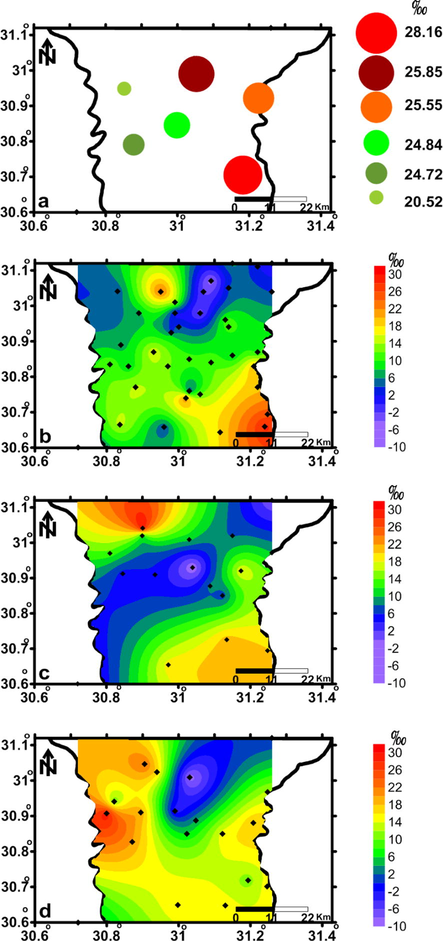
Spatial distribution maps of delta δD‰ for the water sampled from soil (a), shallow (b), intermediate (c) and deep (d) zones.
4.6 Relation between δ18O and d-excess
As widely indicated by the δ18O-δ2H relationship, the intersection between Y-axis with GMWL is known as d-excess and its equation established by Dansgaard (1964) is d = δD – 8δ18O. The worldwide values of d-excess are mostly around 10‰. Nonetheless, territories may have various d-excess values due to evaporation effect on precipitation. North America, Tropical Island region and Japan precipitations showed shift from the global equation where their equations are respectively as followings, δD = 7.95 δ18O + 6.03 (Gat 1980); δD = 6.17 δ18O + 3.97 (Gat 1980); δD = 8 δ18O + 17.5 (Sakai and Matsubaya 1977). As a rule, if evaporation is quicker, or precipitation evaporation happens, d-excess increases. Some research works applied d-excess to differentiate between the seasonal recharge of groundwater and the origin of the meteoric water air masses (Vandenschrick et al., 2002). Negative values of d-excess suggesting old recharge and greater degree of evaporation therefore negative values of deuterium excess are associated with heavier values of δ 18O and δD.
Fig. 7 shows the relationship between delta 18O and d-excess for surface and subsurface waters. D-excess values of the rainwater are mostly higher than 10 which propose the possible contributions of water vapor recycling (Fynn et al., 2016). D-parameter value of measured groundwater ranged from −8.88‰ to 9.8 ‰ for the shallow groundwater, −17.38 to 9.76‰ for the intermediate groundwater and from −14.07 to 2.01‰ for the deep groundwater. It ranged from −12.24 to 1.28‰ for soil water, from −4.02‰ to 2.29 ‰ for canals water and from −9.38‰ to 5.87‰ for drains water. Different evaporation rate in the groundwater is indicated by d-parameter values. The inverse relationship of d-parameter with δ18O and the spreading of the plotted samples indicate the evaporation rates vary from site to another and from groundwater zone to another. The canals, drains and soil water samples have high δ18O and lower d-parameter values which indicated evaporation effect. Most of the shallow and intermediate groundwater samples have higher value of d-excess and low to moderate values of δ18O which indicate recent recharge. The deep groundwater has low d-excess (mostly of negative values) and moderate δ18O values which indicate old groundwater recharge with marked influence of seawater intrusion and evaporation processes. This means, most of the shallow and intermediate groundwaters are related to recent recharge while deep groundwater is mainly related to old recharge process. In comparison, recent Nile water showed lower d-excess value compared to the old Nile water which might be related to the evaporation occurs due to storage of the Nile water in the High Dam Lake. The irrigation canal water, drain water and soil water showed mostly lower d-excess values compared to that of recent Nile water which could be also related to evaporation process.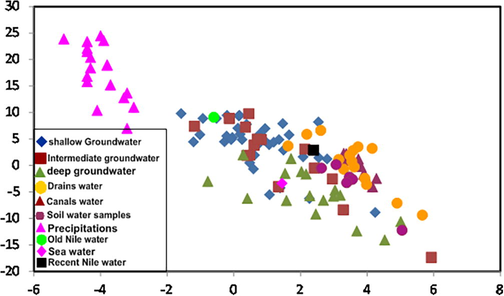
Relationship between delta δ18O‰ (x-axis) and d-excess‰ (y-axis) for the groundwater and surface water.
4.7 TDS, Cl and δ18O relationships
Water stable isotopes could be utilized to reveal the importance of the groundwater salinization processes (Mirzavand et al., 2020). Fig. 8 shows the relationship between TDS and δ18O. It reveals good evidence of mixing between different sources of groundwater where the samples located to the northeastern direction have higher TDS with depleted δ18O. Five of these samples belong to the shallow groundwater and have the highest TDS and the lowest δ18O values, one sample represents the intermediate groundwater and two samples represent the deep groundwater. Such configuration reveals that, the origin of salinity of the shallow groundwater might be related to evaporation process while the salinity of the deep groundwater is related to seawater intrusion. The samples with low TDS (fresh water) and enriched δ18O suggesting evaporation during recharge and mixing between the Nile water before and after High Dam construction.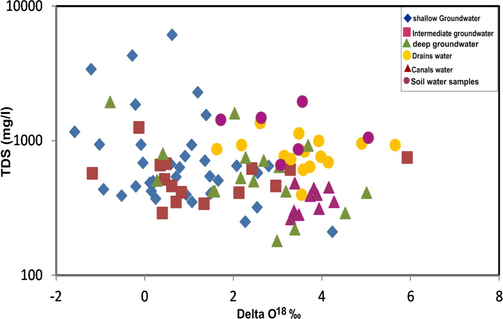
Relationship between delta 18O and TDS for the groundwater and surface water.
Fig. 9 represents the relation between chloride and δ18O‰ (a) and delta δ D‰ (b). The chloride concentration in the samples collected from soil water ranged from 85.11 to 354.61 mg/l. Those of the hallow groundwater ranged from 37.3 to 2499.2 mg/l, this large range in chloride concentration indicated different recharge sources and different hydrogeochemical processes. In contrast, the intermediate and the deep groundwater have lower range of chloride concentrations, from 56.6 to 148.94 mg/l and from 24.47 to 688 mg/l, respectively. It reveals that the samples which have high chloride content have low isotopic content. This might be due to evaporation process for the shallow groundwater and seawater intrusion for the deep groundwater as mentioned above. The diagram also shows the spreading of the plotted samples along wide range of δ18O‰ and δD‰ that may be due to the evaporation rate varies from location to another and reflect the effect of soil leaching and mineral hydrolysis weathering.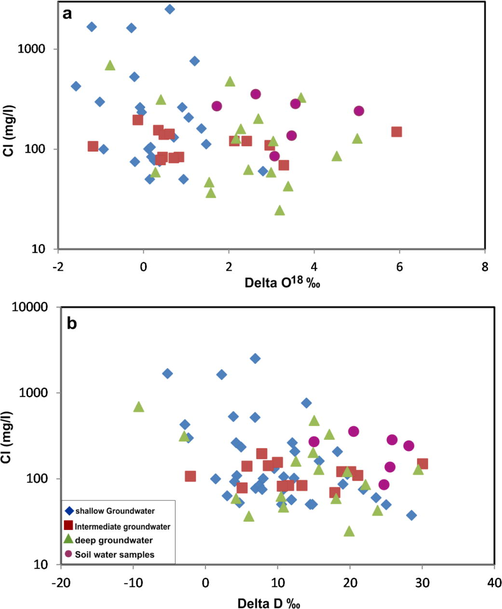
Relationship between Cl and delta δ18O‰ (a) and delta δD‰ (b) for the groundwater and soil water.
5 Discussion and conclusion
The current investigation aimed to evaluate the water stable isotopic characteristics of the collected groundwater samples in the study area. The results showed that the soil water ranged from 1.72‰ to 5.05‰ for δ18O‰ with average value 3.25‰ and from 15.04‰ to 28.16‰ for δ2H with average value 23.307‰. They are deviated from the GMWL which suggested the influencing by evaporation with intercept 10.53 and slope 3.90 according the relationship δ2H = 3.90 δ 18O + 10.53‰. The canals and drains water reveals that the isotopic content of the canal water has average value 3.71‰ for δ18O‰ and 29.7‰ for δ2H and for drains, the average values of δ 18O‰ were 3.56‰ and 28.9‰for δ2H. Surface canals and drains water samples are deviated from the GMWL and fall on evaporation line with slope equals 4.26 and intercept equals 13.71 where δ2H = 4.26 δ 18O + 13.71‰, and for canals, the slope = 2.2 and intercept = 21.37 where δ 2H = 2.2 δ 18O + 21.37‰. The isotopic content of groundwater samples showed that the water samples follow the mixing line with intercept = 5.55, 4.26 and 6.15 and slope = 5.7, 6.52 and 1.24, in shallow, intermediate and deep zone, respectively. The isotopic results estimated that the groundwater affected by evaporation process in the shallow zone. The intermediate groundwater samples average reveal an intermediate deviation indicating the effect of evaporation as well as seawater intrusion. High deviation from global meteoric line reflects the effect of mixing between freshwater and seawater in the deep groundwater.
The spatial distribution of δ18O and δD‰ showed that soil water reached its highest values in the southwest corner. The depleted values of the shallow groundwater occupied the northeastern parts. In the intermediate zone, the depleted values extend from southwest to northeast parts across the central parts. In contrast, the depleted values of the deep groundwater occupied northeastern parts.
According to the binary relationship between δ18O and δ2H, the canals, drains and soil measured water samples have high δ 18O and lower d-parameter values which indicated evaporation effect. The mixing recharge from recent and old river water indicated by the higher value of d-excess and low to moderate values of δ18O in shallow and intermediate zone. The low d-excess and moderate δ18O values in the deep groundwater suggested old groundwater recharge with marked influence of seawater.
The relationship between TDS and δ18O reveal that the evaporation process is responsible for the origin of salinity of the shallow groundwater while the salinity of the deep groundwater is related to seawater intrusion. The relation between chloride and δ18O‰ and delta δ D‰ showed that the wide range in chloride concentration indicated that soil water and shallow groundwater have different recharge sources and different hydrogeochemical process.
Acknowledgements
The authors are grateful to Tanta University for the financial support offered by the project number “TU-01-12-03” during the course of this paper. This research was supported by Researchers Supporting Project number (RSP-2021/351), King Saud University, Riyadh, Saudi Arabia.
Declaration of Competing Interest
The authors declare that they have no known competing financial interests or personal relationships that could have appeared to influence the work reported in this paper.
References
- Water Logging Phenomena in the North of the Delta Region. Fac of Sci Cairo Univ Egypt; 1994. MSc thesis
- Use of mass balance and statistical correlation for geochemical and isotopic investigation of the groundwater in The Quaternary Aquifer of The Nile Delta, Egypt. Arab J. Nucl. Sci. Appl.. 1999;32(1):43-58.
- [Google Scholar]
- Environmental Isotopes in Hydrogeology. New York: Lewis Publishers; 1997.
- Water isotopes as environmental tracers for conceptual understanding of groundwater flow: an application for fractured aquifer systems in the “Scansano-Magliano in Toscana” area (Southern Tuscany, Italy) Water. 2014;6(8):2255-2277.
- [Google Scholar]
- Nile Delta Groundwater Study. Egypt: Cairo University; 1980. MSc thesis
- Gat, J.R. (1980). The isotopes of hydrogen and oxygen in precipitation. In: Fritz, P., Fontes, Jh. (eds). Hdb of Environ Isotope Geochem: 21–47.
- Extremely rapid and localized recharge to a fractured rock aquifer. J. Hydrol.. 2009;376(3-4):496-509.
- [CrossRef] [Google Scholar]
- Isotope Hydrology-A Study of the Water Cycle. London: Imperial College Press; 2010. p. :9-19.
- An overview on source, mechanism and investigation approaches in groundwater salinization studies. Int. J. Environ. Sci. Technol.. 2020;17(4):2463-2476.
- [CrossRef] [Google Scholar]
- Isotope hydrology and geophysical techniques for reviving a part of the drought prone areas of Vidarbha, Maharashtra. India J. Hydrol.. 2019;570:495-507.
- [Google Scholar]
- Nile Delta Groundwater Modeling Report. Kanater El-Khairia, Egypt: Research Institute for Groundwater; 2002.
- Salem, Z. E. (2009). Natural and human impacts on the groundwater under an Egyptian village, central Nile Delta – A case study of MehalletMenouf. In: Thirteenth International Water Technology Conference (IWTC 13) March 12-15, 2009. Hurghada, Egypt, 3:1397-1414.
- Use of temperature profiles and stable isotopes to trace flow lines: Nagaoka area, Japan. Ground Water. 2004;42(1):83-91.
- [Google Scholar]
- The use of temperature, stable isotopes and water quality to determine the pattern and spatial extend of groundwater flow: Nagaoka area, Japan. Hydrogeol. J.. 2004;12:563-575.
- [Google Scholar]
- Origin and characteristics of brackish groundwater in Abu Madi coastal area, Northern Nile Delta, Egypt. Estuar. Coast. Shelf Sci.. 2016;178:21-35.
- [Google Scholar]
- Using stable isotope analysis (dD and d18O) to characterise the regional hydrology of the Sierra de Gador, south east Spain. J. Hydrol.. 2002;265:43-55.
- [Google Scholar]
- Application of a water budget to evaluate rainfall re-charge and slope stability. J. Chin. Inst. Environ. Eng.. 2004;14:227-237.
- [Google Scholar]


