

Translate this page into:
Optimizing profit in a controlled environment: Assessing the synergy between preservation technology and cap-and-trade policy
⁎Corresponding author. mashud@hstu.ac.bd (Abu Hashan Md Mashud)
-
Received: ,
Accepted: ,
This article was originally published by Elsevier and was migrated to Scientific Scholar after the change of Publisher.
Peer review under responsibility of King Saud University.
Abstract
Practicing environmentally sound supply chain management in emerging economies has become popular globally in recent days. Maintaining the inventory with proper care of the environment and optimizing profit is a challenge for any business scale (retailing or wholesaling). In this paper, products' deteriorating nature is revealed with a proper handling technology, mostly known as preservation technology for a retailing business, which needs capital investment to work smoothly and control the product degradation. Besides, managing carbons is another crucial attribute that needs equal attention as preservation technology. Carbon can emit through the holding of products in retailing houses. Transportation is a prominent process in supply chain management, and carbon emission is a common problem in this process. Thus, the holding of products and transportation of products is considered a source of carbon emission in the anticipated model. In an efficient way to restrict the emissions, a cap-and-trade policy is plugged in this proposed study, showing some significant outcomes. Based on the cap, two distinct cases have been studied in this proposed model where case I (when the cap is less than the allocated emissions) and Case II (when the cap is greater than the allocated emissions). Separate numerical examples for two different cases have been discussed. Moreover, some interesting theoretical developments and sensitivity analysis are presented to validate the robustness of the proposed model.
Keywords
Carbon emission
Cap-and-trade policy
Deterioration
Preservation technology
Emerging economy

1 Introduction
Supply chain management has become a vital issue for every business owner around the globe. Harmonic relation between every element of a chain is a much-expected issue for a retailing business. It is important to focus on clarifying the current state of industrial and operation engineering moving towards sustainability (Tseng et al., 2021). In a retailing business, carbons can emit in several ways, e.g., holding products, transportation of products, etc. (Hovelaque and Bironneau, 2014; Ruidas et al., 2021; Mashud et al., 2021b). Despite this, carbon can be formed through fossil fuels, ammonia production, biomass fermentation, natural gas processing plants, or directly from the air (Skiba, 2020). Nowadays, the concern about carbon emissions to the environment has become a sensitive issue for the rising economic developed countries (IPCC, 2018; Ren et al., 2018; Mishra et al., 2020). Managing carbon emissions in a more precise way is a big challenge for emerging economic countries and their respective business owners. For this reason, governments are trying to follow Paris's pact from 2016, where the main aim is to restrict the global average temperature by 20C, but, if possible, then 1.50C is desirable. Carbon capture and storage (CCS) are often used to limit carbons' emissions to the environment due to industrialization (Kätelhön et al., 2019; Skiba, 2020). The commercial industries usually allowed to use carbons within the range of 0.01 to 0.5 Mt (IEA, 2019; USEPA, 1990–2017), which became difficult to manage for the industries. Because a reservoir for storing the carbon is needed for this sometimes-expensive technique, it also argues some land to implement the process. A correlation amongst environment, business, and energy will provide the best way to harmonize the entire supply chain. These will give approximately a 45% reduction in carbon emissions by 2030 and decarburization within 2050 (Novak Mavar et al., 2021). But it will require some energy-efficient equipment with some carbon capture regulations, e.g., green technology, carbon-tax, cap-and-trade, carbon offset policy, etc. (Toptal et al., 2014; Hasan et al., 2020b; Shi et al., 2020).
Nowadays, green technology is widely used to curb the carbon from the environment in many cases (Datta et al., 2019; Mishra et al., 2020; Mashud et al., 2021a). But it always initially demands some capital investment set up. Despite this, sometimes the energy-efficient equipment’s are too expensive than the expectation. So, industries show their apathy, while the government also does not have any database to enable how many industries emit carbons. Some environmentalists discussed some best possible strategies positively in recent days. Among these strategies, the cap-and-trade technique is widely used in contemporary industry advancement strategies (Toptal et al., 2014; Hasan et al., 2020b). In cap-and-trade policy, the government fixed the cap for every industry, and the industry needs to purchase the rights based on their prediction of how much they will emit carbons to the environment. If the emission is high, then the government will force some penalty or tax on the industries. In contrast, the company can sell their excess rights to other companies if their allotted rights are higher than emissions of carbons, which is better compared to carbon-tax or green technology. Thus, a company can benefit from thru use of these regulations in some cases. Simultaneously, other factors are also crucial for the profit maximization of a company, for instance, maintaining product deterioration scrupulously.
Product deterioration is always crucial for the retailing business (Mashud et al., 2020b). Thus, a retailer always hunts some strategies to control or avoid the deterioration of products. Deterioration refers to decay, obsolesce, the decline in quality of products, etc., that are not repairable (Hasan et al., 2020a; Çalışkan, 2020; Mishra et al., 2021). The perfect quality of products always provides some flexibility to the retailer in dealing with customers. It triggers sales and fame, while the decline in quality can bring its loss in goodwill. Products can deteriorate or reduce quality when the chain runs, which is an inevitable process for a retailing business (Mashud et al., 2020a). So, maintaining product deterioration is always essential. Prior studies lag to harmonize the relation of preservation technology, pricing and cap-and-trade policy. However, the importance of it and other factors in inventory, this proposed study contributes:
-
In providing a clear path for a retailer, how to preserve products in a balanced way and provided a clear idea about the sources of carbon emissions?
-
To curb the emissions and provide some practical strategies in a profitably and sustainably to handle carbons emitted due to holding of products and during transportation of products.
-
A simultaneous investigation on product deterioration and restricting the carbons to the environment has been studied through the proper utilization of cap-and-trade policy.
In the later section of this study, a brief literature review has been given immediately following sub-section 1.1, while necessary assumptions are provided in sections 2.1 with the model's descriptions. Implementation of cap-and-trade policy has been introduced in section 2.2, while a test of its concavity provided at section 2.3. A solution algorithm with some numerical examples is presented at 3.1 and 3.2, respectively. The model's robustness illustrates at 3.3 with some managerial insights at 3.4. Finally, in section 4, a conclusion with model limitations and future scopes has been presented.
1.1 Literature review
In inventory management, the presence of carbon emission is inevitable, and over the years, the industries have adopted numerous strategies to limit emissions. For better maintenance of greener and cleaner environment for a comfortable life, some precise practical footsteps to reduce the carbon emissions, for instance, climate change tax (CCT), capture and storage (CCS), carbon offset (COS), climate change agreements (CCA), Green technology investment (GTI), carbon price support (CPS) and cap-and-trade (CAT) have to turn out to be indispensable to some extent company or for betterments of people of any country (Zhang et al., 2018). All these strategies will intensify the practitioners' participation in a clean and emission-free sustainable environment. It could also work as an inspiration for non-participants because they will turn away traditional coordination to numerous emission diminishing rehearses through a minimum carbon production, a minimum-carbon supply chain, and remanufacturing (Feng et al., 2019). A generous review of literature of numerous regulations of emissions and their consequence to the environment has been anticipated by Waltho et al. (2019). According to Skiba (2020) carbon capture and storage (CCS) is fruitful for an industry where petroleum products are burned for energy while demands a plant of at least 800 m more profound in the soil to store it safely. Sometimes this sort of plant expenses enormous investment, which is difficult for middle-scale industries. So, bearing this perplexity in implementing the technique, business owners always hunt for some new approach to curb the carbons in minimum investments. Huang et al. (2020) established a model bearing in mind the effect of green technology and uncovered that carbon tax policy further contentedly confines carbons' emissions to the atmospheres. Green technology investment is widely used and became popular nowadays in middle-scale industries despite its limitations (Mishra et al., 2021; Datta, 2017; Mashud et al., 2020a; Aronsson and Brodin, 2006; Jumadi and Zailani, 2010). It demands some energy-efficient logistic support with modern equipment (Lou et al., 2015). The critical fact that the government had significantly less information about the amount of carbon emitted during the process of production or other activities. Because the type or the brand of energy-efficient equipment may vary from producer company to company as the production company has the right to purchase any brand of that equipment, so, a proper database is needed for this process to implement.
To avoid complications and provide better facilities to the entrepreneurs, most of the government in the modern era has decided to implement a cap-and-trade policy. According to Du et al. (2016), the European Union Emissions Trading System (EUETS) has adopted the cap-and-trade policy, and they have formed some regulations based on this strategy. The main point they proposed is the emissions have a financial value. A carbon tax is similar type of strategy nowadays used by the emission-reducing countries, which is somewhat a particular case of a cap-and-trade policy. Another similar strategy akin to cap-and-trade is carbon offset. Rout et al. (2020) anticipated a model where carbon tax, cap-and-trade, and carbon offset policy are discussed explicitly all together. They provided a clear and transparent discussion on these strategies for curbing emissions. Sana (2020) proposed a newsvendor inventory model comparing green and non-green products with government tax implementation where the government rules higher subsidies and lower taxes to green producers, as opposed to lower subsidies and higher taxes to non-green producers. Taleizadeh et al. (2018) projected an EPQ (economic production quantity) model with a carbon tax for numerous shortages. Later, the exploration of the consequence of green production together with the cap-and-trade regulation on reducing the amount of produced carbon emissions was analyzed in Taleizadeh et al. (2021). A multi-objective oriented model for a sustainable supply chain thru carbon tax policy was anticipated by Sazvar et al. (2018), while product deterioration and backorder were also considered in that model. Daryanto et al. (2019) provided an integrated supply chain with carbon emissions for a three-echelon system for deteriorating products only. Daryanto et al. (2019)'s main limitation is they did not consider the preservation sense to control the deterioration, which is also absent at Sazvar et al. (2018). This paper has tried to bridge this gap with a cap-and-trade strategy.
Product deterioration is a common phenomenon for any product and a very known problem for daily retailing business. Mashud et al. (2019) tried to anticipate a model considering this issue and suggest an efficient preservation technology to curb the deterioration of products together trade-credit policy. This paper lags to describe the essential factor of carbon emission. Preservation technology means energy-efficient equipment that lengthened products' lifetime, e.g., cold storage to preserve potatoes, refrigerators to preserve medicine, etc. Hasan et al. (2020b) provided an inventory model for agricultural products in deteriorating nature with perfect and imperfect items. Some discount approach has been adopted in that paper but not consider any emissions and emission regulatory strategy, which is a limitation of that paper. Besides, Mishra et al. (2020) anticipated a non-instantaneous deteriorating inventory model that simultaneously implements preservation technology and green technology. Mashud et al. (2020c) predicted a model with product deterioration and preservation technology considering carbons' emissions. In that paper, an efficient green technology had been suggested by the authors to limit emissions. Few studies addressed these two issues simultaneously, and prior research shows a gap in simultaneous investment in preservation and cap-and-trade policy. Considering stochastic demand, Dolai and Mondal (2021) presented an imperfect production inventory system where the screening process was used to isolate defective items and this defective rate was controlled by investing in preservation technology. Since it was a production model it would have been the best combination if carbon emissions and emission control measures had been considered in that study. Based on the effects of carbon emissions at the breeding stage for growing items, an EOQ model was created by Rana et al. (2021) in which retention and deterioration were also found to be responsible for excessive carbon emissions.
Some recent study addresses preservation technology with the price of the products while pricing is another vital factor that needs to be maintained dynamically. Mashud et al. (2020a) developed an inventory model with price-sensitive demand and preservation technology. Wei et al. (2020) emphasized the difference between business time and non-business time in his inventory model and represented demand by a piece-wise function of price and product freshness. Considering the demand varying with green quality and sales prices, Sana (2021) demonstrated two situations in two models where the investment in green product development was shared by both the manufacturer and the retailer. Barman et al. (2021) set up a framework to control the connection between the government and a two-level duopoly green supply chain. In that study, both green and non-green products were also considered and market demand was a linear function of the product sales price and greening level. Mashud et al. (2021a) projected an inventory model with pricing strategies and carbon emissions for a greenhouse. Mashud et al. (2021c) anticipated a model with price-dependent demand and a hybrid payment system under the effect of COVID-19. In contrast, Ruidas et al. (2021) projected a model considering price-sensitive demand and interval-valued carbon emissions. They discussed four different policies on restricting the carbons to the environment, and they solved these cases with soft computing algorithms. In this model, we have implemented carbon limiting regulations cap-and-trade policy—moreover, the associated problem we have solved by a classical optimization technique. The synergy between a cap-and-trade policy and preservation technology has been synthesized in this proposed model. Table 1 presents a brief overview of some of the related studies.
Literatures
Carbon Emission
Cap and trade
Deterioration
Preservation Technology
He and Huang (2013)
✓
✓
Lou et al. (2015)
✓
✓
Du et al. (2016)
✓
✓
Daryanto et al. (2019)
✓
✓
Mishra et al. (2020)
✓
✓
Hasan et al. (2020b)
✓
✓
Rout et al. (2020)
✓
✓
✓
Sana (2020)
✓
Mashud et al. (2021a)
✓
✓
✓
Ruidas et al. (2021)
✓
✓
Rana et al. (2021)
✓
✓
Taleizadeh et al. (2021)
✓
✓
This study
✓
✓
✓
✓
2 Basic materials
In this section the necessary notations and assumptions have been provided in order to visualize the model for the readers in more clear way. The accessory notations used in this paper are as follows.
Notation
Description
Product order cost
Cost per unit for product purchase
Deterioration rate
Cost of product holding per unit time
Demand rate
Total order quantity
Level of inventory at time t,
Specific cost of transportation ($/trip)
Variable cost of transportation for each unit shipped ($/unit/km)
Variable cost of come-back trip ($/km)
Number of excursions
Travelled distance (km)
Vehicle fuel consumption during transportation (litre/km)
Mandatory tax per unit for each unit of carbon emissions
Unit penalty charge for excess carbon emission
Carbon credit sales price per unit
Vehicle emission standard (ton CO2/litre diesel fuel)
Average energy consumption during storage (kWh/unit/unit time)
Emission standard due to electricity during storage in the warehouse (ton CO2/kWh)
L
Distance between vendor and buyer (km)
Total amount of carbon emissions
Carbon cap
Per unit selling price of products
Coefficient of Preservation technology investment
Total profit per cycle
Decision variables
Replenishment time per cycle
Cost of investment in preservation technology per cycle
2.1 Model interpretation and assumptions
The entire cycle from the beginning to the end of the retailer's inventory
is delineated by Fig. 1 accompanying the differential equation below.
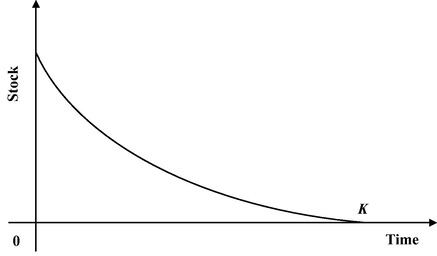
Graphical representation of the inventory model.
With given conditions:
Equation (1) describes the inventory fluctuations over time due to the effects of degradation and demand rate . Here (He and Huang, 2013, Mishra et al., 2018, Mashud et al., 2019) addresses the preservation technology, that is utilized to decrease the pace of decay of the item. The cycle of inventory begins through the acquisition of quantity of products by the retailer and closes with the finishing of the stock at the time.
By solving equation (1) and using given conditions, we get
and
Retailer’s associated costs and earnings of the inventory during the total cycle are calculated as follows:
Ordering cost:
Purchase cost:
Holding Cost:
Preservation technology investment:
Transportation cost:
Total amount of carbon emissions due to holding and transportation is
Mandatory carbon emission tax:
Sale’s revenue:
Then the total profit per cycle is
2.2 Carbon cap and trade policy
In cap-and-trade policies, the government determines an objective level for contamination, generally identified as cap, and permits the businessmen to decide how to face the cap. Carbon dioxide and other gases that drive a dangerous atmospheric deviation are fundamental focuses of such caps. The cap consists of allowance that licenses the holder for a certain measure of emissions. There should be an allowance equivalent to the measure of emissions produced. Regulated companies are permitted to purchase and sell allowances. Penalties are imposed for cap infringement due to excess carbon emissions.
If denotes the carbon cap, and denotes the total amount of carbon emissions then two cases arise:
Case I: When Carbon cap is less than total emissions i.e.
Suppose the amount of carbon cap imposed by any regulatory authority, e.g., government or any agency, is less than the retailer’s produced emission quantity. According to the cap-and-trade policy, the retailer needs to compensate per unit penalty charges for the excess amount. In mathematically, the cost for excess carbon emission is:
Thus, changes profit is:
Case II: When Carbon cap is greater than total emissions i.e.
In this case, the retailer’s produced emission quantity is less than the cap forced by any regulatory authority, e.g., government or agency. Thus, agreeing to a cap-and-trade policy, the retailer can choose to sell its rights to any industry and earn some revenues. In mathematically, the earning from the sale of extra permits is:
Then the profit becomes
2.3 Concavity nature of profit function
The cycle's total profit of a retailer from equation (16) provides a concave nature, shown later thru some propositions. Thus, the concavity of total profit can be easily extracted through Proposition 1 with the implementation of some constraints. The retailer will take decisions based on the conditions of the following situations on the cap illustrated in Proposition 1.
Proposition 1
For any stable non-negative , total carbon emissions and , the attained profit function of the retailer’s inventory always presents the concave nature at the optimum point , which is characterize by the following piecewise function:
Proof. Simplifying the profit function in equation (12) through the series expansion (considering the first three terms) of the exponential terms, we get
Let us take the 1st order derivative of equation (17) with regard to
,
Now apply the necessary condition
in order to make the solution for
, which yields the following result
Here
Then performing the derivative of equation (18) with regard to
,
Since the all parameters contained in and equation (20) assume positive values, so obviously will yield negative result at and presents the concave nature of the profit function.
For :
Simplifying the profit function in equation (14) through the series expansion (considering the first three terms) of the exponential terms, we get
Let us take the 1st order derivative of equation (21) with regard to
,
Now apply the necessary condition
in order to make the solution for
, which yields the following result
Here
Then performing the derivative of equation (22) with regard to
,
Since the all parameters contained in and equation (24) assume positive values, so obviously will yield negative result at and presents the concave nature of the profit function.
For :
Simplifying the profit function in equation (16) through the series expansion (considering the first three terms) of the exponential terms, we get
Let us take the 1st order derivative of equation (25) with regard to
,
Now apply the necessary condition
in order to make the solution for
, which yields the following result
Here
Then performing the derivative of equation (26) with regard to
,
Since the all parameters contained in and equation (28) assume positive values, so obviously will yield negative result at and presents the concave nature of the profit function.
Proposition 2
For any stable non-negative , total carbon emissions and , the attained profit function of the retailer’s inventory always presents the concave nature at the optimum .
Proof. The process is similar to that of Proposition 1.
Sometimes it is difficult for the retailer to make decisions based on only variable replenishment time or variable preservation technology investment. Moreover, this technique alleviates mathematical perplexity to make decisions, but exact calculations of profit are sometimes becoming critical. So, to provide some better constraints to the retailer on profit maximization, which should be maintained through the chain, is illustrated through Proposition 3.
Proposition 3
The attained profit function of the retailer’s inventory always presents the concave nature at the optimal point .
Proof. Firstly, let us make the series expansion (considering the first three terms) of all the exponential terms in profit function (12) and simplify it, which gives the following
Taking the first derivative of equation (29) with regard to
,
Now apply the necessary condition (i.e., first derivative equal to zero) in equation (30), which yields the following result.
Substituting this value of
in equation (29), we get the profit function in terms of variable
.
Let us take the 1st and 2nd order derivatives of equation (32) with regard to
.
Now place
and solves for
. This implies
Here,
To examine the optimality at
, let us place this value in equation (34).
If , then the profit function presents the concave nature at the optimal point .
Similarly, the concavity of the profit function at can be proved for carbon cap and trade policies.
Lemma. The sufficient condition for the concavity of the retailer’s profit function is satisfied when .
Proof. It is seen that the mentioned term involves summation and multiplication of some positive parameters and also there is no negative term present. Thus, it refers to a larger value than 2 and is satisfied.
3 Numerical illustrations
A solution algorithm and some related examples are discussed in this section.
3.1 Algorithm
-
Step 1.
Start
-
Step 2.
Declare and assign the following variables
-
Step 3.
Write the basic assignment statements [equations (3)-(28)] and stabilize .
-
Step 4.
-
Step 5.
Check the sufficient conditions for each = , from the statements in equations (20), (24) and (28).
-
Step 6.
If the sufficient conditions are satisfied for = , then evaluate the feasible profit from the statements in equations (12), (14) and (16) by using the concavity marker Max= ( ).
-
Step 7.
Stop
3.2 Examples
3.2.1 Example 1
This explains the fact when there is no cap strategy to control carbon emissions just the mandatory taxes are levied on the estimation of emissions. Consider the following parametric values:
In order to obtain a feasible solution, it is necessary to verify the feasibility of the corresponding mathematical terms (constraints) of the profit function (12). To this end, with the help of Lingo 18 software and following the algorithm discussed in the previous section 3.1, we get the following feasible solutions: which satisfy the associated constraints (2)-(11), and the objective (profit) function (12) reaches its maximum.
Now to check the concavity, utilizing the mentioned parametric values in equation (20), we get
, which yields negative result. So, it proves the concavity of equation (12) and thus converges to a specific value
at which the maximum profit is attained (Fig. 2).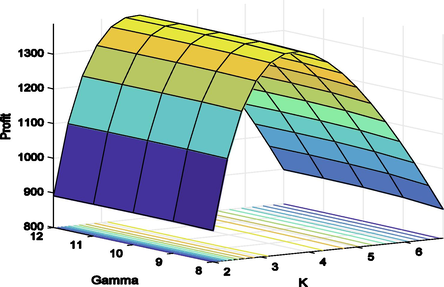
Concavity of total profit function
with respect to
and
.
3.2.2 Example 2
When the quantity of emissions is higher than carbon cap, for this situation let us consider the same parametric values of Example 1 and additional values , . In order to obtain a feasible solution, it is necessary to verify the feasibility of the corresponding mathematical terms (constraints) of the profit function (14). To this end, with the help of Lingo 18 software and following the algorithm discussed in the previous section 3.1, we get the following feasible solutions:
which satisfy the associated constraints (2)-(11), (13) and the objective (profit) function (14) reaches its maximum.
Now to check the concavity, utilizing the mentioned parametric values in equation (24), we get
, which yields negative result. So, it proves the concavity of equation (14) and thus converges to a specific value
at which the maximum profit is attained (Fig. 3).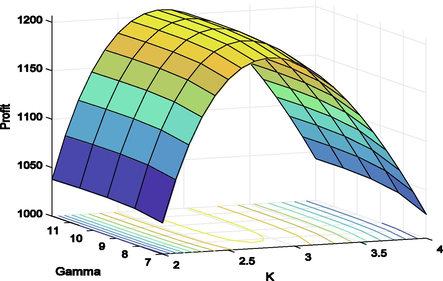
Concavity of total profit function
with respect to
and
3.2.3 Example 3
When the quantity of emissions is lower than carbon cap, then consider the same parametric values of Example 1 and additional values , . In order to obtain a feasible solution, it is necessary to verify the feasibility of the corresponding mathematical terms (constraints) of the profit function (16). To this end, with the help of Lingo 18 software and following the algorithm discussed in the previous section 3.1, we get the following feasible solutions:
which satisfy the associated constraints (2)-(11), (15) and the objective (profit) function (16) reaches its maximum.
Now to check the concavity, utilizing the mentioned parametric values in equation (28), we get
, which yields negative result. So, it proves the concavity of equation (16) and thus converges to a specific value
at which the maximum profit is attained (Fig. 4).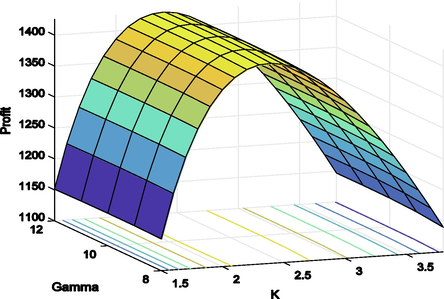
Concavity of total profit function
with respect to
and
.
3.3 Checking the robustness of the model
An analysis to check the robustness of the model has been performed on some important parameters by making varieties of a single parameter from −20% to +20% while others remain consistent to show their significant impacts on the retailer's profit (Table 2). The analysis has been conducted based on two main cases: when the cap is absent and the implementation of cap-and-trade policy. In cap-and-trade policy, two subcases are considered when the cap is greater or less than total emissions.
Parameter
% change
No cap
Cap and trade
% changes in
% changes in
% changes in
−20
−2.322
−0.001
87.594
−2.382
−0.001
100.77
−2.470
−0.001
85.276
−10
−1.110
−0.001
43.797
−1.139
−0.001
50.387
−1.181
−0.001
42.638
10
1.024
0.000
−43.796
1.052
0.000
−50.386
1.089
0.000
−42.637
20
1.974
0.001
−87.591
1.909
0.001
−94.473
2.099
0.001
−85.274
−20
0.685
6.004
10.408
0.495
4.191
9.109
0.466
3.807
6.465
−10
0.332
2.871
5.128
0.242
2.031
4.508
0.228
1.850
3.202
10
−0.313
−2.643
−4.989
−0.232
−1.914
−4.420
−0.220
−1.753
−3.145
20
−0.610
−5.087
−9.849
−0.455
−3.722
−8.757
−0.432
−3.417
−6.236
−20
−0.604
−2.614
13.563
−0.748
−3.109
23.094
−1.645
−8.716
23.892
−10
−0.299
−1.298
6.765
−0.552
−2.849
11.491
−0.791
−4.259
11.771
10
0.293
1.282
−6.735
0.527
2.770
−11.312
0.737
4.085
−11.464
20
0.580
2.548
−13.440
1.032
5.468
−22.460
1.428
8.015
−22.656
−20
−0.601
−2.597
13.531
−0.748
−3.109
23.045
−1.640
−8.686
23.840
−10
−0.298
−1.290
6.750
−0.550
−2.838
11.467
−0.789
−4.245
11.746
10
0.292
1.273
−6.719
0.526
2.760
−11.290
0.735
4.072
−11.442
20
0.578
2.531
−13.410
1.029
5.448
−22.416
1.424
7.990
−22.613
−20
0.207
2.370
12.541
−0.040
0.435
13.646
−0.207
−0.742
11.589
−10
0.098
1.136
6.258
−0.021
0.210
6.823
−0.102
−0.359
5.793
10
−0.089
−1.050
−6.236
0.022
−0.198
−6.822
0.098
0.337
−5.791
20
−0.169
−2.023
−12.453
0.046
−0.384
−13.642
0.194
0.655
−11.580
−20
–
–
–
0.681
4.543
−10.289
0.704
4.030
−17.116
−10
–
–
–
0.348
2.297
−5.202
0.745
4.890
−8.620
10
–
–
–
−0.364
−2.351
5.324
−0.820
−5.142
9.064
20
–
–
–
0.527
4.480
9.854
−1.733
−10.578
18.649
−20
−2.946
0.000
0.023
−3.049
0.000
0.026
−3.128
0.000
0.022
−10
−1.391
0.000
0.011
−1.440
0.000
0.013
−1.477
0.000
0.011
10
1.258
0.000
−0.010
1.302
0.000
−0.011
1.336
0.000
−0.010
20
2.407
0.000
−0.019
2.491
0.000
−0.022
2.555
0.000
−0.018
−20
−0.347
−2.336
4.292
−0.520
−3.109
12.244
−1.336
−8.248
14.541
−10
−0.171
−1.161
2.133
−0.415
−2.679
6.068
−0.640
−4.036
7.114
10
0.168
1.148
−2.109
0.395
2.609
−5.909
0.594
3.879
−6.838
20
0.332
2.282
−4.194
0.771
5.154
−11.672
1.147
7.618
−13.430
−20
0.553
4.818
8.446
0.779
6.665
14.152
0.855
7.081
11.657
−10
0.269
2.324
4.173
0.376
3.172
6.962
0.412
3.359
5.729
10
−0.257
−2.173
−4.081
−0.353
−2.896
−6.754
−0.385
−3.051
−5.549
20
−0.502
−4.209
−8.075
−0.685
−5.554
−13.319
−0.747
−5.839
−10.933
−20
–
–
–
0.676
5.173
1.802
–
–
–
−10
–
–
–
0.337
2.544
0.829
–
–
–
10
–
–
–
−0.336
−2.464
−0.687
–
–
–
20
–
–
–
−0.671
−4.855
−1.234
–
–
–
−20
–
–
–
–
–
–
1.293
9.439
−3.303
−10
–
–
–
–
–
–
0.654
4.657
−1.832
10
–
–
–
–
–
–
−0.672
−4.550
2.206
20
–
–
–
–
–
–
−1.366
−9.011
4.799
N.B. The dash line mean there is no feasible solution there
From the above analysis, we come to the following perceptions
-
In light of the analysis, it is seen that if the retailer needs to purchase the item at a more significant cost than expected, however selling price remains steady, the profit earned at that time may not be able to achieve a strong net profit. On the other hand, the reduction in per unit purchase cost leads to a relative expansion in profit. This is because the retailer buys the product at a lower price than before but still sells at the previous price, which contributing to higher profits.
-
At the point when the retailer has to go through more cost to hold the item per unit, he does not keep the product in stock for a long time so as not to incur huge losses, which prompts less preservation investment and a slight decrease in profit.
-
The cost of transporting the goods depends mainly on the distance covered. The shorter the distance, the lower the cost and the higher the profit. Again, if the number of trips is increased, the total covered distance increases and so does the cost of transportation, which allays the profit. That is, the number of trips , and the distance traveled are inversely proportional to the profit.
-
When the rate of deterioration of the product expands, the retailer starts investing more to prevent it, and during this period the profit diminishes.
-
An increment in emissions standards by electricity during holding and by vehicles during transportation altogether significantly increase the amount of tax paid by the seller, bringing about lower profits.
-
In the event that the carbon cap expands, that is, when the disparity among emissions, and caps is more noteworthy, the retailer makes higher profits by selling increased allowances. Also, a significant profit is seen, when the selling price of carbon per unit is increased. On the other hand, profit declines because of the increment in mandatory unit tax for each unit of carbon emissions and unit penalty charges for overabundance emissions .
3.4 Managerial insights
A sustainable inventory always proposes some significant recommendations for a retailer to implement in real life. Implementing a cap-and-trade policy always provides a better experience for a manager, while preservation technology added extra features of facilities to the proposed model. Some specific insights which any managers can easily practice in real business arena are:
-
A roadmap on proper utilization of transport system is suggested with its associated attributes, e.g., distance, number of trips, carbon emissions etc., for industry managers to calculate how to optimize the industries profits in efficient way.
-
This study synthesizes the shortcomings of cap-and-trade policy together with preservation technology investment.
-
A proper scenario for preservation technology is suggested here when to stop the investments and how much optimal investment is beneficial for the manager.
4 Conclusions
This paper investigates an inventory model with environmental emissions through the use of an effective preservation technology investment. A genuinely sustainable inventory system in contemporary business is rare, and this study provides some insights that help make the inventory truly sustainable. A cap-and-trade policy is used successfully to limit the carbon emissions to the environment and provide a better facility to the retailer. This study successfully investigated two cases, where the first one showed when permitted emission cap is less than the provided cap and the second one is over the cap simultaneously with the presence of preservation technology. The profit obtained in case II (when emission is lower than cap) is greater (approximately 18.17%) than Case I when the amount of emissions is higher than the allotted cap. This policy has shown that when the tax is increased due to holding products or transportation, it brings lower profit. In contrast, it also shows that when the allowed carbon emissions are less than the cap, the retailer can earn a more significant profit. Besides, to reduce product deterioration efficiently, a preservation technology has been implemented in the model. Thus, a combination of preservation technology and cap-and-trade policy bring more significant profit and provide more extraordinary facilities to the retailer. This study also shows that; a retailer can optimize the profit with proper handling of optimum replenishment policies. Finally, a combination of carbon restriction policy, and preservation technology with optimum replenishment provides a truly sustainable inventory model for a retailer.
This paper lags to identify some other carbon emissions sources, e.g., lightning products, wastage of products. The only cap-and-trade policy is discussed, which may not be appropriate for some exceptional cases (Hasan et al., 2020). A hybrid carbon tax, cap and trade system, such as in Datta et al. (2019), is also possible. Another major limitation of this proposed study is the number of players. A realistic supply chain considers more than one player, so an analysis based on a single player is not enough to visualize the actual supply chain scenario. This model only covers economic and environmental sustainability issues while becoming genuinely sustainable; some social issues need to be discussed in the anticipated model, which is lacking.
This study also can be extended by the implementation of some payments scheme, e.g., advance (Mashud et al., 2021a), trade-credit strategy (Mashud et al., 2021c), or a combination of these two (Mashud et al., 2020c). Advance–cash-credit (ACC) (Shi et al., 2020) is also an alternative. A dynamic demand (time-varying, stochastic, etc.) is much more realistic than price-sensitive demand.
Conflict of interest
The authors declare that they have no conflict of interest.
References
- The environmental impact of changing logistics structures. Int. J. Logist. Manag.. 2006;17(3):394-415.
- [CrossRef] [Google Scholar]
- Optimal pricing and greening strategy in a competitive green supply chain: impact of government subsidy and tax policy. Sustainability. 2021;13:9178.
- [CrossRef] [Google Scholar]
- A simple derivation of the optimal solution for the EOQ model for deteriorating items with planned backorders. Appl. Math. Model.. 2020;89:1373-1381.
- [CrossRef] [Google Scholar]
- Effect of green technology investment on a production-inventory system with carbon tax. Adv. Oper. Res.. 2017;2017:1-12.
- [CrossRef] [Google Scholar]
- A hybrid carbon policy inventory model with emission source-based green investments. OPSEARCH. 2019;57:202-220.
- [Google Scholar]
- Low-carbon production with low-carbon premium in cap-and-trade regulation. J. Clean. Prod.. 2016;134:652-662.
- [Google Scholar]
- Three-echelon supply chain model considering carbon emission and item deterioration. Transp. Res. Part E: Logist. Transp. Rev.. 2019;122:368-383.
- [Google Scholar]
- Work performance dependent screening process under preservation technology in an imperfect production system. J. Ind. Prod. Eng.. 2021;38:1-17.
- [Google Scholar]
- Decisions of the dual-channel supply chain under double policy considering remanufacturing. Int. J. Environ. Res. Public Health.. 2019;16(3):465.
- [CrossRef] [Google Scholar]
- Optimizing inventory and pricing policy for seasonal deteriorating products with preservation technology investment. J. Ind. Eng. 2013:793568.
- [CrossRef] [Google Scholar]
- The carbon-constrained EOQ model with carbon emission dependent demand. Int. J. Prod. Econ.. 2014;164:285-291.
- [Google Scholar]
- Inventory management in supply chains with consideration of logistics, green investment and different carbon emissions policies. Comput. Ind. Eng.. 2020;139:106207.
- [Google Scholar]
- A non-instantaneous inventory model of agricultural products considering deteriorating impacts and pricing policies. Kybernetes 2020:2264-2288. Vol. ahead-of-print No. ahead-of-print
- [Google Scholar]
- Optimizing inventory level and technology investment under a carbon tax, cap-and-trade and strict carbon limit regulations. Sustain. Prod. Consum.. 2020;25:604-621.
- [Google Scholar]
- IEA (International Energy Agency). Putting CO2 to Use. 2019. Available online: (accessed on 5 January 2021).
- Intergovernmental Panel on Climate Change, 2018. Global warming of 1.50C. Available at: https://report.ipcc.ch/sr15/pdf/sr15_spm_final.pdf. accessed in January 2020.
- Integrating green innovations in logistics services towards logistics services sustainability: a conceptual paper. Environ. Res. J.. 2010;4(4):261-271.
- [CrossRef] [Google Scholar]
- Climate change mitigation potential of carbon capture and utilization in the chemical industry. Proc. Natl. Acad. Sci. U.S.A.. 2019;116:11187-11194.
- [CrossRef] [Google Scholar]
- Investment strategy of emission-re-duction technology in a supply chain. Sustainability. 2015;7:10684-10708.
- [Google Scholar]
- Retailer’s joint ordering, pricing, and preservation technology investment policies for a deteriorating item under permissible delay in payments. Math. Probl. Eng. 2018:6962417.
- [CrossRef] [Google Scholar]
- Non-instantaneous deteriorating inventory model under the joined effect of trade-credit, preservation technology and advertisement policy. Kybernetes. 2019;49(6):1645-1674.
- [CrossRef] [Google Scholar]
- A sustainable production-inventory model for a controllable carbon emissions rate under shortages. J. Clean. Prod.. 2020;256:120268.
- [CrossRef] [Google Scholar]
- A sustainable inventory model with imperfect products, deterioration and controllable emissions. Mathematics. 2020;8:2049.
- [Google Scholar]
- Optimal replenishment policy for deteriorating products in a newsboy problem with multiple just-in-time deliveries. Mathematics. 2020;8(11):1981.
- [Google Scholar]
- Optimizing a sustainable supply chain inventory model for controllable deterioration and emission rates in a greenhouse farm. Mathematics. 2021;9(5):495.
- [CrossRef] [Google Scholar]
- A sustainable inventory system with the advanced payment policy and trade-credit strategy for a two-warehouse inventory system. Kybernetes 2020 Vol. ahead-of-print No. ahead-of-print
- [CrossRef] [Google Scholar]
- A sustainable inventory model with controllable carbon emissions, deterioration and advance payments. J. Clean. Prod.. 2021;296(12):126608
- [CrossRef] [Google Scholar]
- A sustainable inventory model with controllable carbon emissions in green-warehouse farms. J. Clean. Prod.. 2021;298(4):126777
- [CrossRef] [Google Scholar]
- A resilient hybrid payment supply chain inventory model for post Covid-19 recovery. Comput. Ind. Eng. (In production) 2021
- [CrossRef] [Google Scholar]
- Significance of enhanced oil recovery in carbon dioxide emission reduction. Sustainability. 2021;13(4):1800.
- [CrossRef] [Google Scholar]
- Cooperative sustainable supply chain for deteriorating item and imperfect production under different carbon emission regulations. J. Clean. Prod.. 2020;272:122170.
- [Google Scholar]
- Multifactor correlation analysis and modeling for product low-carbon design. J. Ind. Eng. Int.. 2018;35(7):432-443.
- [Google Scholar]
- A production inventory model with interval-valued carbon emission parameters under price-sensitive demand. Comput. Ind. Eng.. 2021;154(6):10715.
- [CrossRef] [Google Scholar]
- Growing items inventory model for carbon emission under the permissible delay in payment with partially backlogging. G. F.. 2021;3:153-174.
- [Google Scholar]
- Optimal replenishment decisions for perishable products under cash, advance, and credit payments considering carbon tax regulations. Int. J. Prod. Econ.. 2020;223:107514.
- [Google Scholar]
- A sustainable supply chain for organic, conventional agro-food products: the role of demand substitution, climate change and public health. J. Clean. Prod.. 2018;194:564-583.
- [CrossRef] [Google Scholar]
- Insight into Carbon Capture and Storage (CCS) technology. Org. Med. Chem. Int. J.. 2020;9(5):129-132.
- [Google Scholar]
- A structural mathematical model on two echelon supply chain system. Ann. Oper. Res.. 2021;1–29
- [CrossRef] [Google Scholar]
- Price competition between green and non green products under corporate social responsible firm. J. Retail. Consum. Serv.. 2020;55:102118.
- [CrossRef] [Google Scholar]
- Joint decisions on inventory replenishment and emission reduction investment under different emission regulations. Int. J. Prod. Res.. 2014;52(1):243-269.
- [Google Scholar]
- Sustainable economic production quantity models for inventory systems with shortage. J. Clean. Prod.. 2018;174:1011-1020.
- [CrossRef] [Google Scholar]
- Pricing and coordination strategies in a dual channel supply chain with green production under cap and trade regulation. Sustainability. 2021;13:12232.
- [CrossRef] [Google Scholar]
- Sustainable industrial and operation engineering trends and challenges Toward Industry 4.0: a data driven analysis. J. Ind. Prod. Eng.. 2021;38:581-598.
- [CrossRef] [Google Scholar]
- USEPA (United States Environmental Protection Agency). Inventory of U.S. Greenhouse Gas, Emissions and Sinks: 1990–2017. Available online: https://epa.gov/sites/production/files/2019-04/documents/us-ghg-inventory-2019-main-text.pdf (accessed on 5 January 2021).
- Green supply chain network design: a review focused on policy adoption and emission quantification. Int. J. Prod. Econ.. 2019;208:305-318.
- [CrossRef] [Google Scholar]
- Joint optimization of pricing and inventory strategy for perishable product with the quality and quantity loss. J. Ind. Prod. Eng.. 2020;37:23-32.
- [CrossRef] [Google Scholar]
- A stochastic reverse logistics production routing model with environmental considerations. Ann. Oper. Res.. 2018;271:1023-1044.
- [CrossRef] [Google Scholar]


