

Translate this page into:
Nutritional supplement of Lepidium sativum L. seeds alleviates metabolic disorders and inflammatory responses in high-fat diet-induced obese rats via modulating AMPK/SREBP-1c of PPARγ signaling pathway
⁎Corresponding author at: Pharmaceutical Biology, Head of Pharmaceutical Biology Department, Faculty of Pharmacy and Biotechnology, German University in Cairo, Egypt. heba.handoussa@guc.edu.eg (Heba Handoussa)
-
Received: ,
Accepted: ,
This article was originally published by Elsevier and was migrated to Scientific Scholar after the change of Publisher.
Abstract
Abstract
Background
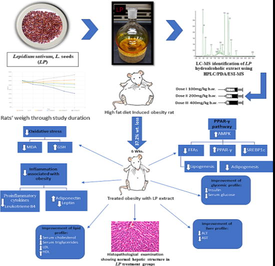
Obesity is a multifactorial chronic non-communicable disease that affects more than one- third of the world population. It represents a burden on human health in both developed and developing countries. Nowadays there is an urgent need for effective natural alternatives to manage obesity. This study aimed at exploring the fundamental molecular processes and contributive pathways of the hydroalcoholic extract of Lepidium sativum, L. seeds (LP) to manage weight gain with its accompanied metabolic complications in a high-fat diet-induced obesity animal model.
Methods
Different doses of the hydroalcoholic extract were investigated for adipogenesis inhibition in liver tissues through Peroxisome-proliferator-activated receptor-gamma (PPARγ) transcriptional activity and mitochondrial phosphorylation of 5′AMP-activated protein kinase (AMPK) using western blot. Sterol regulatory element-binding protein (SREBP)-1c which plays a role in regulating cellular free fatty acid homeostasis via fatty acid oxidation and lipogenesis was evaluated using RT-qPCR gene analysis. Furthermore, Analyses of alterations in body weight and serum biomarkers such as triglycerides, total cholesterol, high-density lipoprotein (HDL), low-density lipoprotein (LDL), insulin, leptin and adiponectin were used to assess the anti-obesity effect. The protective seeds’ impact on hepatic tissues was further assessed by histopathological examination. The bioactive metabolites profiling was conducted via HPLC/ESI/PDA/MS-MS.
Results
LP effectively modulated PPARγ transcriptional activity via activation of mitochondrial phosphorylation of AMPK. Moreover, RT-qPCR gene analysis presented suppression of nuclear expression of SREBP-1c in dose-dependent method related to control group. Furthermore, it was revealed that LP moderated serum lipid profile, glycemic profile, leptin, and adiponectin. In addition, it reduced liver injury through decreasing ALT and AST enzymes in serum, upregulating liver antioxidant enzyme glutathione, and downregulating oxidative stress manifested in decreased malondialdehyde (MDA) levels. The anti-inflammatory activity was confirmed by declining in proinflammatory cytokine leukotriene B4 (LT-B4).
Conclusion
This study is the first to report the potential impact of nutritional supplementation of Lepidium sativum seeds (400 mg/kg) to alleviate metabolic disorders and inflammatory responses in high-fat diet-induced obese rats via modulating AMPK/SREBP-1c of the PPARγ signaling Pathway.
Keywords
Inflammation
Lepidium sativum L.
Metabolic disorder
Obesity
PPARγ
Supplement

1 Introduction
Obesity is one of the most complicated and prevalent dietary diseases worldwide. It results in several complications and related health problems ranking it as the fifth risk factor allied with mortality around the globe. It has increased exponentially in the past years reaching the pandemic stage that is negatively affecting the biological and physiological human functions as stated by the World Health Organization (Chooi et al., 2019). Body weight gain is associated with multiple obesity-induced inflammation, which contributes to the generation of oxidative stress and liver dysfunction. These consequences could be controlled by peroxisome proliferator-activated receptor gamma (PPARγ). PPARγ is a key player transcription factor in adipose tissues and has a critical role in AMPK/SREBP-1c signaling pathway that modulates lipogenesis and adipogenesis processes that are disrupted by obesity (Omran et al., 2023).
Unfortunately, none of the current anti-obesity drugs have proven their usefulness in long-term treatment, due to the possible tolerance and accompanying side effects such as diarrhea, abdominal cramps, and vomiting. Consequently, a reliable, secure natural alternative is a pressing need nowadays. Lepidium sativum, L. (LP) is commonly known as Garden cress and Hab El- Rashad. It is widely used in the Middle East in natural medication and as a food supplement due to its enriched nutritious content of considerable amounts of vitamins, proteins, amino acids, and carbohydrates (Shah et al., 2021). LP seeds have many health benefits including anti-inflammatory, antioxidant, hypoglycemic and hepatoprotective effects (Abdulmalek et al., 2021). Also, it is reported to have antihypertensive, antimicrobial, and bronchodilator activities (Shah et al., 2021). Hence, LP is postulated as a probable anti-obesity food supplement.
The objective of this study is to explore the potential effect of LP seeds on obesity-related complications through the AMPK/SREBP-1c signaling pathway as a promising treatment for obesity and its associated metabolic disorders. Moreover, the possible role of LP in modulating the biochemical markers, inflammatory responses, and its consecutive oxidative stress in comparison with green tea as a well-known reference drug (Dey et al., 2019) was assessed. The normal architecture of liver tissue was confirmed using histopathological assessment. In addition, the characterization of LP ethanolic extract bioactive metabolites using HPLC/ESI/PDA/MS-MS was applied.
2 Materials and methods
2.1 Plant material
The seeds were purchased from the Vegetable and Medicinal Plants Research Centre, Giza, Egypt. Seeds were cleaned with running water and dried, then grounded to particle sizes 40 mesh. A voucher specimen was placed at the herbarium of the Pharmaceutical Biology Department, Faculty of Pharmacy & Biotechnology, German University in Cairo (GUCPHBL2019). For seeds hydroalcoholic extraction procedure using ethanol, refer to supplementary data.
2.2 HPLC/ESI/PDA/MS-MS analysis
The study was conducted using a Waters Corp. (USA) Waters ACQUITY H-Class-Xevo TQD triple-quadruple tandem mass spectrometer with an electrospray ionisation (ESI) interface.
2.3 Animal model and experimental design
Five weeks adult male white albino Wistar rats (total n = 36, n = 6), weighing 150–200 g, were purchased from the National Research Center (Cairo, Egypt). Animals were kept in typical polypropylene cages & under appropriate settings: temperature (25 ± 2 °C), moisture (60–70%), and (12-hour dark/light cycles) all over the experiment. The animals were kept in the cages one week ahead the experimental involvement for accommodation. The Experimental design was conducted in accordance with Egyptian National Institutional Guidelines on Animal Experimentation & permitted by Animals Ethics Committee at the GUC (#PBL-2020-06). That was aligned with references of National Institutes of Health (NIH) Guide for Care and Use of Laboratory Animals (Publication No. 85–23, revised 1985).
Rats were divided into six groups: control (NFD) group which was fed only standard chow (10% fat, 15% protein, and 75% carbohydrate), and saline. Negative control (HFD) group received only high-fat diet (70% fat) (Marques et al., 2016). Positive control (HFD + green tea) group received a high-fat diet along with 250 mg/kg b.w./day green tea extract (Sengupta et al., 2021). Obese groups received HFD and different oral doses of 75% ethanolic LP extract as; HFD+ (100, 200, 400 mg/kg b.w./day) groups (Ali Redha et al., 2021; Mousavi et al., 2018). Rats’ body weights were checked on regular bases, and consumption of food and water was controlled on daily bases during the six weeks course of the study. A Toxicity test was performed to confirm that there are no signs of analytical and anatomopathological changes. Refer to supplementary data.
All animals were euthanized by decapitation and blood samples were assembled from the venous sinus using fine tubes 24 hrs after last dose administration, where rats were fasting, then serum was obtained for biochemical analysis. Liver samples were harvested where the first portion of liver adipose tissues was integrated and stored at −80 °C for PPARγ and AMPK-1α expression levels assessment using western blotting. RT-qPCR analysis was used of Free Fatty Acids (FFAs) and SREBP-1c expression evaluation. The second portion was collected in 10% formalin for histopathological study.
2.4 Serum biochemical parameter analysis
Serum liver enzymes were analyzed using kits for ALT&AST purchased from BioMed-GPT, Egy-chem (cat # GPT113100 & GOT111060). Lipid profile was assessed by measuring LDL (low-density lipoproteins) and triglycerides, cholesterol, HDL (high-density lipoproteins) using colorimetric kits (cat#TG119090, CHO104090, HDL116100 & LDL 116020, respectively) purchased from Egy-chem Company for Biotechnology, Cairo, Egypt.
Serum glucose level was evaluated colorimetrically using BioMed-glucose L.S, (cat #GLU109480), Egy-chem, Egypt. Serum insulin levels were measured using ELISA kit (MyBioSource, cat#MBS724709, San Diego, CA, USA).
2.5 Assessment of inflammatory markers
The inflammatory marker B4 (LT-B4) was assessed in liver adipose tissues using a rat ELISA kit (LT-B4 ELISA kit) purchased from MyBioSource, cat#MBS727908, San Diego, CA, USA. Leptin level was measured using an ELISA kit (CUSABIO, cat#CSB-E07433r, Kampenhout, Belgium). Adiponectin level was assessed using RayBio® Rat Adiponectin ELISA kit purchased from RayBiotech, Inc., cat #ELR-Adiponectin, Norcross, GA, USA.
2.6 Assessment of oxidative stress markers
Reduced glutathione (GSH) & malondialdehyde (MDA) were assessed in liver adipose tissues using colorimetric kits purchased from Biodiagnostic, Giza, Egypt with cat# MD2529 & TA2512, respectively.
2.7 Western blot analysis and RT-qPCR gene analysis
Western blot was used to analyze PPAR-ɣ and AMPK in liver tissue. SREBP-1C and FFAs genes were evaluated using RT-PCR Quantitative protein analysis was done using the Bradford Protein Assay Kit (SK3041) BIO BASIC INC. (Markham, Ontario, Canada). Furthermore, Total RNA was assessed with the aid of Qiagen tissue kit (Qiagen, USA) cat#/ID:69581. Refer to supplementary data.
2.8 Histopathological analysis
Samples were taken from rats’ livers, fixed for 24 hrs. in 10% formol, and washed using fresh water. Xylene was used to wash the samplings then fixed in paraffin for 24 h at 56 °C in hot air oven using serial alcohol dilutions. Paraffin beeswax blocks were done at a 4 m thickness using sledge microtomes. Before, microscopic analysis, removal of paraffin was done to enhance the staining with hematoxylin and eosin (VMR Darmstadt, Germany) (Banchroft et al., 1996).
2.9 Statistical analysis
Results were presented as mean ± SD (standard deviation) of triplicate experiments. GraphPad Prism software, version 7.04, was adopted for the statistical analysis. Statistical significance was done using a one-way analysis of variance (ANOVA) procedure then Tukey’s multiple range test at the p-value < 0.05.
3 Results
3.1 HPLC/ESI/PDA/MS-MS analysis
HPLC/ESI/PDA/MS-MS method was used to detect the phytoconstituents in the bioactive extract as depicted in Table 1. The proof of identity of peaks was done by comparison of fragmentation pattern to the literature as shown in (Fig. 1), negative ionization mode was used.
Peak #
Retention time (min)
Identified Compound
UV–Vis (λmax)
[M − H]−
(m/z)
Peak area (%)
Fragment ions (m/z)
Reference
LP1
3.73
Caffeoyl quinic acid
326
353.0
14.07
169
(Sun et al., 2007)
LP2
3.71
Caffeic acid
323
179.1
9.89
135
(Sun et al., 2007)
LP3
3.86
Dicaffeoyl-quinic acid
222, 326
515.3
6.23
353
(Simirgiotis et al., 2015)
LP4
4.89
Salvianolic acid C derivative
326
829.0
0.38
535, 311, 179
(Barros et al., 2012)
LP5
5.09
Caffeoyl glucopyranoxyl hydroxypreneyl caffeate
210, 330
602.9
3.06
279, 179, 135
(Wu et al., 2009)
LP6
6.17
Hydroxypinoresinol hexoside
230, 284
535.2
0.53
373, 313
(Guo et al., 2007)
LP7
8.15
Kaempferol hexoside
228, 332
447.3
7.02
285
(Ibrahima et al., 2015)
LP8
8.75
Dihydrokaempferol acetyl-hexoside
220, 330
491.2
3.53
284
(Simirgiotis et al., 2015)
LP9
9.3
Apigenin hexoside
230, 320
431.1
0.51
269
(Simirgiotis et al., 2015)
LP10
10.89
Ellagic acid deoxyhexoside
251, 332
447.1
0.58
301, 257
(Wyrepkowski et al., 2014)
LP11
11.56
Ellagic acid
254, 368
301.1
0.25
257
(Wyrepkowski et al., 2014)
LP12
11.7
Gallic acid
226
169.1
0.74
125
(Chernonosov et al., 2017)
LP13
11.89
Tricaffeoyl-glucosyl-hexoside
228, 264
827.2
0.32
665, 281
(Es-Safi and Gómez-Cordovés, 2014)
LP14
12.88
Quercetin rhamnopyranoside
227, 345
447
0.36
301
(Silva et al., 2014)
LP15
13.21
Ferulic acid
324
193.2
1.53
149
(Barros et al., 2012)
LP16
13.97
Feruloyl-quinic acid
310, 240
367.0
1.35
191
(Simirgiotis et al., 2015)
LP17
14.85
Quercetin
220, 320
301
0.97
179, 151
(Silva et al., 2014)
LP18
15.03
Caffeoyl quinic acid
326
353.0
9.03
169
(Sun et al., 2007)
LP19
16.75
Kaempferide (methyl Kaempferol)
220, 336
299.0
11.46
284
(Chernonosov et al., 2017)
LP20
17.25
Dicaffeic acid ester derivative
325
591.2
5.93
169
(Francescato et al., 2013)
LP21
17.82
Kaempferol
220, 320
285.1
0.83
255, 117
(Chernonosov et al., 2017)
LP22
18.57
Methyl gallate
223
183.2
2.78
140, 124
(Chernonosov et al., 2017)
LP23
20.12
Quercetin hexoside
232, 335
463.3
–
301, 179
(Barros et al., 2012)
LP24
20.19
Apigenin 7-O-(2′'-dihydrogalloyl)-rhamonsyl-6-C-(2′''-pentosy)-glucoside
268, 336
863.4
–
563, 443, 311
(Es-Safi and Gómez-Cordovés, 2014)
LP25
20.20
Quercetin galloyl methylgalloyl deoxyhexoside
250, 335
765.4
–
447, 301, 179, 151
(Li and Seeram, 2018)
LP26
21.5
Arachidic acid
207
311.3
–
267, 223
(Simirgiotis et al., 2015)
LP27
21.7
Ferulic acid glucoside
328
355.2
1.53
193, 149
(Barros et al., 2012)
LP28
24.5
(epi)catechin-(epi)catechin-O-gallate
321
729
–
577, 287
(Tala et al., 2013)
LP29
26.5
(epi)catechin-O-gallate-O-glucuronide
321
617.6
–
289, 271
(Tala et al., 2013)
LP30
27.6
Quercetin acetyl dihexoside
232, 335
667.6
0.75
505,463, 301
(Barros et al., 2012)
LP31
28.5
Cinnamic acid derivative
274
441.7
0.53
305, 175, 147
(Es-Safi and Gómez-Cordovés, 2014)
LP32
29.32
Coumaric acid hexoside
270, 322
325.2
0.33
651, 163, 191
(Simirgiotis et al., 2015)
LP33
29.78
Caffeoyl-coumaroylquinic acid
285
499.9
1.56
179, 151
(el Sayed et al., 2016)
LP34
33.96
Chlorogenic acid derivative
310, 246
451.4
3.2
353, 191
(Simirgiotis et al., 2015)
LP35
34.2
Caffeoyl-2,7-anhydro-3-deoxy-2-octulopyranosonic acids
240, 324
381.1
–
337, 169
(Zhang et al., 2007)
LP36
35.2
Acetyl caffeoyl quinic acid
280
395.1
–
191,179
(Sun et al., 2007)
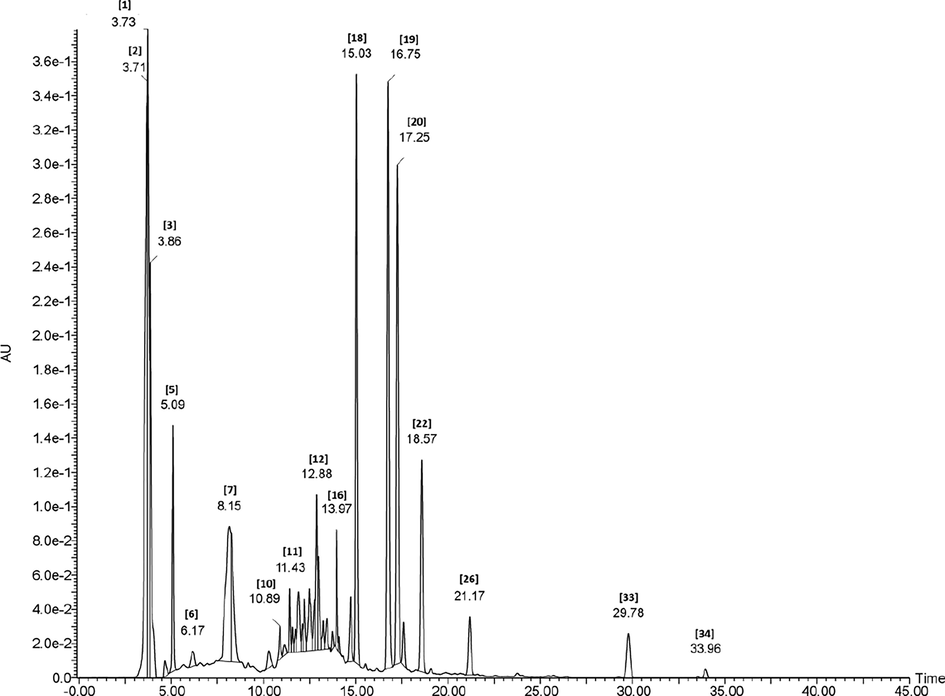
HPLC/ESI/PDA/MS-MS chromatogram of metabolites detected in bioactive extract of Lepidium sativum (negative mode).
3.2 Body weight evaluation
Body weights for all rats (n = 6) were monitored daily for 6 weeks, where the assessment of the average weights was recorded (Fig. 2). LP treatment groups showed a remarkable decrease in rats’ body weight; LP (100, 200, 400 mg/kg + HFD) groups by 13.33%, 27.2%, and 48.49%, respectively compared to the control group.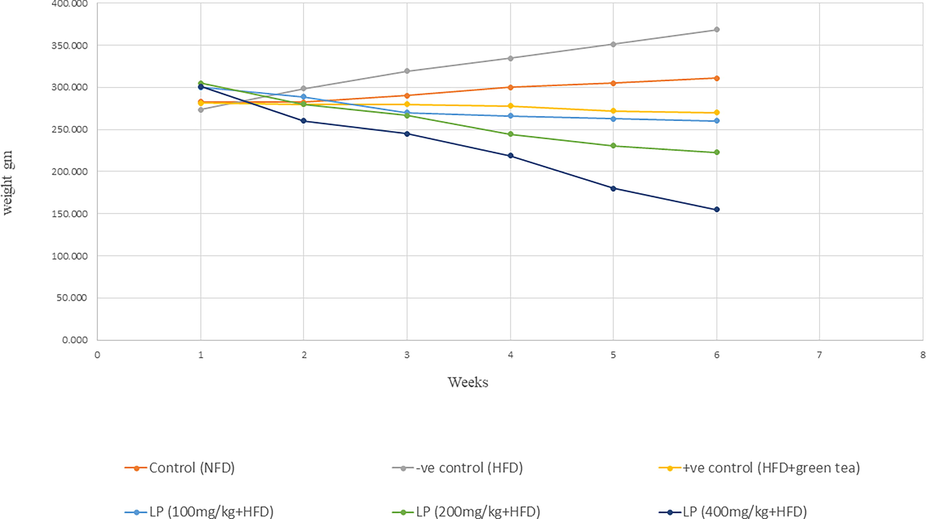
Trend chart shows average of body weight (gms) in different study groups.
3.3 Biochemical markers
3.3.1 Impact of LP on liver markers enzymes
As depicted in (Fig. 3A & 3B), HFD-fed rats showed higher levels of ALT & AST enzyme as linked to the control (NFD) group by 255.53% & 253.59%, respectively. ALT levels significantly declined in dose dependent way (100, 200, and 400 mg/kg b.w.) by 128.589%, 150.02%, and 190.94%, respectively in comparison to the HFD group. AST levels showed a substantial decrease after administration of LP doses by 145.14%, 171.39%, and 237.8%, respectively compared to the HFD group.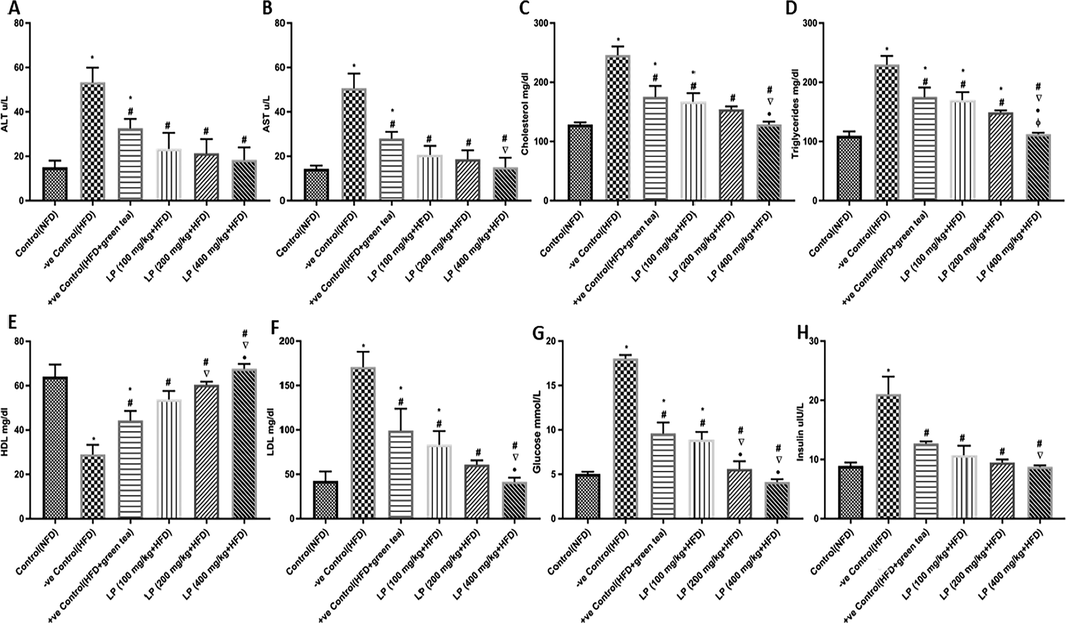
Effect of Lepidium sativum extract on levels of serum biomarkers: (A) ALT enzymes (B) AST enzymes (C) cholesterol (D) triglycerides (E) high-density lipoproteins (HDL) (F) low-density lipoproteins (LDL) (G) glucose (H) insulin. Data are expressed as mean ± SD of three independent experiments (n = 6). Significant differences were identified as: *significantly different from control (NFD) group, #significantly different from −ve control (HFD) group, significantly different from +ve control (HFD + green tea) group, •significantly different from LP (100 mg/kg + HFD) group, ɸsignificantly different from LP (200 mg/kg + HFD) group at p < 0.05.
3.3.2 Impact of LP on serum lipid profile
The HFD group showed disrupted serum lipid profile compared to NFD. Treated groups 100, 200, 400 mg/kg b.w. showed a significant reduction in cholesterol amounts by 47.04%, 59.43%, and 90.84%, respectively in comparison to HFD group. Additionally, reduction in triglycerides levels by 35.2%, 54.01%, and 104.89%, respectively, and a reduction of LDL levels by 104.96%, 180.92%, and 312.04%, respectively in comparison to the HFD group (Fig. 3C, 3D & 3F). Moreover, as shown in (Fig. 3E) HDL levels displayed a significant increase in LP treatment groups 100, 200, and 400 mg/kg b.w. in comparison to the HFD group by 46.13%, 51.98%, and 57.1%, respectively. LP 400 mg/kg b.w. exhibited a remarkable reduction in cholesterol, triglycerides, and LDL levels in comparison to HFD + green tea group by 26.6%, 36.01%, and 58.25%, respectively, while it showed a significant increase in HDL levels by 52.35%.
3.3.3 Impact of LP on the glycemic profile
As presented in (Fig. 3G & 3H), groups treated by LP showed an improved glycemic profile. The HFD-fed group showed significantly increased level of glucose and insulin in comparison to NFD group by 257.25% and 136.74%, respectively. LP 100, 200, 400 mg/kg b.w. significantly lowered blood glucose levels by 102.6%, 221.96%, and 336.24%, respectively in comparison to HFD. The group supplemented with 400 mg/kg b.w. dose of LP exhibited significantly decreased glucose levels compared to HFD + green tea by 56.94%. Moreover, insulin levels exhibited a significant decrease in LP 100, 200, and 400 mg/kg b.w. compared to HFD by 96.36%, 121.78%, and 140.33%, respectively. In addition, the group augmented with 400 mg/kg b.w. dose of LP exhibited significantly decreased insulin levels compared to HFD+green tea by 30.96%.
3.4 Impact of LP on inflammatory reactions
As shown in (Fig. 4A), HFD-fed group showed a substantial increase of leukotriene LT-B4 in comparison to the NFD group by 225.81%. LP 100, 200, 400 mg/kg b.w. significantly decreased LT-B4 compared to HFD by 94.53%, 124.38% and 232%, respectively. Moreover, the 400 mg/kg b.w. dose of LP exhibited a significantly decreased LT-B4 level compared to HFD + green tea and LP 100 mg/kg b.w. by 48.41% and 41.41%, respectively.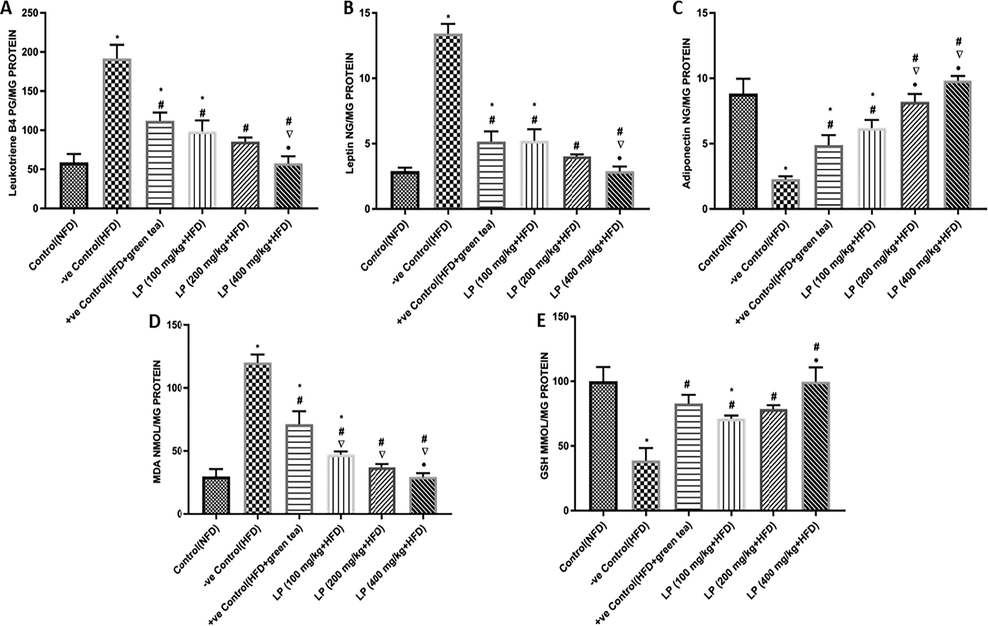
Effect of Lepidium sativum extract on levels of inflammatory markers measured in liver adipose tissues by ELISA kits: (A) leukotriene B4 (LT-B4), (B) leptin (C) adiponectin and on oxidative stress markers in liver adipose tissues and were measured using colorimetric kits: (D) MDA and (E) GSH levels. Data are expressed as mean ± SD of three independent experiments (n = 6). Significant differences were identified as: *significantly different from the control (NFD) group, #significantly different from −ve control (HFD) group, significantly different from +ve control (HFD + green tea) group, •significantly different from LP (100 mg/kg + HFD) group, • significantly different from LP (100 mg/kg + HFD) group at P < 0.05.
The HFD-fed group showed a remarkable increase in leptin level (Fig. 4B) in comparison to the NFD group by 363.1% and a decrease in adiponectin level by 73.99%. LP 100, 200, 400 mg/kg b.w. significantly reduced leptin levels compared to HFD by 155.64%, 233%, and 363.10%, respectively, while increased adiponectin levels (Fig. 4C) by 62.95%, 71.98%, and 76.63%, respectively. Furthermore, 400 mg/kg b.w. dose of LP presented a decrease in the leptin level compared to HFD + green tea by 43.90%, on the other side: it increased adiponectin levels by 100.79%.
3.5 Effect of LP extract on oxidative stress markers in adipose tissues
As presented in (Fig. 4D & 4E), the HFD group showed significantly increased levels of MDA in comparison to the NFD group by 303.76% and decreased levels of GSH by 61.21%. Meanwhile, LP 100, 200, 400 mg/kg b.w. significantly decreased MDA levels compared to the HFD group by 155.034%, 224.25%, and 308.84%, respectively. While increased GSH levels compared to the HFD group by 45.44%, 50.59%, and 61.05%, respectively. Moreover, the group supplemented with 400 mg/kg of LP exhibited significantly reduced MDA levels compared to HFD + green tea by 58.74%.
3.6 Assessment of the PPARγ pathway
3.6.1 Western blot analysis of PPARγ and AMPKα expression in adipose tissues
Western blot results have shown that HFD group significantly decreased the phosphorylated PPARγ and AMPKα in comparison to the NFD group by 85.37% and 79.15%, respectively, and relative to β-actin; housekeeping gene. LP 100, 200, 400 mg/kg b.w. significantly increased PPARγ compared to the HFD group by 74.84%, 78.21% and 80.61%, respectively, and phosphorylation of AMPKα by 69.56%, 75.09%, and 80.90%, respectively. Moreover, the group supplemented with 400 mg/kg b.w. dose of LP presented a recognizable increament in PPARγ and AMPKα levels compared to HFD + green tea with P < 0.05. (Fig. 5A & 5B).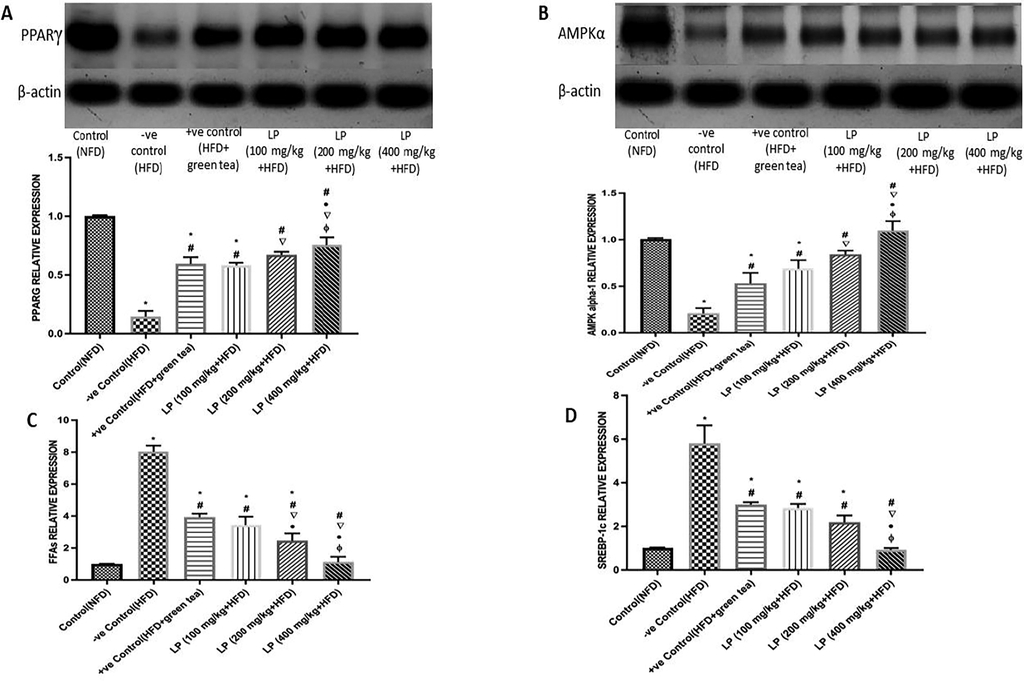
Effect of Lepidium sativum on phosphorylation of PPAR γ and AMPK-α1 in the hepatic tissue of HFD-fed rats analyzed by Western blot of: (A) PPAR-γ and (B) AMPK-α1 expressed relative to β- actin band strength in the investigated groups, (C) Free Fatty acids (FFAs) and (D) SREBP-1c in the hepatic tissue of HFD-fed rats analyzed by RT-qPCR. Results represent the mean ± SD of three independent experiments (n = 6). Significant differences were identified as: *significantly different from control (NFD) group, #significantly different from −ve control (HFD) group, significantly different from +ve control (HFD + green tea) group, •significantly different from LP (100 mg/kg + HFD) group, ɸsignificantly different from LP (200 mg/kg + HFD) group at p < 0.05.
3.6.2 RT-qPCR gene analysis
As described in (Fig. 5C & 5D) the HFD-fed group showed a remarkable increase in mRNA expression levels of FFAs & SREBP-1c in comparison to the NFD group by 697.71% and 473.54%, respectively. LP 100, 200, 400 mg/kg b.w. significantly decreased FFAs levels by 133.04%, 225.61%, and 609%, respectively, while significantly decreasing SREBP-1c mRNA expression levels by 103.85%, 164.09%, and 524.73%, respectively compared to HFD group. Moreover, the group supplemented with 400 mg/kg b.w. dose of LP exhibited a considerably decreased FFAs & SREBP- 1c levels by 71.24% and 524.73%, respectively compared to HFD + green tea.
3.7 Histopathological analysis
In the control (NFD) group, the central vein and encircling hepatocytes had normal histological architecture with no histopathological alterations. (Fig. 6A). In the HFD group, the central vein showed several inflammatory cells infiltration and congestion (Fig. 6B). (HFD + green tea) the group displayed dilatation in both central vein and sinusoids, while parenchymatous tissue indicated ballooning deterioration in the hepatocytes (Fig. 6C). LP 100 mg/kg showed dilatation and congestion in the central vein (Fig. 6D), while LP 200 mg/kg displayed mild congestion in the central vein (Fig. 6E). Finally, LP 400 mg/kg depicted normal histopathological pattern in the central vein and hepatocytes in the portal area was observed (Fig. 6F).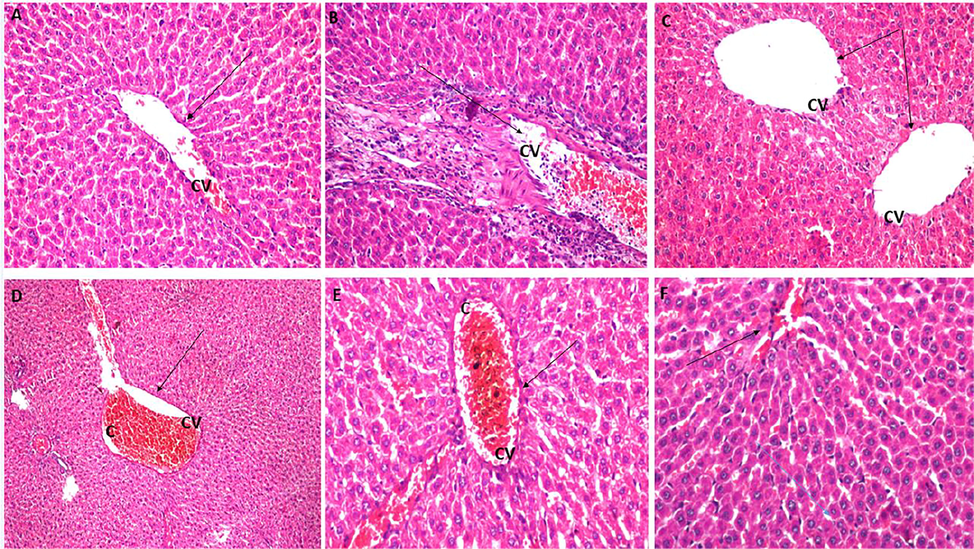
Histological analysis of liver tissues sections in each group. (A) Control (NFD) group showing typical hepatic structure, (B) −ve control (HFD) group showing inflammation and congestion (c) in the central vein (CV) (C) +ve control high fat diet (HFD) + green tea group showing dilation of central vein and sinusoids, (D) LP 100 mg/kg + HFD group showing dilatation and congestion of the central vein, (E) LP 200 mg/kg + HFD group showing mild congestion in central vein, (F) LP 400 mg/kg + HFD group showing normal histological structure of portal area and surrounding hepatocytes (H&E, x40).
4 Discussion
Obesity is a multifactorial multifaceted disease that is considered a burden on human health worldwide. Aligned with the fact that the approved common therapies have several side effects (Payab et al., 2020). Nowadays, there is a promising trend to introduce more dietary supplements and food components into the daily diet. This strategy is directed to the medical community to facilitate weight management and control obesity-associated comorbidities. The current study shows the ability of Lepidium sativum, L. seeds to attenuate obesity in HFD-fed rats. Interestingly, LP seed extract reduced the body weight in all treated groups. This could be attributed to the enriched phytoconstituents content, which may contribute to halting the prevalence of obesity.
Obesity represents a threat as a notable cause of chronic inflammation with increased production of proinflammatory mediators (Biobaku et al., 2019) and activation of different inflammatory signaling pathways. Accordingly, adipocytes show an changed adipokine profile, with overexpression of pro-inflammatory cytokines. As for adiponectin, the mRNA expression level is impaired in the adipose tissue due to decreased energy expenditure that in turn increases insulin resistance and alters the body’s metabolic pathways. Adiponectin also augments the expression of leptin, as a marker of leptin intolerance due to hypothalamic resistance (Forny-Germano et al., 2019). The results showed the capacity of LP extract to decrease leptin levels, with a synchronized increase in adiponectin in test subjects. Also, the findings revealed the capability of LP to decrease LT-B4 levels. A leukotriene which is produced in response to a cascade of inflammatory mediators. Moreover, it is reported to be overexpressed in the incidence of obesity that directly induces cellular insulin resistance (Ramalho et al., 2019).
However, the pro-inflammatory response in obesity is known to be accompanying with the assembly of toxic reactive oxygen species and successive generation of a state known as oxidative stress (OS) leading to the depletion of antioxidant enzymes. Consequently, MDA levels are elevated in obesity due to lipid peroxidation, while GSH levels are considerably diminished due to the presence of fat depositions in the adipose tissue associated with the production of ROS. The outcomes presented the significant antioxidant effect of LP extract with a decrement in oxidative markers and related enzymes. This merit potential could be accredited to the existence of many phenolics identities in the extract that act synergistically altogether as caffeoyl quinic acid (Olennikov et al., 2019), chlorogenic acid and its derivatives including caffeic acid, ferulic acid, salvianolic acid C derivative, and gallic acid (He et al., 2020), which were reported to have a radical scavenging aptitude. Also, quercetin which decreases nitrite and nitrate levels in plasma leads to a reduction of oxidative stress associated with obesity (Song et al., 2020). The major bioactive compounds of LP were investigated in aforementioned studies (Chatoui et al., 2020; Oszmiański et al., 2013). These studies provided a linkage between the active metabolites and the suggested role in demolishing obesity through the PPARγ signaling pathway.
The ligand-dependent transcription factor peroxisome proliferator-activated receptor gamma (PPAR), that is known to be abundant in adipocytes, is crucial for adipogenesis and lipid synthesis. It is considered the key factor in thermogenesis and the dynamic regulator of lipid metabolism and insulin sensitivity. Remarkably, PPARγ activators combat insulin resistance, dyslipidemia, and atherosclerosis. Thus, deciphering the combinatorial interactions between different metabolic problems associated with obesity (Dabeek and Marra, 2019). The current study demonstrated that LP phenolic enriched extract was effective in ameliorating obesity by modulating PPARγ transcriptional effect and activating the phosphorylation of AMP-activated protein kinase (AMPK). This process is essential for the suppression of proteolytic processing and transcriptional activity of sterol regulatory element binding protein (SREBP-1c) which obstructs adipogenesis by means of enhancing lipolysis in adipose tissue and encouraging fatty acid oxidation in the liver to control the risk factors for cardiovascular diseases (CVD). The PPARγ activation impact was further confirmed by evaluation of lipid profile serum markers in comparison with that fed-HFD only. In a vicious circle of dyslipidemia, obesity, and disrupted glycemic profile, LP hereby showed a significant ability to modulate serum glucose and insulin levels in dose- dependent manner to the extent of approaching normal levels manifested in the NFD group.
Scientific literature suggested the imperative role of phenolics in PPARγ modulation including quercetin, which inhibits lipid accumulation through activation of the PPARγ pathway (Dabeek and Marra, 2019). Kaempferol protects the body from triglycerides accumulation in several reports. Variya et al., 2020 proved that gallic acid improves glycemic profile indicators by modulating the PPARγ pathway (Variya et al., 2020). Interestingly, it was reported that oxidative stress and inflammation are also directly connected to PPARγ pathway where inflammatory cytokines obtaining from overproduced reactive oxygen species downregulate the expression of PPARγ (Algandaby, 2020).
Bioactive phenolic compounds gained tremendous interest in the past few years, owing to their pharmacological activity concerning obesity hallmarks and related metabolic syndrome (Ranilla et al., 2019).
According to Johansen et al., obesity directly affects the hepatocytes and liver physiology where lipid accumulation and peroxidation cause severe liver tissue damage (Johansen et al., 2020). Histopathological findings of liver tissues of obese rats in the HFD group exhibited radical damage in the portal vein and hepatocytes in comparison to LP extract treated groups, where their photomicrographs have shown a decrease in the severity of congestion and injury in the portal vein and hepatocytes.
Taken all together, it has been evidenced that the introduction of LP-enriched diet minimizes body-weight gain, controls glycemic profile, and reduces the atherogenic index. LP extract supplementation decreases retroperitoneal fat amassing and adipogenesis via downregulation of adipogenesis transcription factors, lipogenesis mediators, and connected genes. Furthermore, it causes the upregulation of oxidative-encoding genes. Results hypothesized the possibility that LP components in obesity management and its related disorders.
5 Conclusion
The present study postulated that introducing 64.5 mg/kgb.w Lepidium sativum to the daily diet decreases body weight gain, through modulation of blood glycemic profile and plasma atherogenic index and reduces adipogenesis through downregulation of PPARγ, SREBP-1c, FFAs, and AMPKα. Furthermore, it was evidenced-based that supplementation with these seeds reduces inflammation and oxidative stress which are the main contributors to human health deterioration. Results present a novel approach to be adopted by nutritionists and medical specialists to halt obesity-associated metabolic syndrome complications.
Funding
No organization provided funding to the writers for the work they submitted.
Declaration of Competing Interest
The authors declare that they have no known competing financial interests or personal relationships that could have appeared to influence the work reported in this paper.
References
- Effective amelioration of hepatic inflammation and insulin response in high fat diet-fed rats via regulating AKT/mTOR signaling: Role of Lepidium sativum seed extracts. J. Ethnopharmacol.. 2021;266:113439
- [CrossRef] [Google Scholar]
- Crocin prevents metabolic syndrome in rats via enhancing PPAR-gamma and AMPK. Saudi J. Biol. Sci.. 2020;27:1310-1316.
- [CrossRef] [Google Scholar]
- Novel insights on anti-obesity potential of the miracle tree, Moringa oleifera: A systematic review. J. Funct. Foods. 2021;84:104600
- [CrossRef] [Google Scholar]
- Theory and Practice of Histological Techniques (fourth ed.). New York, London, San Francisco, Tokyo: Churchil Livingstone; 1996.
- Phenolic profiles of in vivo and in vitro grown Coriandrum sativum L. Food Chem.. 2012;132:841-848.
- [CrossRef] [Google Scholar]
- Macronutrient-mediated inflammation and oxidative stress: relevance to insulin resistance, obesity, and atherogenesis. J. Clin. Endocrinol. Metab.. 2019;104:6118-6128.
- [CrossRef] [Google Scholar]
- Chemical composition and antioxidant capacity of Lepidium sativum seeds from four regions of morocco. Evid. Based Complement. Alternat. Med.. 2020;2020:32-35.
- [CrossRef] [Google Scholar]
- Identification of phenolic compounds in myricaria bracteata leaves by high-performance liquid chromatography with a diode array detector and liquid chromatography with tandem mass spectrometry. Rev. Bras. 2017;27:576-579.
- [CrossRef] [Google Scholar]
- Phenolic compounds and carotenoids from four fruits native from the Brazilian Atlantic forest. J. Agric. Food Chem.. 2014;62:5072-5084.
- [CrossRef] [Google Scholar]
- Dietary quercetin and kaempferol: bioavailability in humans. Nutrients. 2019;11:2288.
- [Google Scholar]
- Green tea extract prevents obesity in male mice by alleviating gut dysbiosis in association with improved intestinal barrier function that limits endotoxin translocation and adipose inflammation. J. Nutr. Biochem.. 2019;67:78-89.
- [CrossRef] [Google Scholar]
- In vivo diabetic wound healing effect and HPLC–DAD–ESI–MS/MS profiling of the methanol extracts of eight Aloe species. Rev. Bras. 2016;26:352-362.
- [CrossRef] [Google Scholar]
- Characterization of flavonoid glycosides from fenugreek (Trigonella foenum-graecum) crude seeds by HPLC-DAD-ESI/MS analysis. Int. J. Mol. Sci.. 2014;15:20668-20685.
- [CrossRef] [Google Scholar]
- The role of leptin and adiponectin in obesity-associated cognitive decline and Alzheimer’s disease. Front. Neurosci.. 2019;13
- [CrossRef] [Google Scholar]
- Identification of phenolic compounds in Equisetum giganteum by LC-ESI-MS/MS and a new approach to total flavonoid quantification. Talanta. 2013;105:192-203.
- [CrossRef] [Google Scholar]
- Characterization of phenolic compounds in the fruits of Forsythia suspensa by high-performance liquid chromatography coupled with electrospray ionization tandem mass spectrometry. Rapid Commun. Mass Spectrom.. 2007;21:715-729.
- [CrossRef] [Google Scholar]
- Improving fermentation, protein preservation and antioxidant activity of Moringa oleifera leaves silage with gallic acid and tannin acid. Bioresour. Technol.. 2020;297:122390
- [CrossRef] [Google Scholar]
- HPLC-DAD-MS/MS profiling of phenolics from securigera securidaca flowers and its anti-hyperglycemic and anti-hyperlipidemic activities. Rev. Bras. 2015;25:134-141.
- [CrossRef] [Google Scholar]
- The effect of overweight and obesity on liver biochemical markers in children and adolescents. J. Clin. Endocrinol. Metab.. 2020;105
- [CrossRef] [Google Scholar]
- Ultra-fast liquid chromatography coupled with electrospray ionization time-of-flight mass spectrometry for the rapid phenolic profiling of red maple (Acer rubrum) leaves. J. Sep. Sci.. 2018;41:2331-2346.
- [CrossRef] [Google Scholar]
- High-fat diet-induced obesity Rat model: a comparison between Wistar and Sprague-Dawley Rat. Adipocyte. 2016;5:11-21.
- [CrossRef] [Google Scholar]
- Effect of Nigella sativa supplementation on obesity indices: A systematic review and meta-analysis of randomized controlled trials. Complement. Ther. Med.. 2018;38:48-57.
- [CrossRef] [Google Scholar]
- Caffeoylquinic acids and flavonoids of fringed sagewort (Artemisia frigidawilld.): HPLC-DAD-ESI-QQQ-MS profile, HPLC-DAD quantification, in vitro digestion stability, and antioxidant capacity. Antioxidants. 2019;8
- [CrossRef] [Google Scholar]
- Quinoa and chia modulate AMPK/PPAR-ɣ signaling in high-fat diet-induced obesity rat model. Rev. Bras. 2023;33:583-594.
- [CrossRef] [Google Scholar]
- Application of ultra performance liquid chromatography-photodiode detector-quadrupole/time of flight-mass spectrometry (UPLC-PDA-Q/TOF-MS) method for the characterization of phenolic compounds of Lepidium sativum L. sprouts. Eur. Food Res. Technol.. 2013;236:699-706.
- [CrossRef] [Google Scholar]
- Effect of the herbal medicines in obesity and metabolic syndrome: A systematic review and meta-analysis of clinical trials. Phytother. Res.. 2020;34:526-545.
- [CrossRef] [Google Scholar]
- Leukotriene-B4 modulates macrophage metabolism and fat loss in type 1 diabetic mice. J. Leukoc. Biol.. 2019;106:665-675.
- [CrossRef] [Google Scholar]
- Evaluation of phenolic antioxidant-linked in vitro bioactivity of Peruvian corn (Zea mays L.) diversity targeting for potential management of hyperglycemia and obesity. J. Food Sci. Technol.. 2019;56:2909-2924.
- [CrossRef] [Google Scholar]
- Mechanistically acting anti-obesity compositions/formulations of natural origin: a patent review (2010–2021) Expert Opin. Ther. Pat.. 2021;32(1):29-46.
- [CrossRef] [Google Scholar]
- Lepidium sativum: A potential functional food. J. Ayurvedic Herbal Med.. 2021;7(2):140-149.
- [Google Scholar]
- Antioxidant capacities and analysis of phenolic compounds in three endemic nolana species by HPLC-PDA-ESI-MS. Molecules. 2015;20:11490-11507.
- [CrossRef] [Google Scholar]
- Mechanism of antioxidant properties of quercetin and quercetin-DNA complex. J. Mol. Model.. 2020;26(133):1-8.
- [CrossRef] [Google Scholar]
- Screening non-colored phenolics in red wines using liquid chromatography/ultraviolet and mass spectrometry/mass spectrometry libraries. Molecules. 2007;12:679-693.
- [CrossRef] [Google Scholar]
- Characterization of proanthocyanidins from Parkia biglobosa (Jacq.) G. Don. (Fabaceae) by flow injection analysis - Electrospray ionization ion trap tandem mass spectrometry and liquid chromatography/electrospray ionization mass spectrometry. Molecules. 2013;18:2803-2820.
- [CrossRef] [Google Scholar]
- Antidiabetic potential of gallic acid from Emblica officinalis: Improved glucose transporters and insulin sensitivity through PPAR-γ and Akt signaling. Phytomedicine. 2020;73:152906
- [CrossRef] [Google Scholar]
- Analysis of caffeic acid derivatives from Osmanthus yunnanensis using electrospray ionization quadrupole time-of-flight mass spectrometry. Eur. J. Mass Spectrom.. 2009;15:415-429.
- [CrossRef] [Google Scholar]
- Characterization and quantification of the compounds of the ethanolic extract from caesalpinia ferrea stem bark and evaluation of their mutagenic activity. Molecules. 2014;19:16039-16057.
- [CrossRef] [Google Scholar]
- Characterization of phenolic compounds in Erigeron breviscapus by liquid chromatography coupled to electrospray ionization mass spectrometry. Rapid Commun. Mass Spectrom.. 2007;21:2971-2984.
- [CrossRef] [Google Scholar]
Appendix A
Supplementary material
Supplementary data to this article can be found online at https://doi.org/10.1016/j.jksus.2023.102831.
Appendix A
Supplementary material
The following are the Supplementary data to this article:


