

Translate this page into:
Moving magnet linear compressor: Operating characteristics under resonance and off-resonance frequencies
⁎Corresponding authors. chiongmc@ucsiuniversity.edu.my (Meng-Choung Chiong), mcchiong@outlook.com (Meng-Choung Chiong), 007752@yzu.edu.cn (Zhaohua Li), xwchen0513@163.com (Xinwen Chen)
-
Received: ,
Accepted: ,
This article was originally published by Elsevier and was migrated to Scientific Scholar after the change of Publisher.
Peer review under responsibility of King Saud University.
Abstract
Objectives
This study compared the accuracy of a Linear Equivalent model and a Fourier Transform model in approximating the resonant frequency of a moving magnet oil-free linear compressor. Furthermore, moving magnet linear compressor performance under resonance and off-resonance frequencies was also examined via an experimental approach.
Methods
A Linear Equivalent model and a Fourier Transform model were developed and compared with experimental results at low-pressure ratios of 2–2.5. By varying the operating frequency and compressor piston stroke, the power consumption, compressor losses, efficiency, and cooling capacity are assessed experimentally.
Results
This study showed that the disparities between resonance frequencies estimated by theoretical models and experimental data were below 10 %. However, the Linear Equivalent model was more accurate than the Fourier Transform model in forecasting the resonance frequency of the linear compressor at a low-pressure ratio of 2–2.5. Both experimental and modelling results showed that the resonance frequency of a linear compressor declined with the increasing compressor stroke but increased with increasing pressure ratio. Experiments were also carried out to compare the performance of linear compressors in resonance and off-resonance frequencies. Results showed that the lowest compressor input power of 91.96 W and the highest motor efficiency of 81.98 % was achieved when the linear compressor was operated at 38 Hz resonance frequency. Moreover, the cooling capacity has been found to increase by 270 W approximately when the linear compressor piston operating stoke extends from 10 mm to 13 mm.
Conclusions
In all, this study showed that the linear compressor motor efficiency is the highest when operating at resonance frequency. However, the cooling capacity of the linear compressor system does not vary significantly with operating frequency. A higher cooling capacity can be achieved by increasing compressor piston stroke.
Keywords
Linear Equivalent model
Fourier Transform model
Resonance frequency
Cooling capacity
Linear compressor

1 Introduction
As the global economy and human populations continue to grow, the demand for automobiles is also escalating which in turn causes the resulting energy shortage and environmental pollution problems to become more conspicuous (Lü et al., 2018; Shen et al., 2019; Zhang et al., 2021). Speeding up the development of electric vehicles (EVs) can be an effective solution to relieve energy and environmental tensions, it is also a strategic measure to accelerate the transformation of the automobile industry (Ali and Söffker, 2018; Liu et al., 2018; Minh et al., 2021; Qi et al., 2019; Wu et al., 2019). The air conditioning system is one of the major energy-consuming systems of electric vehicles (Essa et al., 2021). The results are confirmatory that air conditioning consumes over 32 % traction energy in daily commute, with a significant impact on the all-electric range (Bellocchi et al., 2018). The development of an energy-efficient electric air conditioning system is imminent to foster the adoption of EVs worldwide.
Automobile refrigerator compressor can be categorised into the conventional compressor and linear compressors, driven by a rotary motor and linear motor, respectively (Liang, 2018). Conventional compressors use a crank-link mechanism to turn the rotational motion of the rotary motor to a reciprocal linear motion. The drawbacks of cranks usage in mechanical conversion links are high friction losses and high noise levels (Jomde et al., 2018; Sharma and Parey, 2019; Xiao et al., 2019; Zhang et al., 2020). In contrast to conventional compressors, linear compressors eliminate the crank linkage mechanism so that the linear motor drive directly drives the piston in a reciprocating motion. Moreover, at present, nearly all compressors in electric vehicle air conditioning systems utilise a lubrication system. The lubrication system will increase the structural size and weight of the electric air conditioning system, and the lubricating oil also has adverse effects to the heat exchange efficiency in the condenser and evaporator of air conditioning system (Liang, 2017). As such, it is of great significance to develop an oil-free linear compressor that can be used in electric vehicle air conditioning systems.
A study by Park et al. (2002) highlighted that experimental results showed that linear compressors are 20–30 % more efficient than reciprocating compressors using rotary induction motors by comparing the losses of linear and rotary induction motors. The results of an experimental analysis of linear compressor by Bradshaw showed that it is up to 35 % more efficient than a conventional crank-driven reciprocating compressor (Bradshaw et al., 2013). A performance comparison between a moving magnet linear compressor and a reciprocating crank-driven compressor was carried out in an experiment (Liang et al., 2014b). The results showed that linear compressor has a much higher motor efficiency (86 %), while conventional reciprocating compressor showed a lower motor efficiency (60 %). The aforementioned studies set out linear compressors present a superior performance as compared to conventional compressors.
The linear compressor can be modelled as a mass-damper-spring system with optimum operating efficiency is closely related to that of the mass-damper-spring system's frequency (Li et al., 2021). The study of accurate prediction of the optimum operating efficiency is important for achieving efficient compressor operation. Zou et al. (2020) developed a linear compressor dynamic model and showed that the linear compressor system's natural frequency depends on the spring's equivalent stiffness factor, the mass of the moving piston assembly, and the equivalent damping factor of the system. You et al. (2018) have studied the relationship between resonant frequency and linear compressor's intrinsic parameters. It was shown that resonant frequency decreases with increasing moving mass. Xia and Chen (2010) utilised computational fluid dynamics (CFD) and finite element analysis (FEA) to investigate the frequency of linear compressors, unveiling that the frequency of a moving magnet linear compressor is influenced by mechanical springs and effective gas springs stiffness. Gas springs stiffness is due to the presence of the axial clearance volume at the front of the compressor cylinder. For different types of linear compressors, it is essential to effectively anticipate the gas equivalent spring stiffness values so that the operating frequency can be corrected to its optimum operating conditions.
In this paper, a Linear Equivalent model and a Fourier Transform model were employed to estimate the stiffness of a gas spring using a moving magnetic oil-free linear compressor (Liang et al., 2016), and the validity of the two models is compared experimentally. The variation in the performance of the linear compressor system under offset resonant operation is also examined. Finally, the effects of variable frequency control and variable stroke control of the linear compressor system on cooling capacity and Coefficient of Performance (COP) are compared.
2 Experimental setup
2.1 Moving magnet linear compressor
This experiment was carried out on a moving magnet linear compressor designed by Liang et al. (2016). Different from the other moving magnet linear compressors, its flex spring system consists of two sets of axially separated flex springs, which are mainly used to support the moving piston and limit its displacement along the cylinder axis (Liang et al., 2016). Furthermore, high radial stiffness of flexible spring effectively limits the radial displacement of the piston, prevents wear on the piston and cylinder, and reduces gas residues caused by radial gas leakage (Liang et al., 2016). However, the gas residues are still unavoidable. The residual gas affects equivalent gas stiffness and thus the resonant frequency of the compressor, so it is necessary to model and experimentally study this compressor. Table 1 shows the linear compressor parameters of the designed experiment.
Parameter
Value
Piston mass (kg)
0.66
Coil resistance for each compressor (Ω)
3.5
Distance between the datum position and cylinder head (mm)
7.57
Piston diameter (mm)
18.99
Piston length (mm)
31
Maximum stroke (mm)
14
Clearance between piston and cylinder (mm)
0.0125
Motor force constant (N/A)
30
Damping coefficient (N·s/m)
0.0475
Mechanical Stiffness (N/m)
16284.85
2.2 Test rig
Fig. 1 shows a schematic diagram of the experimental system and Fig. 2 shows the complete test rig. The test rig is equipped with a moving magnet linear compressor, a condenser, an evaporator, four pressure transducers, six thermocouples, two mass flow meters, two current transducers, and two displacement transducers. The pressure transducers are used to measure separately the pressure at the compressor discharge, the evaporator inlet, the compressor suction and the compressor body. The thermocouples are used to measure the temperature in various parts of the system, including compressor body, compressor discharge, condenser outlet, evaporator inlet, evaporator wall, evaporator outlet, and compressor suction. The mass flow meters are used to measure the mass flow in the main and leakage circuits. The current transducers are used to measure the change in current in the two compressor internal coils, and the displacement transducers are used for the measurement of the compressor piston position. The instruments model and accuracy for experimental system can be found in the Table 2.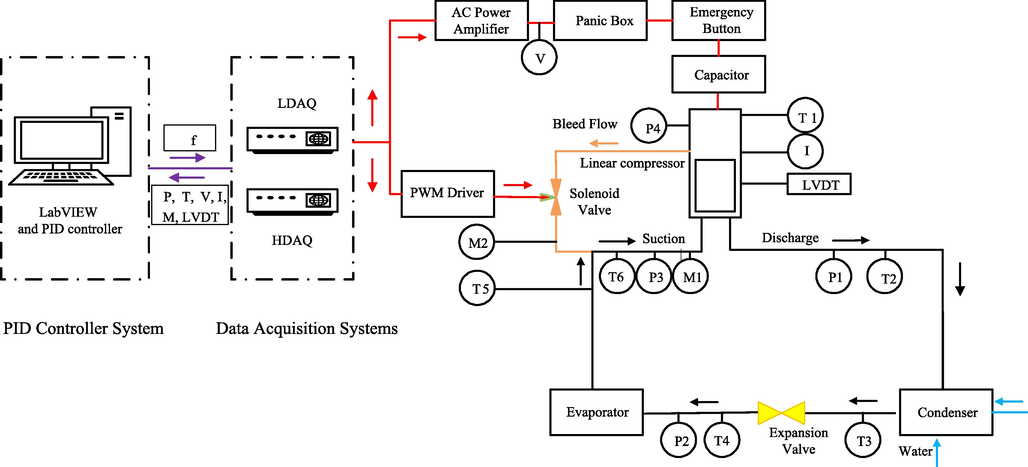
Schematic diagram of an experimental system (Chen et al., 2019).
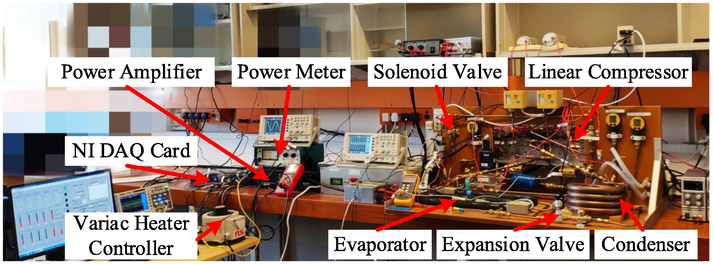
The complete test rig for the moving magnet linear compressor system.
Instruments
Model
Accuracy (refer to value)
Pressure transducer
DRUCK PMP1400
±0.15 %
Thermocouple
K-type
±1.5 °C
Current transducer
LA LEM 25-NP
±0.5 %
Voltage attenuator
Fylde 261HVA HV
±0.5 %
Mass flow meter
Hastings HFM-201
±1%
LVDT
Lucas Schaevitz
0.025 mm
2.3 Date acquisition system
The linear compressor data acquisition system includes a low-speed data acquisition system (LDAQ) and a high-speed data acquisition system (HDAQ). Two NIUSB-6251 data acquisition cards are used in both LDAQ and HDAQ. NIUSB-6251 has 16 analogue inputs (16 bits) and 2 digital outputs with a maximum sampling rate of 1.25 MHz for a single channel. The LDAQ is used to collect parameters such as pressure (discharge, suction, compressor body, and evaporator inlet), temperature (discharge, suction, condenser and evaporator inlet and outlet, compressor body), and mass flow (main flow and leakage flow); the HDAQ is used to collect data on pressure, voltage, current and displacement, the HDAQ has a sampling rate of 5000 Hz. More details can be found in the previous study (Bao et al., 2021).
2.4 Test conditions
The test condition of this study was set as in Table 3. When the measured pressure and temperature have reached steady-state and there is no vapor in the condenser and no liquid in the evaporator, the data acquisition system starts recording and saving the data.
Parameter
Value
Working fluid
R134a
Refrigerant charge(g)
309
Pressure ratio
2.0, 2.5
Stroke(mm)
10–13.5
Condenser outlet temperature (°C)
50
Evaporator inlet temperature (°C)
6–27
Suction temperature (°C)
24–30
Superheat(K)
>5
Ambient temperature (°C)
20
Compressor body temperature (°C)
>45
2.5 Uncertainty analysis
Uncertainty analysis is carried out according to the combined uncertainty equations for two independent uncertainties which can be expressed as:
Where
and
are the Type A and B uncertainty.
Based on Eq. (1) and Eq. (2) (Shen et al., 2022), power consumption, volumetric efficiency, cooling capacity, and COP have a relative uncertainty of 0.95 %, 0.24 %, 2 %, and 2.2 %.
2.6 Mathematical model and experimental verification of resonant frequencies
2.6.1 Linear equivalent model
Linear compressor resonance frequency can be expressed using Eq. (3), where is moving mass, is mechanical spring stiffness, and is equivalent gas spring stiffness of a linear compressor (Liang, 2018). The presence of a clearance volume at the front end of the compressor cylinder causes residual gas always exists inside the compression chamber during the operation of the compressor. The energy stored in the residual gas is acting as an energy storage spring, and it is therefore modelled as an equivalent gas spring.
The value of
was estimated based on Eq. (4), where
and
are linear compressor discharge and suction pressures,
is piston surface area, and
is piston stroke. The slope for Eq. (4) was acquired based on the slope (green dotted line) between the starting point of the compression stroke (1) and expansion stroke (3) in Fig. 3 (Kim et al., 2011).
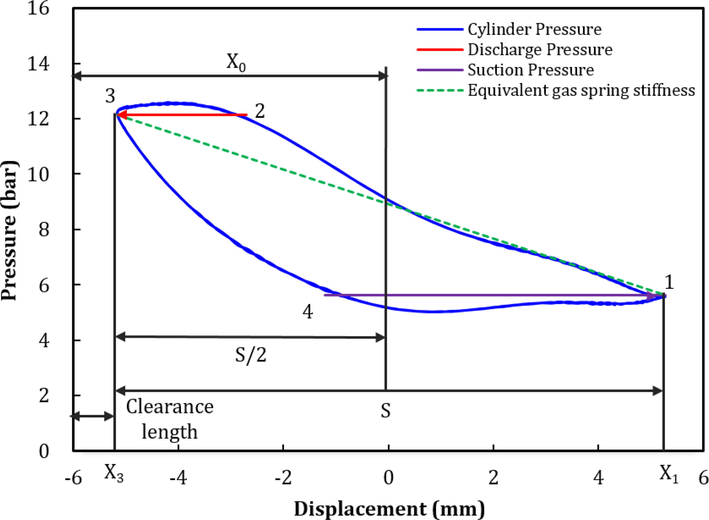
Pressure-displacement diagram for linear compressor operated under 38 Hz frequency, pressure ratio 2.5, and piston stroke 11 mm.
2.6.2 Fourier Transform model
The gas equivalent spring stiffness for the Fourier Transform model
is given by Eq. (5) (Zou et al., 2014):
The
is part of the instantaneous gas force (Eq. (6)) (Tang et al., 2018). The instantaneous gas force is a periodic function that can be expanded into a Fourier series, i.e. the sum of an infinite number of harmonic functions with constant terms. The higher harmonic components of the gas forces have a smaller effect on their amplitude. Therefore, for vibrations at a certain fundamental frequency excitation, it is sufficient to take the first-order harmonic component with the direct current (DC) component. The instantaneous gas force is the sum of an equivalent spring force, a damping force, and an equivalent static force, given by Eq. (5) (Tang et al., 2018), where
is related to the equivalent gas spring stiffness (Eq. (7)),
is related to the damping coefficient, and
is related to the piston offset (Li et al., 2022).
and
are angular positions of the harmonic piston motion at points 2 and 4 respectively in Fig. 3, given by Eqs. (8) and (9) (Kim, 2000).
is the sum of the axial clearance length and half of the piston stroke which can be found in Fig. 3.
 , on the other hand, is expressed by Eq. (10) where
is the in-cylinder gas pressure,
is compressor body pressure (Sun et al., 2021).
, on the other hand, is expressed by Eq. (10) where
is the in-cylinder gas pressure,
is compressor body pressure (Sun et al., 2021).
To simplify the calculation of gas forces, it was assumed that there are no pressure fluctuations in the suction and discharge processes. Such assumption was based on a study showing that pressure fluctuations in the suction and discharge processes have only insignificant effect on gas forces (Li et al., 2022). The cylinder pressure
can be then expressed as Eq. (11) (Kim, 2000).
Where is reference position, is pressure at that reference position, and is adiabatic index at 1.13. The reference position is the upper extreme for compression process and the lower extreme for expansion process, which are denoted by and respectively in Fig. 3.
3 Result and discussion
3.1 Estimation of linear compressor resonant frequency
Fig. 4 compares the estimated linear compressor resonant frequency with that obtained experimentally. Compressor pressure ratios 2.0 and 2.5 are considered in this study with compressor stroke varying from 10 ∼ 13.2 mm. Overall, the resonance frequency of the compressor declines with the increase of compressor operating stroke. Nonetheless, the resonance frequency rises with the elevation of the compressor pressure ratio. Both models exhibit an estimation error of less than 10 %, but the Linear Equivalent model is notably more accurate than the Fourier Transform model in approximating the resonant frequency.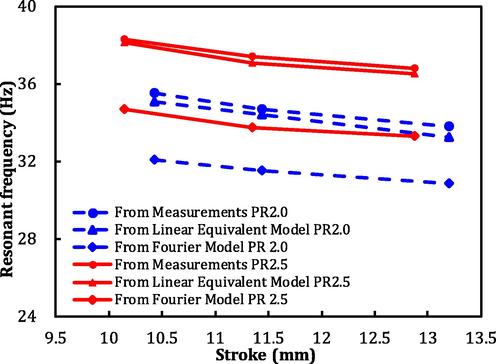
Comparison of experimental values and calculated values from two models.
The discrepancies between theoretical models and experimental data can be attributed to the existing theoretical models considering only the residual gas due to the clearance volume at the front end of the compressor cylinder and in between piston and cylinder. The presence of a clearance gap between piston and cylinder causes a fraction of the intake gas to be not compressed thus undesirably leading to an energy loss. In practice, however, the residual gas also penetrates the vent and escapes through valves during the gas exchange process (Hwang and Lee, 2019). The gas leaking through valves was not considered in the present model, thus resulting in a less accurate estimation of the equivalent gas spring stiffness and resonant frequency.
Furthermore, it can be observed also that the Fourier Transform model exhibits a considerably lower accuracy than the Linear Equivalent model in approximating the compressor resonant frequency. The equivalent gas spring stiffness exhibits highly non-linear characteristics at a high-pressure ratio operation (Liang, 2018), but at the present experimental pressure ratios (2.0 and 2.5) where the non-linear characteristics of the equivalent gas spring are less pronounced, the Linear Equivalent model turns out being a more reliable tool in estimating the equivalent gas spring stiffness and linear compressor resonant frequency. At a higher pressure ratio where non-linear characteristics of the equivalent gas spring are magnified, the Fourier Transform model is expected to give a more accurate estimation of resonant frequency (Bijanzad et al., 2020). The present study shows that the Linear Equivalent model is a more precise tool for estimating the linear compressor resonance frequency at pressure ratios 2.0 and 2.5, a regime where non-linear characteristics of the equivalent gas spring are less prominent.
3.2 Resonance characteristics of the linear compressor
Fig. 5 shows the variation of shaft force, spring force, inertia force and damping force over time for a linear compressor under resonance frequency 38 Hz. The shaft force varies continuously with armature, piston position and instantaneous excitation current, so it is difficult to measure the shaft force of the motor directly. The shaft force can be calculated from the Force-Current-Displacement calibration map (Zhu et al., 2021). The shaft force varies sinusoidally over a cycle and peaks at 56.8 N at 0.0128 s. The spring force is related to the mechanical spring stiffness and piston displacement. The mechanical spring stiffness of the linear compressor is 16284.85 N/m. The real-time displacement in the cylinder can be determined from the piston position measured by a displacement transducer. The piston is closest to the top of the cylinder at 0.0054 s. and the mechanical spring force reaches a maximum of 90.1 N. The damping force is dependent on the damping coefficient and piston velocity, and the inertia force is determined by the moving mass and piston acceleration. Viscous damping is the most important form of damping for linear compressor pistons. In the calculation of the damping coefficient, the flow in the radial clearance is assumed to be laminar and the radial clearance is a fixed value (Liang et al., 2014a). Linear compressor damping coefficient is about 0.0475 N*s/m and moving mass is 0.66 kg.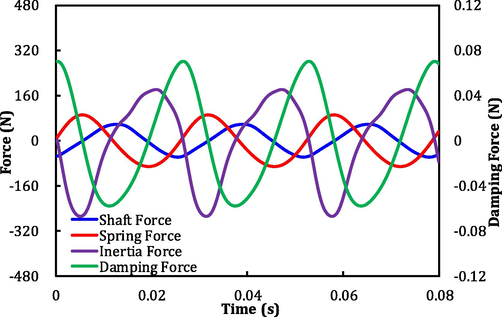
The variation of shaft force, spring force, inertia force and damping force over time for a linear compressor under resonance frequency.
3.3 Off-resonance characteristics of the linear compressor
Linear compressor off-resonance characteristics were also examined in the range of 36–40 Hz band using a linear compressor with an 11 mm stroke and a 2.5 pressure ratio. Fig. 6 illustrates compressor input power and power factor as a function of operating frequency. Compressor power input
was calculated based on the measured voltage and current
, where
is voltage,
is current, and
is operating period (Sun et al., 2021). The linear motor power factor reflects the utilization ratio of the power input. It can be expressed as
(Sun et al., 2021). The power input is lowest at operating frequency of 38 Hz (91.96 W), and the power factor is maximum (0.998). As the operating frequency deviates from 38 Hz, power input rises noticeably. The input power rises to 102.3 W at 36 Hz and 99.09 W at 40 Hz.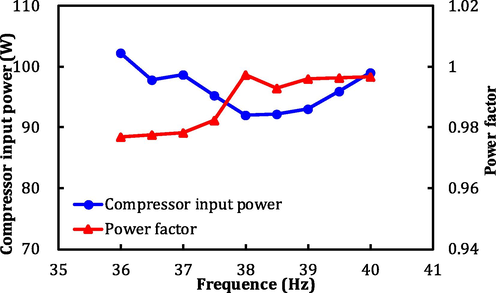
Compressor input power and power factor against operating frequency.
One of the possible reasons that contribute to the lowest input power needed at 38 Hz operating frequency in Fig. 6 is the copper and seal losses are found to be minimal at this specific operating point as demonstrated in Fig. 7. The copper loss is the energy loss due to resistive heating. The copper loss
was calculated using
(Chen et al., 2020a). Where
is the total coil resistance and
is root mean square (RMS) value of current supplied to the compressor. The seal leakage power loss
is expressed by Eq. (12) (Liang et al., 2013), where
is radial clearance,
is viscosity constant,
is clearance length, and
is amplitude.
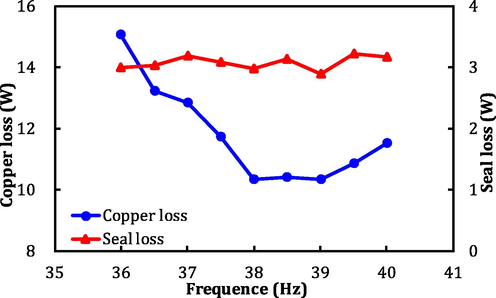
Copper loss and seal loss against operating frequency.
With reference to Fig. 7, the copper loss is minimum at the operating frequency of 38 Hz (∼10 W). At lower (36 Hz) and higher (40 Hz) operating frequencies, the copper loss elevates by ∼ 5.1 W and ∼ 2 W, respectively. The seal loss does not vary significantly with operating frequency, fluctuating at about 3.08 W, as seen in Fig. 7. This signifies that the seal loss is weakly dependent on the operating frequency.
Fig. 8 shows the motor efficiency and isentropic efficiency against operating frequency. The motor efficiency
and isentropic efficiency
can be expressed as:
and
(Sun et al., 2021). Where
is the isentropic discharge enthalpy of the compressor and
is the suction enthalpy of the compressor. Owing to the compressor losses being minimum at 38 Hz, the maximum motor efficiency and isentropic efficiency were acquired at 38 Hz operating frequency, with a motor efficiency of 81.98 % and an isentropic efficiency of 51.31 %. The motor efficiency and isentropic efficiency both fell by 3.32 % and 4.47 %, respectively, when operating at 36 Hz. When the compressor stroke is fixed, volumetric efficiency does not change considerably with the compressor working frequency. The largest change in volumetric efficiency while the compressor runs at 36–40 Hz is about 3.2 %. As a result, the compressor that operates at off-resonance consumes approximately 2.8 % more energy than that at the resonance frequency.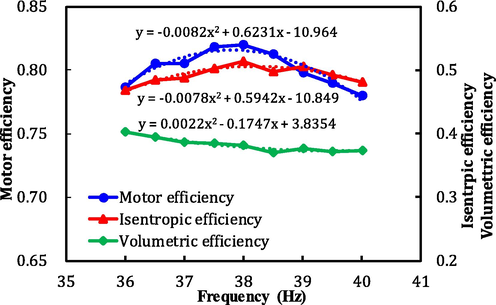
Motor efficiency, isentropic efficiency, and volumetric efficiency against operating frequency.
Cooling capacity and COP are important indicators for evaluating the performance of refrigeration systems. In contrast to conventional compressors with start-stop regulation and frequency regulation, linear compressors can regulate cooling capacity by varying the drive frequency and piston stroke. Cooling capacity
can be calculated using
(Chen et al., 2020b). Where,
is refrigerant enthalpy at compressor inlet. COP was calculated using
(Chen et al., 2020b). Fig. 9a shows the COP and cooling capacity at a variable drive frequency for a fixed stroke of 11 mm. The cooling capacity does not change substantially with frequency when the compressor is operating near the resonance frequency. The COP, on the other hand, has a nearly symmetrical tendency over the frequency range. The highest COP is 3.39 and the cooling capacity is 312.17 W when the operating frequency is at the resonance frequency. This is because the input power is low at the resonance frequency. Nonetheless, as the operating frequency is changed from the resonance frequency, the input power increases and the COP declines. The COP reduces to 3.01 at 40 Hz.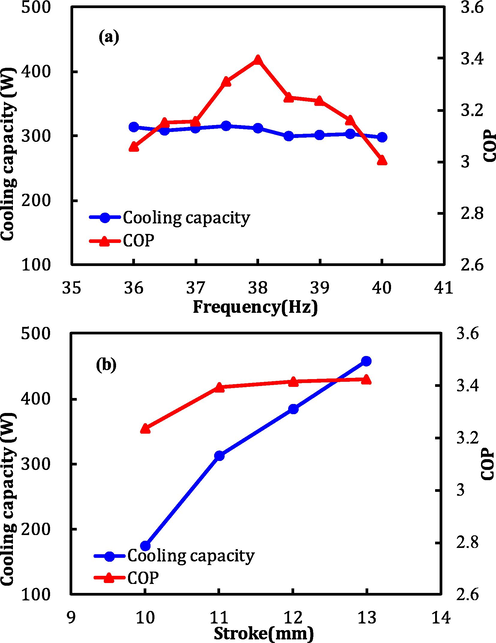
(a) Cooling capacity and COP at a variable drive frequency for a fixed stroke of 11 mm (b) Cooling capacity and COP at a variable stroke for a fixed frequency of 38 Hz.
The COP and cooling capacity at the resonant frequency with varying compressor strokes are shown in Fig. 9b. With an increasing stroke, cooling capacity and COP rise in a roughly linear fashion. The maximum cooling capacity is 457.96 W and the maximum COP is 3.42 at a stroke of 13 mm. Sun et al. (2021) also found that when piston stroke increases, compressor input power operating at a given frequency with changing strokes also rises. The cooling capacity and input power both increase linearly as the compressor stroke extends, however, the rate of increase in input power is notably lower than the cooling capacity.
4 Conclusion
This study unveils that the linear compressor resonance frequency exhibits a linearly decreasing trend with the increase of compressor operating stroke. Nonetheless, the linear compressor resonance frequency increases significantly (∼3 Hz) as the compressor pressure ratio elevates from 2.0 to 2.5. The Linear Equivalent model is more accurate in estimating the compressor resonant frequency than the Fourier Transform model, despite the errors for both models being less than 10 % when compared with experimental data. The Linear Equivalent model is evidently a more reliable tool than the Fourier Transform model in approximating linear compressor resonant frequency for pressure ratio 2–2.5.
The input power required to operate the compressor is the lowest when the compressor is operating at the resonance frequency. The compressor input power increases by a factor of approximately 1.2 as the compressor operating frequency reduces by 2 Hz. Concurrently, the compressor isentropic efficiency reduces by ∼ 3.1 % as the compressor operating frequency lowers by 2 Hz. The cooling capacity of a linear compressor system does not vary significantly with the operating frequency; the COP is highest (3.42) at the resonance frequency. The cooling capacity of a linear compressor system can be increased by increasing the compressor operating stroke. The cooling capacity has been found to increase by ∼ 270 W when the compressor operating stoke extends by 3 mm.
Acknowledgements
Xueliang Fang thanks the financial support from Yangzhou Polytechnic Institute through the Natural Science Foundation (2021xjzk014). Meng-Choung Chiong thanks the financial support from UCSI University through the Research Excellence & Innovative Grant (REIG-FETBE-2021/035).
Declaration of Competing Interest
The authors declare that they have no known competing financial interests or personal relationships that could have appeared to influence the work reported in this paper.
References
- Towards optimal power management of hybrid electric vehicles in real-time: a review on methods, challenges, and state-of-the-art solutions. Energies. 2018;11:1-24.
- [CrossRef] [Google Scholar]
- Development of experimental platform for performance test of oil-free linear compressor. Cryog. Supercond.. 2021;49:76-81.
- [Google Scholar]
- Reversible heat pump HVAC system with regenerative heat exchanger for electric vehicles: analysis of its impact on driving range. Appl. Therm. Eng.. 2018;129:290-305.
- [CrossRef] [Google Scholar]
- Development of a new moving magnet linear compressor. Part A: design and modeling. Int. J. Refrig.. 2020;113:70-79.
- [CrossRef] [Google Scholar]
- Linear compressors for electronics cooling: energy recovery and its benefits. Int. J. Refrig.. 2013;36:2007-2013.
- [CrossRef] [Google Scholar]
- Modelling of refrigerant distribution in an oil-free refrigeration system using R134a. Energies. 2019;12
- [CrossRef] [Google Scholar]
- Modelling and measurement of a moving magnet linear motor for linear compressor. Energies. 2020;13
- [CrossRef] [Google Scholar]
- Experimental assessment of alternative low global warming potential refrigerants for automotive air conditioners application. Case Stud. Therm. Eng.. 2020;22:100800
- [CrossRef] [Google Scholar]
- Analysis of nonlinear dynamics in a linear compressor. JSME International Journal Series C Mechanical Systems, Machine Elements and Manufacturing. 2000;43(3):545-552.
- [Google Scholar]
- Air conditioning cycle simulations using a ultrahigh-speed centrifugal compressor for electric vehicle applications. Int. J. Refrig.. 2021;131:803-816.
- [CrossRef] [Google Scholar]
- Study on performance change in a linear compressor considering refrigerant leakage through the suction valve clearance. J. Mech. Sci. Technol.. 2019;33:2665-2670.
- [CrossRef] [Google Scholar]
- Modeling and measurement of a moving coil oil-free linear compressor performance for refrigeration application using R134a. Int. J. Refrig.. 2018;88:182-194.
- [CrossRef] [Google Scholar]
- An experimental and numerical study on an inherent capacity modulated linear compressor for home refrigerators. Int. J. Refrig.. 2011;34:1415-1423.
- [CrossRef] [Google Scholar]
- Frequency characteristics and piston offset characteristics of oil-free linear compressor. Zhendong yu Chongji/J. Vib. Shock. 2021;40:139-146.
- [CrossRef] [Google Scholar]
- Dynamic behavior analysis of a moving coil oil-free linear compressor in refrigeration system. Int. J. Refrig.. 2022;133:235-246.
- [CrossRef] [Google Scholar]
- A review of linear compressors for refrigeration. Int. J. Refrig.. 2017;84:253-273.
- [CrossRef] [Google Scholar]
- Analysis of oil-free linear compressor operated at high pressure ratios for household refrigeration. Energy. 2018;151:324-331.
- [CrossRef] [Google Scholar]
- Clearance seal compressors with linear motor drives. Part 1: background and system analysis. Proc. Inst. Mech. Eng. Part A J. Power Energy. 2013;227:242-251.
- [CrossRef] [Google Scholar]
- Modelling and measurement of a moving magnet linear compressor performance. Energy. 2014;66:487-495.
- [CrossRef] [Google Scholar]
- Comparison between a crank-drive reciprocating compressor and a novel oil-free linear compressor. Energy Econ.. 2014;45:25-34.
- [CrossRef] [Google Scholar]
- The effect of clearance control on the performance of an oil-free linear refrigeration compressor and a comparison between using a bleed flow and a DC current bias. Int. J. Refrig.. 2016;69:407-417.
- [CrossRef] [Google Scholar]
- Exploring the interactive effects of ambient temperature and vehicle auxiliary loads on electric vehicle energy consumption. Appl. Energy. 2018;227:324-331.
- [CrossRef] [Google Scholar]
- A comprehensive review on hybrid power system for PEMFC-HEV: issues and strategies. Energy Convers. Manag.. 2018;171:1273-1291.
- [CrossRef] [Google Scholar]
- Technical economic analysis of photovoltaic-powered electric vehicle charging stations under different solar irradiation conditions in Vietnam. Sustain.. 2021;13:15-25.
- [CrossRef] [Google Scholar]
- Park, K., Hong, E., Lee, H., 2002. LG Electronics Incorporated, Linear Motor For Linear Compressor. Int. Compress. Eng. Conf. Paper 1544.
- Deep reinforcement learning enabled self-learning control for energy efficient driving. Transp. Res. Part C Emerg. Technol.. 2019;99:67-81.
- [CrossRef] [Google Scholar]
- Performance evaluation of decomposition methods to diagnose leakage in a reciprocating compressor under limited speed variation. Mech. Syst. Signal Process.. 2019;125:275-287.
- [CrossRef] [Google Scholar]
- Numerical modeling of a novel two-stage linear refrigeration compressor. Int. J. Low-Carbon Technol.. 2022;17:436-445.
- [CrossRef] [Google Scholar]
- Automotive exhaust thermoelectric generators: Current status, challenges and future prospects. Energy Convers. Manag.. 2019;195:1138-1173.
- [CrossRef] [Google Scholar]
- A novel oil-free dual piston compressor driven by a moving coil linear motor with capacity regulation using R134a. Sustain.. 2021;13
- [CrossRef] [Google Scholar]
- Fourier series analysis applied in linear compressor vibration analysis. Proc. 2018 IEEE Int. Conf. Mechatronics Autom. ICMA. 2018;2018:1065-1069.
- [CrossRef] [Google Scholar]
- A critical review of battery thermal performance and liquid based battery thermal management. Energy Convers. Manag.. 2019;182:262-281.
- [CrossRef] [Google Scholar]
- Analysis of resonant frequency of moving magnet linear compressor of stirling cryocooler. Int. J. Refrig.. 2010;33:739-744.
- [CrossRef] [Google Scholar]
- Nonlinear dynamic response of reciprocating compressor system with rub-impact fault caused by subsidence. JVC/Journal Vib. Control. 2019;25:1737-1751.
- [CrossRef] [Google Scholar]
- Study on the stroke amplitude of the linear compressor. Appl. Therm. Eng.. 2018;129:1488-1495.
- [CrossRef] [Google Scholar]
- Analysis the drivers of environmental responsibility of chinese auto manufacturing industry based on triple bottom line. Processes. 2021;9
- [CrossRef] [Google Scholar]
- Theoretical analysis of dynamic characteristics in linear compressors. Int. J. Refrig.. 2020;109:114-127.
- [CrossRef] [Google Scholar]
- A numerical model of a linear compressor for household refrigerator. Appl. Therm. Eng.. 2021;198:117467
- [CrossRef] [Google Scholar]
- Performance characteristics around the TDC of linear compressor based on whole-process simulation. J. Mech. Sci. Technol.. 2014;28:4163-4171.
- [CrossRef] [Google Scholar]
- Performance analysis of linear compressor using R290 for commercial refrigerator. Int. J. Refrig.. 2020;109:55-63.
- [CrossRef] [Google Scholar]
Appendix A
Supplementary material
Supplementary data to this article can be found online at https://doi.org/10.1016/j.jksus.2023.102544.
Appendix A
Supplementary material
The following are the Supplementary data to this article:


