

Translate this page into:
Morphological diversity of faba bean (Vicia faba L.) M2 mutant populations induced by gamma radiation and diethyl sulfate
⁎Corresponding author at: Plant Production Department, Faculty of Food and Agricultural Sciences, King Saud University, P.O. BOX 2460, Riyadh 11451, Saudi Arabia. salem@ksu.edu.sa (Salem S. Alghamdi)
-
Received: ,
Accepted: ,
This article was originally published by Elsevier and was migrated to Scientific Scholar after the change of Publisher.
Peer review under responsibility of King Saud University.
Abstract
Induced mutagenesis is one of the most widely used breeding methods for rapidly increasing genetic diversity in many crops. This study used gamma radiation and diethyl sulfate (DES) to increase the genetic diversity in two faba bean genotypes. The genetic diversity assessment was based on 12 qualitative traits. The purpose of this study was to assess the genetic diversity in the M2 faba bean mutant populations and to select promising mutant. A total of 5271 M2 seeds generated from the M1 generation of two genotypes—Hassawi 2 and ILB4347—were used in this study. The seeds of M1 were obtained by gamma-ray exposure (25 and 50 Gy) and treatment of 0.01, 0.02, and 0.05% DES. A total of 4333 (82.2%) seeds germinated, of which 4102 plants survived and were screened for morphological diversity. A total of 36 mutant types are presented in this study. Determinate plant type, white flower color, white hilum, and black seed coat color were some of desirable traits that were considered for further generations. Multivariate-based principal component analyses showed that high genetic diversity was induced by gamma radiation and DES in faba bean mutant populations. This study revealed the potency of gamma radiation and DES on increasing genetic diversity and demonstrated the successful program of induced mutagenesis in the faba bean.
Keywords
Faba bean
Gamma radiation
Diethyl sulfate
Mutant population
Genetic diversity

1 Introduction
Faba bean (Vicia faba L.) is a multipurpose legume crop used in both human food and animal feed because of its high protein content (average of 25%) and biomass (Musallam et al., 2004). It also plays an important role in crop rotations, effective nitrogen fixation, and soil improvement (Ye et al., 2003). However, in the last three decades, very low growth rates of the faba bean’s yield have been recorded because of the slow progress in increasing genetic diversity (Nedumaran et al. (2015). Selection and extensive faba bean cultivation using one particular cultivar, generally with high-yielding variety, leads to an increase faba bean production worldwide, but on the other hand, it was narrowing faba bean genetic diversity. Therefore, enriching genetic diversity as an essential step for most breeding programs is required to raise faba bean’s yield.
Many methods have been utilized to enrich genetic diversity, from a classical genetics approach to the recent transformation genetics methods. Induced mutagenesis is one such transformation method that has been successfully reported for many crops, including the faba bean (Sjödin, 1971). The efficiency of induced mutagenesis to generate mutations valuable for plant breeders has been widely proven and documented through the official release of 3,318 mutant varieties (IAEA, 2019), of which, there are 20 mutant varieties of faba bean. However, no released cultivar of faba bean was reported via induced mutagenesis in the mutant variety database of the International Atomic Energy Agency (IAEA) since 2008.
Induced mutagenesis can be carried out by using physical and chemical mutagens. Physical mutagens are physical agents that usually cause large mutations or large-scale deletions of DNA (Kozjak and Meglič, 2012). Among the physical mutagens, gamma radiation is the most widely used mutagen in mutation breeding (Kodym et al., 2012). Gamma radiation has been reported as an effective mutagen to induce diversity in several legume crops, such as pigeon pea (Desai and Rao, 2014), cowpea (Girija et al., 2013), chickpea (Wani and Anis, 2008), and mung bean (Sangsiri et al., 2005). Chemical mutagens are compounds that cause alterations in DNA molecules, such as transitions, transversions, deletions, insertions, inversions, DNA single and double strand breaks, and DNA recombination. One of the chemical mutagens that have been reported to be an efficient inducer of mutations is diethyl sulfate (DES). DES is classified as alkylating agent that react with the DNA structure by alkylating the phosphate group and nitrogen bases (Acquaah, 2007).
The studies on the effectiveness and efficiency of various physical and chemical mutagens to increase genetic diversity have been performed for many crops. Genetic diversity can be identified by using morphological, biochemical, and molecular markers. A morphological marker is a trait widely used by plant breeders that can be assessed by a simple and inexpensive technique for determining genetic diversity. Morphological traits can be divided into qualitative and quantitative traits and the best time for the identification of mutant plants is the M2 generation. In the M2 generation, mutations that possibly occurred in the M1 generation segregate to create homozygotes recessive and/or dominant alleles (Page and Grossniklaus, 2002). Therefore, the present study aims to assess the genetic diversity of the M2 faba bean mutant populations derived from exposure to gamma radiation and treatment with DES, in order to screen and select promising mutant plants based on qualitative traits.
2 Materials and methods
2.1 Plant materials
M2 seeds generated from the M1 generation of two genotypes, namely, Hassawi 2 and ILB4347, were used in this study. The M1 seeds were produced by exposing separate 120 dry seed samples of each genotype to 25 or 50 Gy at a dose rate of 15.48 Gy/min of gamma radiation using a 60Co (Cobalt 60) gamma source under ambient conditions at the Central Lab, College of Science, King Saud University (Nurmansyah et al., 2018), and three concentrations of DES solution (0.01%, 0.02%, and 0.05%). The dry seed were soaked in the DES solution for 12 h at room temperature, and then, they were thoroughly washed under running water thrice. The M1 seeds were then planted and allowed to produce the M2 seeds. The M1 plants are individually harvested and sown as M2 families.
2.2 Experimental site and crop cultivation
The experiments were carried out at Dirab Agricultural Research and Experiment Station, South Riyadh (24° 43′ 34′’ N, 46° 37′ 15′’ E). Faba bean M2 lines from the two aforementioned cultivars were grown in the field according to the Pedigree Method; the M1 plants are individually harvested and sown as M2 families. The net plot size was 4 m × 4 m, with nine rows (each 4 m long) with a 45 cm distance between two rows and 20 cm distance between two plants. The untreated seeds (control) were planted in the first row of each plot. All cultural practices were applied as recommended: diammonium phosphate (18% N2, 46% P2O5) was added at the rate of 300 kg/ha during seedbed preparation; plots were immediately irrigated after sowing; weeds were under control during the vegetative growth of the crop; and the plants were harvested individually at physiological maturity.
2.3 Field observations
2.3.1 Seedling emergence and plant survival
Seedling emergence (SE) was recorded three weeks after sowing, and the percentage of SE was measured on the basis of the total number of seeds sown. Plant survival (PS) was recorded at the maturity stage. The percentage of PS was estimated based on the total number of emerged seedlings.
2.3.2 Morphological characterization
Twelve qualitative traits were recorded throughout the mutant and control plants. Twelve qualitative traits were examined, based on faba bean descriptors from the International Board for Plant Genetic Resources (IBPGR, 1985) and International Union for the Protection of New Varieties of Plants (UPOV, 2003). The twelve qualitative traits include growth habit; flower characteristics that consist of the standard petal color, wing petal color, the intensity of streak, streak color, and level of anthocyanin coloration; seed characteristics consist of seed coat color, seed shape, and hilum color; leaf characteristics consist of leaf shape and size; and stem pigmentation.
Growth habit is characterized as determinate (with terminal inflorescence), semi-determinate (without terminal inflorescence), and indeterminate; standard petal color is characterized as white, violet, dark brown, light brown, pink, red, yellow, and others; wing petal color represents the color of the petal wing; the intensity of streaks is characterized by streaks or lines on a standard petal that is classified as no streaks, slight, moderate, and intense; streak color is the color of streak on the standard petal; and the level of anthocyanin coloration is the intensity of anthocyanin in the standard petal that is classified as absence, small, medium, and high intensity. The seed coat color is characterized by the color of the seed coat observed immediately after harvest; the shape of the seed is characterized as flattened, angular, and rounded; the hilum color is characterized as black, white, colorless, and others; and the leaflet shape is observed in the fully expanded leaves at the intermediate flowering node, and it is classified as narrow, intermediate, and rounded. The leaflet size is characterized as small, medium, and large, and stem pigmentation at the flowering time indicates the level of pigmentation on the stems.
2.4 Morphological mutant frequency and qualitative trait diversity
In the field observation, morphological mutant characteristics for inflorescence variation, leaf, seed, flower, and other mutant morphological phenotypes were recorded and calculated as a frequency of mutation (F). The frequency of the morphological mutant was calculated as
3 Results
3.1 Seedling emergence and plant survival
A total of 5271 M2 seeds were obtained after the mutagenesis of the M1 generation from two cultivars, Hassawi 2 and ILB4347, which were planted in this study. A total of 4333 (82.2%) seeds germinated, of which 4102 (94.67%) plants survived and produced pods. The statistics for Hassawi 2 mutants consisted of 3631 seeds planted, of which 2945 seeds (81.11%) germinated, and 2778 plants (94.33%) survived, whereas for ILB4347 mutants, 1640 seeds were planted, from which 1388 seeds (84.63%) germinated, and 1324 plants (95.39%) survived (Table 1). Each of the survived mutant plants was recorded for 12 qualitative traits. TS: total seed planted, SE: seedling emergence, PS: plant survival.
Genotype
Treatment
TS
SE
% SE
PS
% PS
Hassawi 2
25 Gy Gamma
2748
2196
79.91
2107
95.95
50 Gy Gamma
671
586
87.33
551
94.03
0.01% DES
173
130
75.14
88
67.69
0.02% DES
23
19
82.61
18
94.74
0.05% DES
16
14
87.50
14
100
Total
3631
2945
81.11
2778
94.33
ILB4347
25 Gy Gamma
1309
1112
84.95
1059
95.23
50 Gy Gamma
170
138
81.18
128
92.75
0.01% DES
123
106
86.18
106
100
0.02% DES
24
21
87.50
21
100
0.05% DES
14
11
78.57
10
90.91
Total
1640
1388
84.63
1324
95.39
3.2 Qualitative trait variations
Mutant populations were screened for 12 qualitative traits. A total of 4102 mutant plants were evaluated for inflorescence, flower characteristics, seed characteristics, leaf characteristics, stem pigmentation, and other features. We observed 36 types of mutant plants that exhibited traits different from the control plants (Table 2). The Hassawi 2 mutant population accounted for 23 out of the 36 mutant types, whereas the ILB4347 mutant populations generated 32 mutant types. The frequency of traits ranged from 0.04 to 21.15%. Seed coat color was the most diverse trait, which generated five novel mutant types: yellow, brown, green, black, and darkened beige, instead of the beige color for the control plant seeds. *: classification based on faba bean descriptor (IBPGR, 1985), **: classification based on UPOV (2003), +: author additional classification, Freq: frequency.
No
Mutant Characteristics
Hassawi 2
ILB 4347
Control traits
Number of mutants
Freq (%)
Number of mutants
Freq (%)
1
Inflorescence
Growth Habit or Inflorescence Architecture*
Determinate
14
0.50
7
0.53
Indeterminate
Peduncle or Inflorescence Stem+
a. Long peduncle
1
0.04
–
–
Single short
b. Double peduncle
–
–
1
0.08
2
Flower Characteristics
Wing Petal Color*
a. Yellow spotted
–
–
27
2.04
Black spotted
b. Light yellow spotted
–
–
20
1.51
c. White
3
0.11
9
0.68
d. Faded black
1
0.04
2
0.15
Intensity of Streak*
a. Absence
–
–
30
2.27
Medium
b. Slight
–
–
79
5.97
c. Intense
–
–
110
8.23
Color of Streak+
Purple
3
0.11
5
0.38
Brown
Standard Petal Color*
a. White
380
13.68
84
6.34
Purple spotted
b. Violet spotted
3
0.11
11
0.83
c. Brown spotted
8
0.29
56
4.23
d. Pink spotted
–
–
9
0.68
Level of Anthocyanin Coloration**
a. Absence
380
13.68
108
8.16
Small
b. Medium
–
–
280
21.15
c. High
–
–
54
4.08
3
Seed Characteristics
Seed Coat Color*
a. Yellow
29
1.04
7
0.53
Beige
b. Brown
480
17.28
163
12.31
c. Green
–
–
1
0.08
d. Black
–
–
1
0.08
e. Darken beige
–
–
9
0.68
Hilum Color*
White
18
0.65
17
1.28
Black
Seed Shape*
Flattened
7
0.25
124
9.37
Angular
4
Leaf Characteristics
Leaf Shape*
a. Narrow leaflet
274
9.86
21
1.59
Intermediate leaflet
b. Broad leaflet
231
8.32
–
–
c. Rounded leaflet
2
0.07
–
–
Leaf Size*
a. Small
135
4.86
100
7.55
Medium
b. Large
184
6.62
36
2.72
5
Stem Pigmentation*
a. Absence
564
20.3
100
7.55
Small
b. Medium
163
5.87
155
11.71
c. Intense
15
0.54
33
2.49
6
Other mutants+
Unifoliate
2
0.07
–
–
Giga plant
–
–
2
0.15
Branching pattern
2
0.07
3
0.23
3.2.1 Inflorescence variations
Inflorescence is a group of flowers that spread on the flower stem called peduncle. In the legume plants, raceme as well as panicle inflorescence are common. Variations in the inflorescence architecture and peduncle were observed in this study (Fig. 1). Both control plants, Hassawi 2 and ILB4347, and most of the faba bean cultivars are classified as compound indeterminate inflorescence (Fig. 1a). Twenty-one compound determinate mutants were found in the mutant populations (Fig. 1b). The ILB4347 mutant population exhibited more frequent determinate type inflorescence than the Hassawi 2 mutant population with a frequency of 0.53% and 0.50%, respectively. The control plants are also characterized by a single short peduncle. Long peduncles and double peduncles were found in the mutant populations (Fig. 1c, 1d). The long peduncle mutant reached a length of 5 cm, while the control plant peduncle only reached 2 cm in length.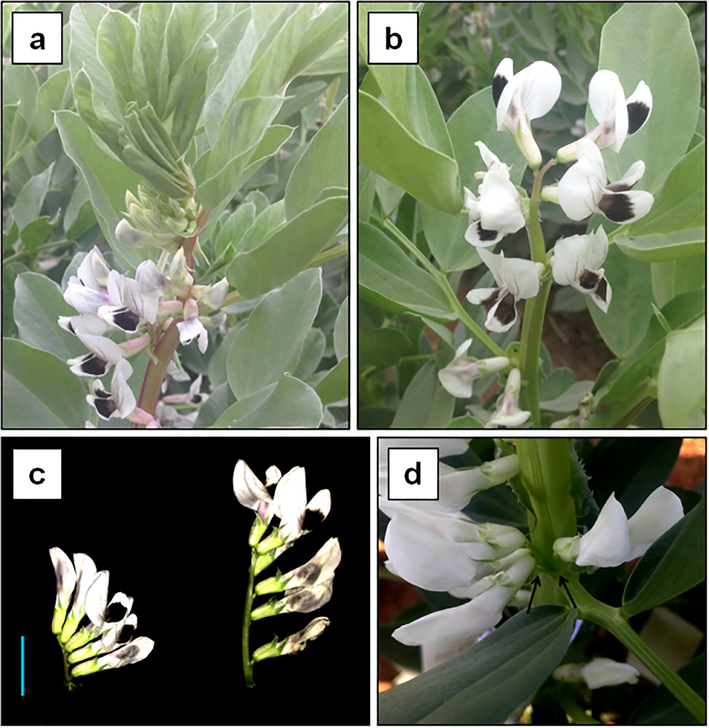
Inflorescence variations. a control indeterminate type without terminal inflorescence. b mutant determinate type with terminal inflorescence. c comparison between control (left) and mutant long peduncle (right), blue bar = 2 cm. d double peduncle mutant.
3.2.2 Variations in flower characteristics
The faba bean flower consists of several parts such as the standard petal, wing petals, keel petals, pistil, and stamens. Based on the faba bean descriptors in the International Board for Plant Genetic Resources (IBPGR) (1985), there are several characteristics of the faba bean flower that can be observed, mainly in the standard and wing petals. Five traits, namely, wing petal color, standard petal color, streak intensity, streak color, and the level of anthocyanin coloration were characterized throughout the mutant plants, which are presented in Fig. 2.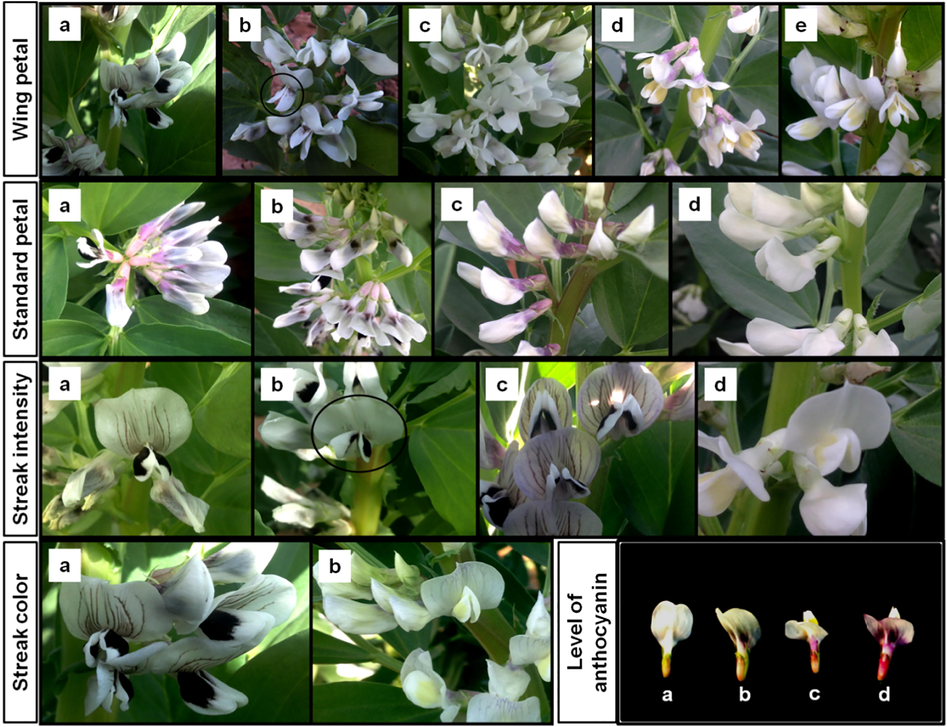
Flower characters variation. Wing petal color variations, a black spotted (control), b faded black, c white, d yellow spotted, e light yellow spotted. Standard petal color variations, a purple spotted (control), b brown spotted, c violet spotted, d white. Intensity of streak variations, a medium intensity (control), b slight, c intense, d absence or without streak. Streak color variations, a brown (control), b purple. Level of anthocyanin coloration variations, a absence or without anthocyanin coloration, b small coloration (control), c medium coloration, d intense coloration.
For the wing petal color, four new mutant colors were identified, namely, faded black, white, yellow, and light yellow, instead of the black spotted wing petal color observed in the control plants. For the standard petal color, the mutants showed brown-spotted, violet-spotted, pink-spotted, and white-colored petals, instead of the purple-spotted color seen in control plants. The intensity and color of streak or lines on the standard petals were also evaluated throughout mutant plants. There are four different types of streak intensities observed, namely medium intensity (control), slight, intense intensity, and absence or without streak. Only one new type of mutant was observed for streak color, which showed a purple color. Another trait that was evaluated for the standard petal was the level of anthocyanin coloration. In the control plants, the levels of anthocyanin coloration are small; however, there were three different variations in anthocyanin coloration observed in mutant plants, which included an absence of anthocyanin coloration, medium, and intense coloration intensity, respectively.
3.2.3 Seed characteristics
Three seed characteristics were evaluated throughout the mutant plants: seed color, seed shape, and hilum color. There were five different seed coat colors, namely, yellow, brown, green, black, and darkened beige instead of the beige generally observed in the control seeds (Fig. 3a). The brown seed coat color showed the highest frequency of appearance in mutants, with 643 mutants out of 4102 plants, followed by yellow, darkened beige, green, and black seed coat colors with 36, 9, 1, and 1 mutants, respectively.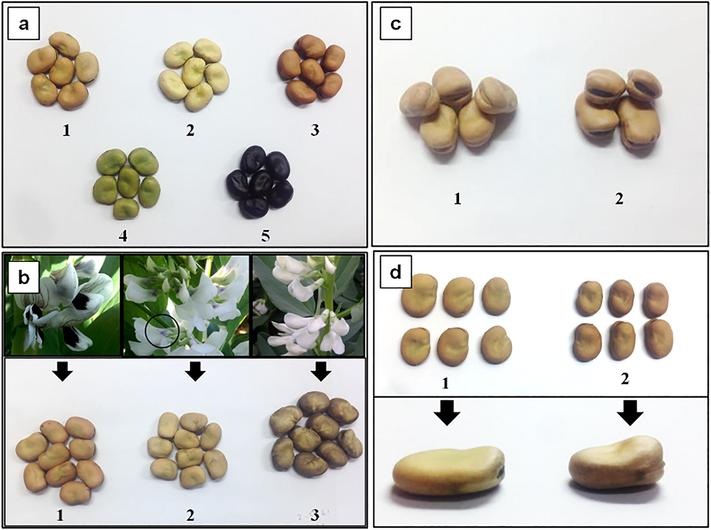
Seed characters variation. a seed coat color variations, 1: beige (control), 2: yellow, 3: brown, 4: green, 5: black. b Comparison of flower colors and their seed colors. 1: black spotted control flower has beige seed, 2: white flower with anthocyanin coloration (black circle) has beige seed, 3: white flower has darken-beige in seed color. c hilum color variations, 1: white, 2: black (control). d Seed shape variations, 1: flattened, 2: angular (control).
The relationship between the white flower mutants and the seed color mutants was studied. We found 12 white flower mutants, with 3 mutants showing low anthocyanin coloration in the standard petal. All white flower mutants without anthocyanin coloration showed a darkened seed color. However, mutants with anthocyanin coloration prevented seed color from becoming dark, and the seed coats remained beige colored, which is the same as the control plant, as indicated in Fig. 3b.
Hilum color and seed shape were also evaluated in the mutant plants. The mutant population showed a white hilum color instead of the black color observed in the control plant (Fig. 3c). Seed shape mutants showed a flattened or flat seed instead of the angular seed observed in the control plants (Fig. 3d).
3.2.4 Leaf characteristics
Leaf characteristics were observed in fully expanded leaves at the intermediate flowering nodes. Leaf shape and size variations were observed in the mutant populations. Compared to the control leaves, the mutants showed narrower or broader leaf shapes (Fig. 4a). There were also two different leaf sizes, namely small or a larger size, instead of an intermediate size observed for the control leaves.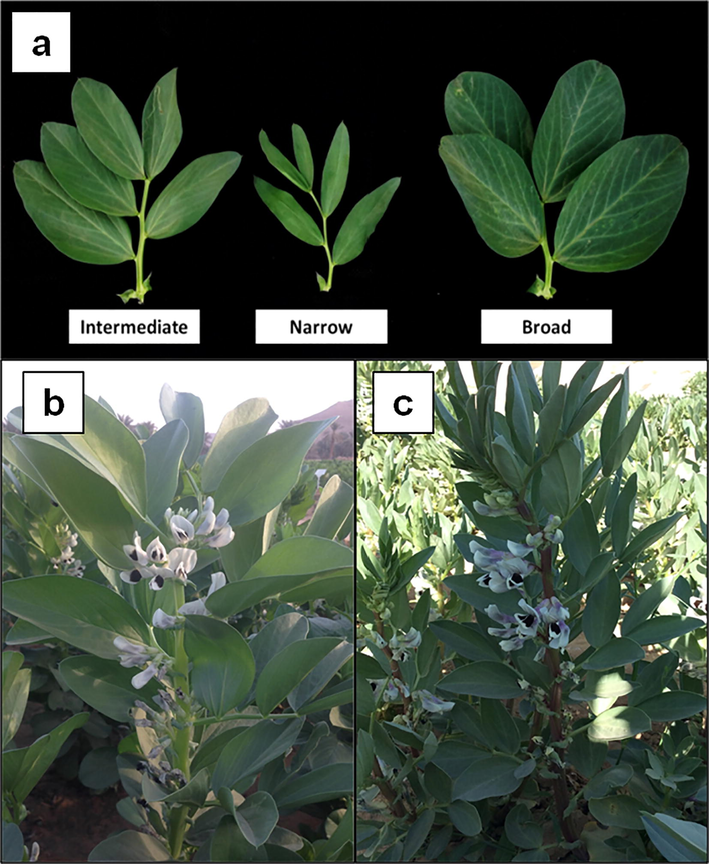
Leaf shape and stem pigmentation variations. a three different leaf shape. b stem without pigmentation (absence). c stem with intense pigmentation.
3.2.5 Stem pigmentation
Stem pigmentation was observed at the time of flowering. Stem pigmentation variations were seen in both the mutant populations. Four different stem pigmentations were found, namely an absence of pigmentation, low, medium, and intense pigmentations (Fig. 4b, c).
3.2.6 Unifoliate mutants
A unifoliate mutant is characterized by a single leaflet instead of the compound leaf found in the control plants. Two unifoliate mutants were found in this study and both of them were observed in the Hassawi 2 mutant population induced by 25-Gy gamma radiation. Another characteristic of the unifoliate mutant was rounded leaflets instead of the intermediate leaflets found in the control plants (Fig. 5a, b, c).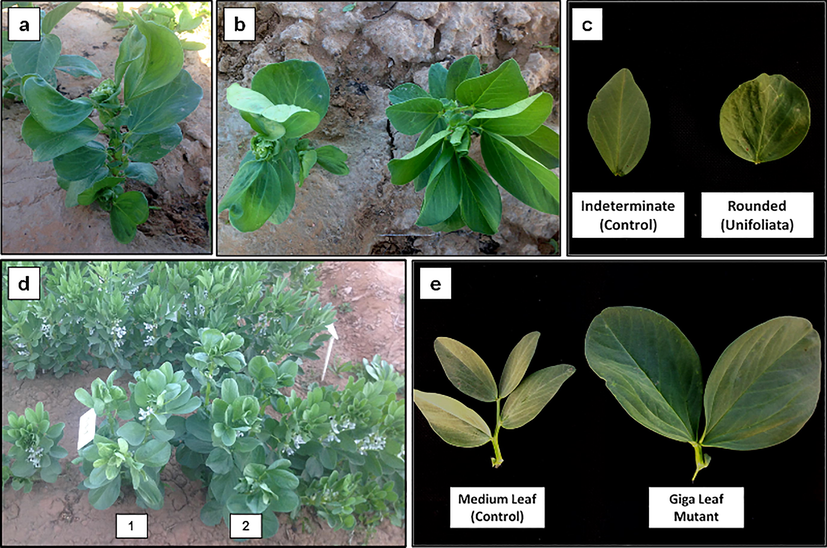
Unifoliate and giga mutant characters. a unifoliate plant structure. b comparison between unifoliate (left) and control plant (right) from above. c comparison between control and unifoliate leaf. d two giga plants in the field. e comparison between control and giga mutant leaf (taken from node number 8).
3.2.7 “Giga” mutants
Giga mutants are characterized as very large plants. Two giga mutants were isolated from the ILB4347 mutant population induced by 0.02% DES. Fig. 5d shows the difference between giga mutants and the other normal plants in the field. The difference in the leaf sizes of the normal plant and giga mutant is also shown in Fig. 5e.
3.2.8 Branching pattern variations
Branching in most faba bean cultivars is usually classified by a lower axillary branching pattern or branching that occurs under or close to the ground. However, mutant branching patterns have been found in this study, which are classified as the homeostasis pattern, upper axillary branch pattern, dichotomous branch pattern, and multi-branch pattern (Fig. 6). The homeostasis pattern is characterized by a plant without branches; the upper axillary branch pattern is characterized by branches that appear on the upper node of the main stem; the dichotomous branch pattern is characterized by the main stem that is divided into two branches with similar sizes; and the multi-branch pattern is characterized by the development of several primary and secondary branches. The primary branch directly generates from the main stem, while the secondary branch develops from the primary branch.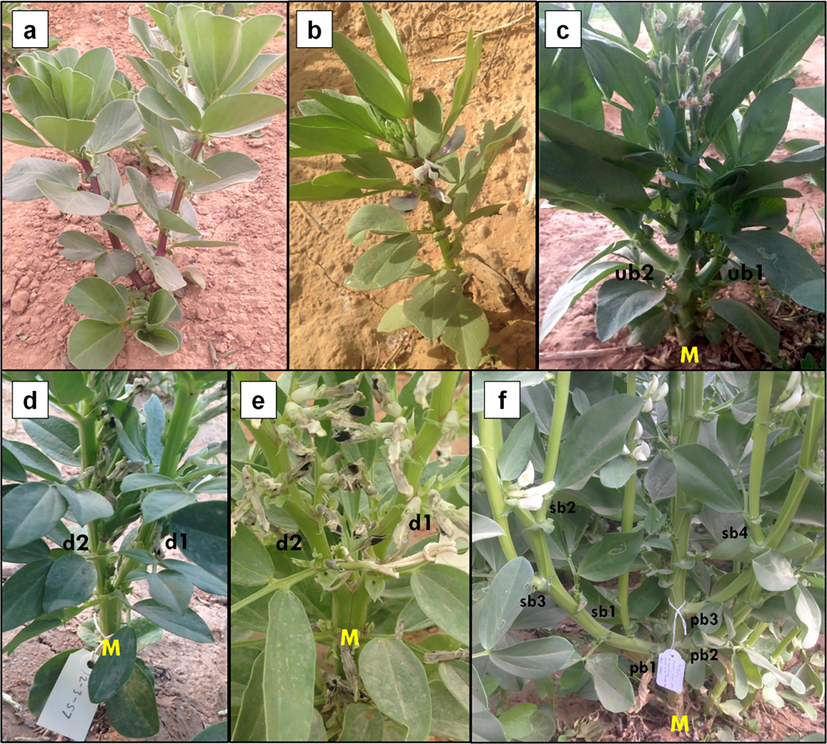
Branching pattern variations. a control lower axillary branch pattern, b homeostatis pattern, c upper axillary branch pattern, d-e dichotomous branch pattern, f multi-branch pattern. M: main stem, ub: upper branch, d: dichotomous branch, pb: primary axillary branch, sb: secondary axillary branch.
3.3 Assessment of genetic diversity and principal component analysis (PCA)
The assessment of genetic diversity based on 12 qualitative traits was performed by evaluating every plant in the mutant populations as indicated in Table 3. In the Hassawi 2 mutant population, 1278 plants (46% plants) showed no significant differences in the traits compared with the control plants, and 1500 plants (54% plants) exhibited variation in at least one trait compared to the control plants. The number of different traits among these mutant plants ranged from one to five traits out of 12 quantitative traits, and 50 different mutant classes of plants were found. In the ILB4347 mutant population, 877 plants or 66.2% plants had at least one different trait from the control plants. The number of different traits among these mutant plants ranged from one to seven traits compared to the control plants, and 110 different mutant classes were found among mutant plants.
No. of different trait
Hassawi 2
ILB4347
Total no. of plant
%
Total no of mutant class
Total no. of plant
%
Total no of mutant class
0
1278
46.0
–
447
33.8
–
1
795
28.6
14
489
36.9
21
2
246
8.9
19
232
17.5
34
3
304
10.9
9
72
5.4
25
4
145
5.2
6
57
4.3
14
5
10
0.4
2
9
0.7
4
6
–
–
–
14
1.1
9
7
–
–
–
4
0.3
3
Total
2778
100
50
1324
100
110
Principal component analysis (PCA) was performed for 50 mutant classes of the Hassawi 2 mutant population and 110 mutant classes of the ILB4347 mutant population, as presented in Supplementary Table S1. The eigenvalue, variability, and cumulative variability were described. The first five principal components (PCs) showed 91.44% diversity in the Hassawi 2 mutant population and 86.54% diversity in the total variance in the ILB4347 mutant population.
The 12 trait loadings based on the Euclidean distance for five PCs from two mutant populations are presented in Supplementary Tables S2 and S3. In the Hassawi 2 mutant population, the first principal component (PC1) that accounted for 50.92% of the total variation, associated positively with stem pigmentation (0.96), whereas the second principal component (PC2) that demonstrated 16.93% of the total variation was related to the leaf shape (0.72), leaf size (0.51), flag petal color (0.31), and anthocyanin pigmentation (0.25). The maximum Euclidean value for the third principal component (PC3) was recorded for seed color (0.92), followed by leaf size (0.23), and leaf shape (0.22).
In the ILB4347 mutant population, PC1 that revealed 34.22% of the total variation was associated with wing petal color (0.45), stem pigmentation (0.45), and seed color (0.43), whereas, PC2 that accounted for 24.42% of the total variation was related to seed color (0.65). The maximum Euclidean value for PC3 was recorded for flag petal color (0.79), followed by anthocyanin pigmentation (0.44), seed color (0.29), and stem pigmentation (0.25).
The scatter biplot of the first two PCs of the two mutant populations is presented in Fig. 7. The two PCs distributed the mutant plants into four quarters, indicating that the mutation induced by gamma radiation exposure and DES treatment succeeded in increasing the genetic diversity in both genotypes. Moreover, there are differences in the main traits involved in the diversity between the two mutant populations. The main traits in the first quarter (positively correlated to PC1 and PC2) of the Hassawi 2 mutant population were stem pigmentation, leaf shape, and growth habit, whereas the main traits in the first quarter of the ILB4347 mutant population were seed color, wing petal color, and streak color.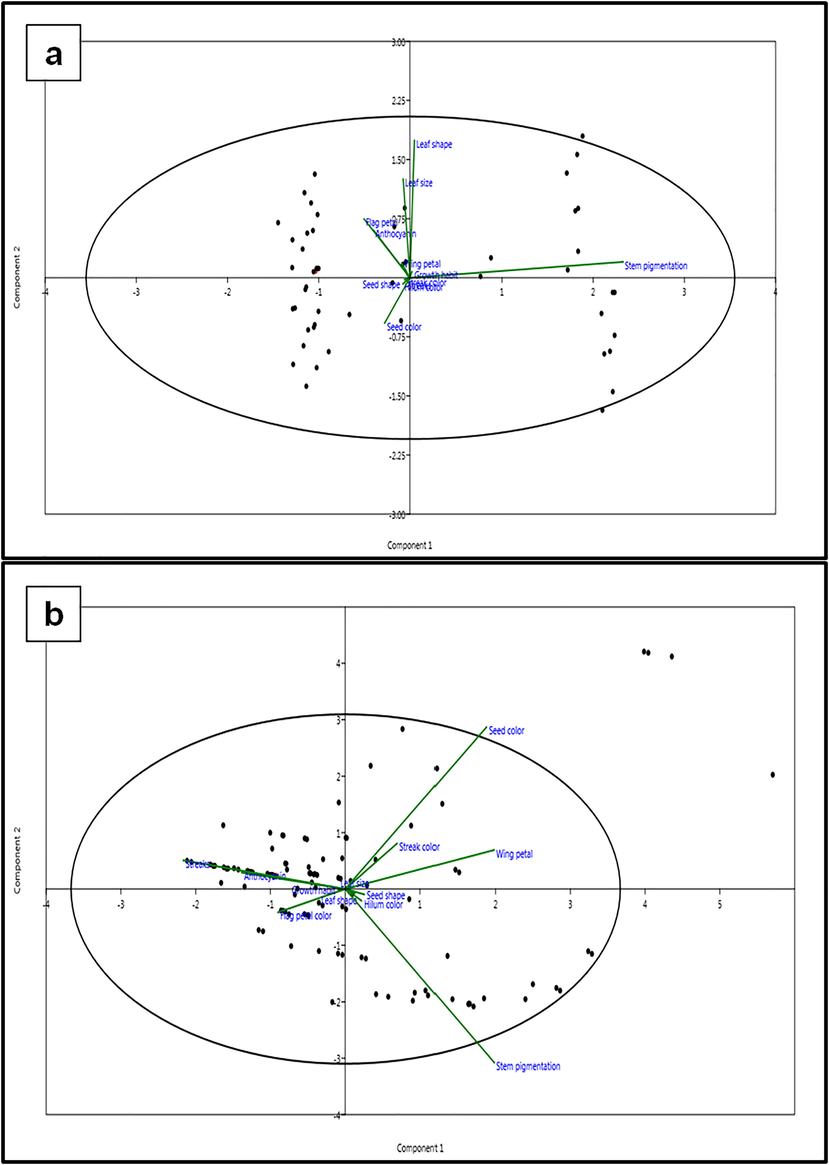
Principle components analysis of 12 qualitative traits in two mutant populations. a two dimensional principle components analysis (PCA) of 12 qualitative traits in Hassawi 2 mutant population. b two dimensional principle components analysis (PCA) of 12 qualitative traits in ILB4347 mutant population.
4 Discussion
Induced mutagenesis has been proposed to rapidly increase genetic diversity in many crops. This study evaluated two doses of gamma radiation and three concentrations of DES in inducing genetic diversity in two faba bean genotypes. The genetic diversity was assessed in the M2 generation of faba beans, which was the most diverse population obtained after mutation breeding in terms of morphological markers. Twelve qualitative traits were used to determine the genetic diversity.
The effect of mutagens on SE and PS was recorded and calculated for each treatment. SE decreased by 17.8% in all mutant plants; a total of 18.9% and 15.4% reduction in SE was recorded in the Hassawi 2 and ILB4347 mutant populations, respectively. This considerable reduction indicated that the effect of gamma radiation and DES on SE also continued in the M2 generation. However, the reduction on SE in the M2 generation was not as markedly observed as in the M1 generation. This could be due to a reduction in the mutagenic effect in the second generation as well as the DNA repair mechanisms operating in the plant cells (Curtis, 2011). Previous studies conducted by Filippetti and De Pace in 1986 reported that SE in the M1 generation of faba bean var. Manfredini decreased by 34% when exposed to 50 Gy of gamma radiation, and Bhat et al. (2007) reported a reduction of 25.3% in seed germination when the faba bean seeds of var. Major were exposed to 0.05% DES. On the other hand, only a 4.6% reduction was recorded in PS; however, most of this reduction in PS was due to environmental effects, pests, and diseases.
This study confirmed the potent effects of gamma radiation and DES in increasing the genetic diversity in the faba bean. The effects were further confirmed by the derivation of 36 new mutants types throughout the mutant plants. The mutants showed variations in determinate growth habit, flower characteristics, leaf characteristics, stem pigmentations, and seed characteristics.
The determinate growth habit has several advantages over indeterminate type in terms of crop management and fruit set production. In crop management, the determinate type facilitates large-scale mechanical harvesting because of the shorter height and higher compactness, and its relatively synchronous maturation (Tian et al., 2010). Furthermore, Avila et al. (2007) stated that the reduction in plant height in the determinate type prevents plants from lodging and promotes a better partitioning of assimilates between vegetative and reproductive growth compared to the indeterminate plants. In the present study, a total of 21 determinate mutants were found in the two populations and most of them were derived from gamma radiation-induced mutants. The detail characteristics of these mutants were described by Nurmansyah et al. (2019). Gamma radiation has also been reported to induce determinate mutants in several legume crops such as urad bean (Vanniarajan et al., 2019), cowpea (Dhanasekar and Reddy 2015), and chickpea (Van Rheenen et al., 1994). The other variation in inflorescence observed in the mutant population was in the peduncle. Long and double peduncles were found in this study; the long peduncle mutant was also observed by Filippetti and De Pace in 1986 upon induced mutagenesis by gamma radiation and EMS.
Flower characteristic variations were also observed in the standard and the wing petal. Flower mutants were identified because of the different colors and the aggregation of pigmented cells in the petals. Jiang and Rausher (2018) found that the different petal pigmentation pattern in the genus Clarkia was due to two simple mutations in a regulatory stretch of DNA that caused a change in the transcription factor binding site. Therefore, the flower mutants in this study may also be derived due to the same mutations that change the transcription factor binding.
The importance of the screening and selection of flower characteristics is associated with the relationship between the flower color and the tannin content—an anti-nutritional factor found in faba bean. Martin et al. (1991) reported that white flowers have the lowest tannin content compared to flowers with other colors. Furthermore, Duc et al. (1999) reported a zero-tannin cultivar called Gloria that had recessive monogenetic segregation and a pure white flower as a pleiotropic effect of this gene. Therefore, the easiest way to produce a tannin-free faba bean is choosing the white-flowered faba bean. On the other hand, the importance of flower characteristics, especially petal pigmentation, is to attract bees as pollinators because the faba bean is a partially cross-pollinated crop with an average 35% outcrossing rate (Bond and Poulsen, 1983). As a consequence of this partially outcrossing nature, the optimal seed set depends on the wild bees for pollination, and a pollinator insufficiency has been reported to decrease the grain yield up to 64% (Nayak et al., 2015).
Seed characteristics are traits important for both the quality and quantity of the seed yield. Different seed coat colors possess different nutritional and anti-nutritional factors. Shazali (1990) reported that the darker color of the faba bean seed corresponded with a lower tannin content and a higher resistance to bruchids, the most detrimental storage pest for pulses. Moreover, Kovinich et al. (2011) indicated that an overaccumulation of anthocyanins altered procyanidin, and reduced flavonol, benzoic acid, and isoflavone content in black seeds compared to the brown seeds of the soybean observed phenotypically as a result of the altered transcription of numerous biosynthetic pathway genes. Another important character in seed is the hilum color. Duc et al. (1999) reported a low vicine cultivar that had monogenetic recessive and white hilum as a morphological marker for this trait.
Seed mutants were also found in different legume crops induced by physical and chemical mutagens. Wani and Anis (2008) found three mutants in chickpea by exposure to gamma radiation and EMS induction, which yielded different seed shapes and showed higher production compared to the control seeds. Similar results were also observed by Barshile (2018), where sodium azide was used to induce bold-seeded mutants in chickpea. Wani et al. (2017) also reported bold seed and long pod mutants in mung bean induced by EMS.
Leaf mutants were also recorded in the present study. The leaves of the control plant were categorized as intermediate in shape with a medium size. Mutants with narrow and broad leaf shapes as well as small and large sizes were found. Moreover, a round leaf shape was also found in the unifoliate mutant. The importance of these leaf characteristics is associated with the efficiency and effectiveness of photosynthesis. Large and broad leaves cause a higher shading effect than small and narrow leaves. Furthermore, these leaf mutants can be used to identify genes that are involved in regulating the leaf morphology in the faba bean. This approach has been used to study genes controlling leaf morphology in pea (Pisum sativum). Moreau et al. (2018) have characterized Stipule reduce (St) as gene controlling cell division and expansion in stipule from fast neutron irradiated pea mutant.
Stem pigmentation is another trait that was found to vary in the mutant populations. Goyal (1965) reported that a green stem was dominant among the pigmented stems. Furthermore, the inheritance of stem pigmentation was also studied in chickpea by Yasar et al. (2014) who found that a single recessive gene is responsible for stem pigmentation in chickpea.
The other mutants found in the present study were the unifoliate and giga plant mutants. Sjödin (1971) reported that some of the unifoliate mutants originated from spontaneous mutations and some from induced mutagenesis using X-rays, neutrons, acetone, and methyl methanesulphonate (MMS). We speculate that the giga mutants are caused due to polyploidy. A polyploid mutant is characterized by larger leaves, flowers, and other gigantisms. Baker et al. (2017) studied the relationship between ploidy level and leaf structure in genus of Brassica. They concluded that there were correlation among leaf morphology, anatomic structures, and physiological function to ploidy level. Colchicine is a mutagen that is widely used to induce polyploidy in many crops. However, because the other mutagens can cause chromosome aberrations, the chances of other mutagens inducing polyploidy in plants are considerably high. Four branching pattern mutants were also found in this study. Fujita and Kawaguchi (2011) suggested that the branching pattern of a plant is determined by the mode of stem cell proliferation and stem cell containment in the shoot apical meristem (SAM).
The assessment of genetic diversity based on 12 qualitative traits in two mutant populations, Hassawi 2 and ILB4347 was performed, and we concluded that more than 50% of the mutant plants have at least one different trait compared to the control plants. Multivariate-based PCA was also performed in this study. Karakoy et al. (2013) reported that multivariate analysis can be used to measure the contribution of relative variation in various traits to the total variability in a crop germplasm collection. The PCA results for two mutant populations explained that different traits have different contributions to the variation and the total variability within the population, which explains the random mutation induced by gamma radiation and DES.
5 Conclusion
This study revealed the potency of gamma radiation and DES on increasing genetic diversity and demonstrated the successful program of induced mutagenesis in the faba bean. A total of 36 mutant types were identified throughout the mutant populations. These results are valuable resources for further faba bean breeding programs. For future research, the mutant plant with desirable traits should be planted in an isolated area to prevent cross-pollination. Selection also should be conducted in several generations due to the chance of segregation. The true breeding behavior of mutant plant was obtained after several generations of selection usually in M6 generation. In this stage, the mutant plant can be used to study gene and gene function of mutant traits. Moreover, the mutant plant can also be used to develop marker related to a particular trait to support marker-assisted selection (MAS).
Acknowledgments
The authors would like to thank Deanship of scientific research for funding and supporting this research through the initiative of DSR Graduate Students Research Support (GSR).
Declaration of Competing Interest
The authors declare that they have no known competing financial interests or personal relationships that could have appeared to influence the work reported in this paper.
References
- Principles of Plant Genetics and Breeding. Oxford: Blackwell Publishing; 2007.
- Development of a new diagnostic marker for growth habit selection in faba bean (Vicia faba L.) breeding. Theor. Appl. Genet.. 2007;115(8):1075-1082.
- [CrossRef] [Google Scholar]
- Polyploidy and the relationship between leaf structure and function: implications for correlated evolution of anatomy, morphology, and physiology in Brassica. BMC Plant Biol.. 2017;17(3):1-12.
- [CrossRef] [Google Scholar]
- Characterization of bold seed mutant in chickpea cultivar Vijay. IJRBAT. 2018;IV(2):17-20.
- [Google Scholar]
- Comparative analysis of mitotic aberrations induced by Diethyl sulphate (DES) and Sodium Azide (SA) in Vicia faba L. (Fabaceae) Pak. J. Biol. Sci.. 2007;10(5):783-787.
- [CrossRef] [Google Scholar]
- Bond, D.A., Poulsen, M.H., 1983. Pollination. In: Hebblethwaite, P.D. (Ed.), The Faba Bean (Vicia faba L.). Butterworths, London, pp. 77–101.
- Curtis, M., 2011. DNA repair pathways and genes in plant. Shu Q, Forster, BP and Nakagawa. H (Eds.), Plant Mutation Breeding and Biotechnology. Rome (Italy): FAO, pp. 57-69. doi: 10.1079/9781780640853.0057.
- Effect of gamma radiation on germination and physiological aspects of pigeon pea (Cajanus cajan (L.) Mill sp) seedlings. Int. J. Res. Appl. Nat. Soc. Sci.. 2014;2(6):47-52.
- [Google Scholar]
- A novel mutation in TFL1 homolog affecting determinacy in cowpea (Vigna unguiculata) Mol. Genet. Genom.. 2015;290:55-65.
- [CrossRef] [Google Scholar]
- Genetic variability for feeding value of faba bean seeds (Vicia faba): comparative chemical composition of isogenics involving zero-tannin and zero-vicine genes. J. Agric. Sci.. 1999;133:185-196.
- [CrossRef] [Google Scholar]
- Improvement of seed yield in Vicia faba L. by using experimental mutagenesis II Comparison of gamma-radiation and ethyl-methane-sulphonate (EMS) in production of morphological mutants. Euphytica. 1986;35:49-59.
- [CrossRef] [Google Scholar]
- Gamma rays and EMS induced flower color and seed mutants in cowpea (Vigna unguiculata L Walp) Adv. Appl. Sci. Res.. 2013;4:134-139.
- [CrossRef] [Google Scholar]
- Breeding behaviour of anthocyanin pigmentation in flower and stem of broad beans (Vicia faba L.) Sci. Cul.. 1965;31:147-148.
- [Google Scholar]
- IAEA. 2019. FAO/IAEA Mutant Varieties Database. http://www.mvdiaea.org (Accessed 30 November 2019).
- IBPGR. 1985. Faba bean descriptors. IBPGR Secretariat, Rome, Italy, p. 17.
- Two genetic changes in cis-regulatory elements caused evolution of petal spot position in Clarkia. Nat. Plants. 2018;4:14-22.
- [CrossRef] [Google Scholar]
- Variation for selected morphological and quality-related traits among 178 faba bean landraces collected from Turkey. Plant Genet. Resour.-Charact. Util.. 2013;12(1):5-13.
- [CrossRef] [Google Scholar]
- Kodym, A., Afza, R., Forster, B.P., Ukai, Y., Nakagawa, H., Mba, C., 2012. Methodology for physical and chemical mutagenic treatments. In: Shu, Q., Forster, B.P., Nakagawa, H. (Eds.) Plant Mutation Breeding and Biotechnology. FAO, Rome, pp. 169–180. doi: 10.1079/9781780640853.0169.
- Combined analysis of transcriptome and metabolite data reveals extensive differences between black and brown nearly-isogenic soybean (Glycine max) seed coats enabling the identification of pigment isogenes. BMC Genom.. 2011;12(381):1-18.
- [CrossRef] [Google Scholar]
- Kozjak, P., Meglič, V., 2012. Mutagenesis in plant breeding for disease and pest resistance. In: Rajnikant, M., (Ed.) Mutagenesis. InTech, pp. 195–220. doi: 10.5772/50332.
- Antinutritional factors in faba bean Tannin content in Vicia faba: possibilities for plant breeding. Options Mediterraneennes. 1991;10:105-110.
- [Google Scholar]
- Identification of Stipules reduced, a leaf morphology gene in pea (Pisum sativum) New Phytologist. 2018;220(1):288-299.
- [CrossRef] [Google Scholar]
- Chemical composition of faba bean genotypes under rainfed and irrigation conditions. Int. J. Agr. Biol.. 2004;6:359-362.
- [Google Scholar]
- Interactive effect of floral abundance and semi-natural habitats on pollinators in field beans (Vicia faba) Agr. Ecosyst. Environ.. 2015;199:58-66.
- [CrossRef] [Google Scholar]
- Nedumaran, S., Abinay, P., Jyosthnaa, P., Shraavya, B., Parthasarthy, R., Bantilan, C., 2015. Grain legumes production, consumption and trade trends in developing countries. Working Paper Series No 60. ICRISAT Research Program, Markets, Institutions and Policies. Patancheru 502 324, Telangana, India.
- Morphological and chromosomal abnormalities in gamma radiation-induced mutagenized faba bean genotypes. Int. J. Rad. Biol.. 2018;94(2):174-185.
- [CrossRef] [Google Scholar]
- Novel inflorescence architecture in gamma radiation-induced faba bean mutant populations. Int. J. Rad. Biol.. 2019;95(12):1744-1751.
- [CrossRef] [Google Scholar]
- The art and design of genetic screens: Arabidopsis thaliana. Nat. Rev. Genet.. 2002;3:124-136.
- [Google Scholar]
- Gamma radiation induced mutations in mungbean. Sci. Asia. 2005;31:251-255.
- [CrossRef] [Google Scholar]
- Faba bean (Vicia faba L) seed coat colour, tannin content, and susceptibility to Brunchids. Int. J. Trop. Insect Sci.. 1990;11(6):855-859.
- [CrossRef] [Google Scholar]
- Induced morphological variation in Vicia faba L. Hereditas. 1971;67:155-I80.
- [CrossRef] [Google Scholar]
- Artificial selection for determinate growth habit in soybean. Proc. Natl. Acad. Sci.. 2010;107(19):8563-8568.
- [CrossRef] [Google Scholar]
- UPOV, 2003. Broad Bean (Vicia faba var major Harz). International Union for The Protection of New Varieties of Plants Geneva, Switzerland, p. 29.
- Gamma rays induced urdbbean (Vigna mungo L. Hepper) mutants with YMV resistance, good batter quality and bold seeded type. Legume Res.. 2019;3824:1-7.
- [CrossRef] [Google Scholar]
- Induction and inheritance of determinate growth habit in chickpea (Cicer arietinum L.) Euphytica. 1994;78:137-141.
- [CrossRef] [Google Scholar]
- Gamma ray and EMS induced bold seeded high yielding mutants in chickpea (Cicer arietinum) Turk. J. Biol.. 2008;32:1-5.
- [Google Scholar]
- Chemo-induced pod and seed mutants in mungbean (Vigna radiata L. Wilczek). SAAARC. J Agri.. 2017;15(2):57-67.
- [CrossRef] [Google Scholar]
- Comparison of expressivity and penetrance of the double podding trait and yield components based on reciprocal crosses of kabuli and desi chickpeas (Cicer arietinum L.) Euphytica. 2014;196:331-339.
- [CrossRef] [Google Scholar]
- Faba Beans in China. Beijing, China: China Agriculture Press; 2003.
Appendix A
Supplementary data
Supplementary data to this article can be found online at https://doi.org/10.1016/j.jksus.2019.12.024.
Appendix A
Supplementary data
The following are the Supplementary data to this article:


