

Translate this page into:
Morpho-physiological traits and stress indices reveal divergence in early-stage salt stress response in elite soybean germplasm
⁎Corresponding authors at: College of Agriculture, Guizhou University, Guiyang, Guizhou, China (L. Li). hariskhurshid8@gmail.com (Haris Khurshid), luhua_li@163.com (Luhua Li) lhli3@gzu.edu.cn (Luhua Li)
-
Received: ,
Accepted: ,
This article was originally published by Elsevier and was migrated to Scientific Scholar after the change of Publisher.
Abstract
This study assessed the salt stress response of seventy soybean genotypes by exposing seedlings to sodium chloride (NaCl) concentrations of 0, 75, 100, and 125 mM. Salinity stress significantly reduced root length, shoot length, fresh and dry root/shoot weight, and root/shoot ratio. A total of 62 genotypes germinated at 125 mM, showing significant phenotypic variation in traits such as root length, shoot length, fresh shoot weight, and dry shoot weight. Pearson’s correlation analysis revealed a strong positive correlation between most morpho-physiological traits, suggesting their interdependence. Eight salinity tolerance indices i.e., Fresh Weight Stress Tolerance Index (FWSI), Dry Weight Stress Tolerance Index (DWSI), Root Length Salinity Index (RLSI), Shoot Length Salinity Index (SLSI), Salinity Tolerance Index (STI), Salinity Susceptibility Index (SSI), Tolerance Index (TI), and Percent Reduction (PR) were calculated to assess genotypes response. Na+ concentration and antioxidant activities significantly increased under salt stress compared to the control. The activities of antioxidant enzymes, as well as the levels of reactive oxygen species (ROS) such as H2O2 and O2−, were markedly higher under salt stress compared to the control. Hierarchical cluster analysis grouped genotypes into six clusters, with clusters V and VI comprising genotypes exhibiting higher salt tolerance based on high FWSI, DWSI, and STI values, and low PR, SSI, and TI values. Eight salinity tolerance indices, including Fresh Weight Stress Tolerance Index (FWSI), Dry Weight Stress Tolerance Index (DWSI), Root Length Salinity Index (RLSI), and Salinity Tolerance Index (STI), were used to evaluate the genotypes’ responses. The study revealed that the average FWSI value for all genotypes under treatments was 54.20 ± 12.93. The highest FWSI was recorded for the genotype Black (92.52), followed by NIBGE-224 (84.70) and NIBGE-183 (81.05). In contrast, Malakand-96 had the lowest FWSI (28.49), followed by SPS-10 (32.74) and SPS-08 (34.55). PGRA-91 had the highest STI (0.83), followed by SPS-9 (0.75) and NIBGE-115 (0.72), while NIBGE-335, SPS-24, and Malakand-96 had the lowest STI values. Positive correlations were observed between root length and shoot length (0.69**), shoot length and fresh shoot weight (0.63**), and other related traits. Overall, this study identified promising soybean genotypes with varying degrees of salt tolerance. These findings can be utilized in breeding programs to develop salt-tolerant soybean varieties for salinity-affected agricultural lands.
Keywords
Soybean
Genetic variation
Germplasm
Correlation
Salinity index
Salt tolerance index
PCA

1 Introduction
Soybean is one of the world's most important crops, primarily grown for its abundant protein and oil content. Its seeds provide nearly half of the world's vegetable oil, while the residual meal is utilized as animal feed (Khurshid et al., 2017). Like other annual crops, soybean is sensitive to the presence of salt in water and soil, which limits its cultivation in regions affected by salinity.
Usually, a soil is labelled as saline if its electric conductivity (EC) value exceeds 4 dSm−1 which is approximately equal to 40 mM NaCl concentration at 25 °C and having 15 % exchangeable sodium. Soybean is usually regarded as a moderately salt tolerant plant as it has shown steady yield until threshold level of 50 mM salt concentration (Gavili et al., 2019). Moreover, the higher concentration of salt is detrimental to soybean plant growth throughout its life cycle whereas the severity of the damage depends upon the growth stage. The salt stress experiments in soybean has revealed that germination stage is most sensitive to salinity as only 5 % growth rate has been observed at 220 mM NaCl level while stunted growth has been observed at 300 mM of salt. Sever effect of salt stress has been observed on agronomic traits such as plant height, inter-node numbers, branches per plant, pods per plant, seed yield per plant and hundred seed weight (Gavili et al., 2019).
The nutritional quality of soybean grains can also be significantly reduced due to production of stress mediated phytochemicals. The effect of salt on soil content in soybean remains paradoxical, with mixed effects reported by researchers (Phang et al., 2008). Nodulation in soybean is a crucial yield-enhancing factor, as biological nitrogen fixation is a key determinant of biomass and grain yield. Previous studies have reported a drastic reduction in soybean nodule formation under saline conditions (Duzan et al., 2004). Salinity plays a strong role in downregulating various physiological processes in plants, such as reducing photosynthesis by decreasing leaf area, stomatal conductance, and chlorophyll content (Ahmad et al., 2019). Researchers have proposed various strategies to mitigate the adverse effects of salinity on agriculture, including leaching salts from the root zone, improving cultural practices, and using salt-tolerant crops (Ahmad et al., 2019).
Currently, limited research has been conducted on salt stress in soybeans, making the development of salt-tolerant varieties the most viable and sustainable solution to prevent production losses in salt-affected soils. To achieve this, breeders must have prior knowledge about genetic potential of soybean to perform under saline conditions. Recently, studies have been conducted to screen large soybean germplasm collections against various levels of salt stresses at different growth stages (Putri et al., 2017).
The genetic control of the salt tolerance in plants is assumed to be governed by numerous genes with quantitative effect. Hence performance evaluation of soybean under salt stress for various morpho-physiological parameters is considered as an effective way to identify tolerant genotypes. Study suggests that about 5 million hectares of soil in Pakistan are affected by salinity, presenting a significant challenge to agricultural productivity (Asad et al., 2020).
The identification of salt tolerant genotypes is vital for breeding program to utilize the genetic tolerance through conventional and modern biotechnological tools for developing superior cultivars (Manchanda and Garg, 2008). Study suggests that about 5 million hectares of soil in Pakistan are affected by salinity, presenting a significant challenge to agricultural productivity (Qureshi, 2016).
Consequently, this study aimed to assess the degree of salinity tolerance during the early seedling stage in Pakistani soybean germplasm and to identify elite genotypes exhibiting tolerance to salt stress.
2 Materials and methods
The experiment was conducted at Oilseeds Research Program, National Agricultural Research Centre, Islamabad, Pakistan. The plant material comprised of seventy elite soybean genotypes (Table 1.) previously selected after agromorphological evaluation of 110 soybean genotypes in our previous study (Khurshid et al., 2019). These genotypes were screened at early seedling stage against NaCl stress for identifying tolerant genotypes as described by Jan et al. (2016). The CRD with 4 replicates, was used for the study. The control replicate (with zero salt stress), was maintained with same treatment with water with addittion of NaCl.
S. No
Genotype
S. No
Genotype
S. No
Genotype
1
NIBGE-97
25
−84
49
GP-21
2
NIBGE-113
26
Malakand-96
50
GP-25
3
NIBGE-115
27
Faisal-Soy
51
GP-31
4
NIBGE-130
28
PGRA-9
52
GP-33
5
NIBGE-183
29
PGRA-25
53
GP-36
6
NIBGE-185
30
PGRA-04
54
SPS-1
7
NIBGE-224
31
PGRA-21
55
SPS-7
8
NIBGE-281
32
PGRA-37
56
SPS-8
9
NIBGE-284
33
PGRA-66
57
SPS-9
10
NIBGE-308
34
PGRA-61
58
SPS-10
11
NIBGE-314
35
PGRA-80
59
SPS-14
12
NIBGE-335
36
PGRA-83
60
SPS-15
13
NIBGE-347
37
PGRA-88
61
SPS-18
14
Ajmeri
38
PGRA-91
62
SPS-22
15
Callend
39
PGRB-55
63
SPS-23
16
Rawal-I
40
PGRB-68
64
SPS-24
17
NARC-II
41
PGRB-70
65
SPS-31
18
NARC-16
42
AVRDC7
66
SPS-33
19
William-82
43
AVRDC9
67
SPS-36
20
PSC-60
44
AVRDC-13
68
SPS-45
21
SA-7260
45
AVRDC14
69
SPS-56
22
E-1360
46
GP-15
70
SPS-157
23
E-1531
47
GP-16
24
Black
48
GP-18
2.1 Seedling growth and salt treatment
Initially, healthy seeds of seventy soybean genotypes were thoroughly washed with double-distilled water for 5 min. These seeds were then treated with a fungicide solution (chlorox 10 %) for 15 min in petri plates. After treatment, the seeds were rinsed with double-distilled water. For each genotype, ten seeds were carefully placed on Whatman filter paper in a petri plate. A total of four set of petriplates were prepared for four salt treatments (0, 75, 100 and 125 mM NaCl) whereas each set has three replications. After placing seeds in all plates, these treatments were watered with a pre-prepared salt solutions (4–5 ml) having salt concentratins of 0, 75, 100 and 125 mM, accordingly. These plates were covered with lid and placed in Sanyo incubator (MIR-153) at 25 °C where light and dark regimes were kept at 16-8hrs, alternately. Only distilled water was added to the plates for four weeks (28 days) and seedling growth was observed. For Na+ content measuremnt at different NaCl treamtents and control, 28 days seedlings from each treatment were collected following the method described in Farhangi-Abriz and Torabian (2018). Enzymatic antioxidant activities were determined using the methods outlined by Dhindsa et al. (1981), Yu et al. (2003), Mansoor et al. (2023), Kohli et al. (2019), Mansoor et al. (2022), and Ahmad et al. (2019).
2.2 Morphometric traits and salinity indices
After four weeks (28 DAS), seedlings were removed from petriplates and data were recorded on morphometric traits i.e. root length (cm), shoot length (cm), fresh root weight (g), fresh shoot weight (g), dry root weight (g), dry shoot weight (g) and shoot/root ratio. For each genotype, fresh root and shoot weight data under salt treatments (75 mM, 100 mM and 125 mM) was pooled to determine the mean biomass. The mean biomass value for each genotype was then used to calculate eight salinity indices as suggested by Agarwal et al. (2015); Nawaz et al. (2019). The details of indices is given below;
-
Fresh weight salinity index (FWSI)
-
Dry weight salinity index (DWSI)
-
Root length salinity index (RLSI)
x 100.
-
Root length salinity index (RLSI)
Stress tolerance index (STI)
Percentage reduction (PR)
Salinity susceptibility index (SSI)
Yss = biomass mean under salinity stress, Yns = biomass mean under non-stress conditions,
Salinity intensity index = 1-(biomass mean of all genotypes under salinity stress/ biomass mean of all genotypes under non stress conditions.
Tolerance index (TI)
TI = Yp-Ys
Yp = biomass under salinity stress, Ys = Biomass under non stress condition
2.3 Data analysis
The data of morphometric traits recorded in control and NaCl treatments were analyzed for descriptive statistics in Statistica 7.0 (Stat Soft, Inc. USA). Analysis of variance was also performed using completely randomized design in Statistix 8.1. Pearson’s correlation was computed for mean values of morphometric traits to determine the relationship between seedling traits. The mean data for morphometric parameters across all treatments were used to perform principal component analysis (PCA) using the prcomp function in R “package”.. Likewise, the mean for eight salinity indices i.e. fresh weight salinity index (FWSI), dry weight salinity index (DWSI), root length salinity index (RLSI), shoot length salinity index (SLSI), salinity tolerance index (STI), salinity susceptibility index (SSI), tolerance index (TI) and percent reduction (PR) were subjected to hierarchical cluster analysis and results were visualized through heatmap using ggplot2 and heatmap2 packages in R studio.
3 Results
3.1 Effect of salt stress on soybean morpho-physiological traits
The adverse effect of salt stress at early seedling stage of soybean was observed viz-a‘-viz root length, shoot length, fresh root weight, fresh shoot weight, dry root weight and dry shoot weight. Data recorded for these traits had above average values for control and lower salt stress level (Fig. 1). Moreover, gradual decline of seedling was observed in morphometric traits with the increase of salt concentration. Among seventy genotypes, only eight accessions i.e. NIBGE-308, NIBGE-335, SPS-09, SPS-26, SPS-56, SPS-157 and one check variety i.e. “Malakand-96” failed to germinate at 125 mM showing sensitivity threshold. One-way analysis of variance (ANOVA) for the completely randomized design (CRD) revealed significant variation (α = 0.05) among treatments. This confirmed differential response of seedling of all seventy soybean genotypes under salt stress conditions. Descriptive statistics (Table 2) showed higher coefficient of variation for traits such as fresh root weight, root length, shoot length and root/shoot ratio. Varying level of salt tolerance also revealed presence of genetic variation in studied soybean germplasm. RL = root length, SL = shoot length, FRW = fresh root weight, FSW = fresh shoot weight, DRW = dry root weight, DSW = dry shoot weight, RL/SL = root shoot length ratio.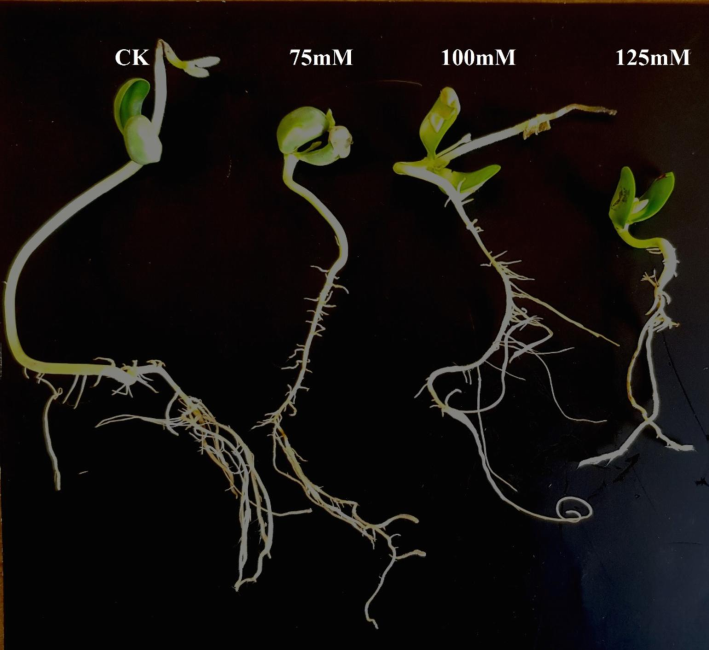
Effect of different salt concentrations on seedling growth in soybean variety Rawal-I.
Trait
Mean
Minimum
Maximum
Variance
Std. Dev.
Std. Error
CV%
RL
8.97
1.99
17.00
13.67
3.70
0.26
41.24
SL
8.79
2.00
17.25
17.88
4.23
0.30
48.11
FRW
0.34
0.01
1.20
0.04
0.20
0.01
57.92
FSW
0.85
0.17
1.81
0.07
0.27
0.02
32.25
DRW
0.05
0.01
0.13
0.00
0.02
0.00
46.64
DSW
0.36
0.21
1.07
0.01
0.11
0.01
31.61
RL/SL
1.19
0.28
5.88
0.50
0.71
0.05
59.47
Across these treatments, significant variations were observed in various seedling stage parameters (Fig. 2). For seedling root length, the range spanned from 1.99 cm to 17 cm, with a mean value of 8.97 cm. Notably, genotypes such as William-82, Rawal-I, and those from AVRDC consistently displayed above-average root lengths across all salt concentrations. For instance, the Black genotype exhibited the highest root length at 125 mM (17 cm), followed by NIBGE-308 (16.67 cm) and NIBGE-215 (16.16 cm) at 125 mM and 75 mM, respectively. Conversely, minimum root length was recorded in NIBGE-183 (1.9 cm) at 100 mM, followed by SPS-9 (2.01 cm). In terms of shoot length, variability was evident across different salt concentrations, ranging from 2.01 cm to 17.25 cm, with a mean of 8.79 cm. Genotypes like GP-25 exhibited the highest shoot length at 100 mM, followed by NIBGE-347 (16.98 cm) and NIBGE-130 (16.38 cm) at 75 mM. Conversely, NIBGE-183 and −84 showed the lowest shoot lengths at 100 mM (2.01 cm) and 125 mM (2.3 cm), respectively.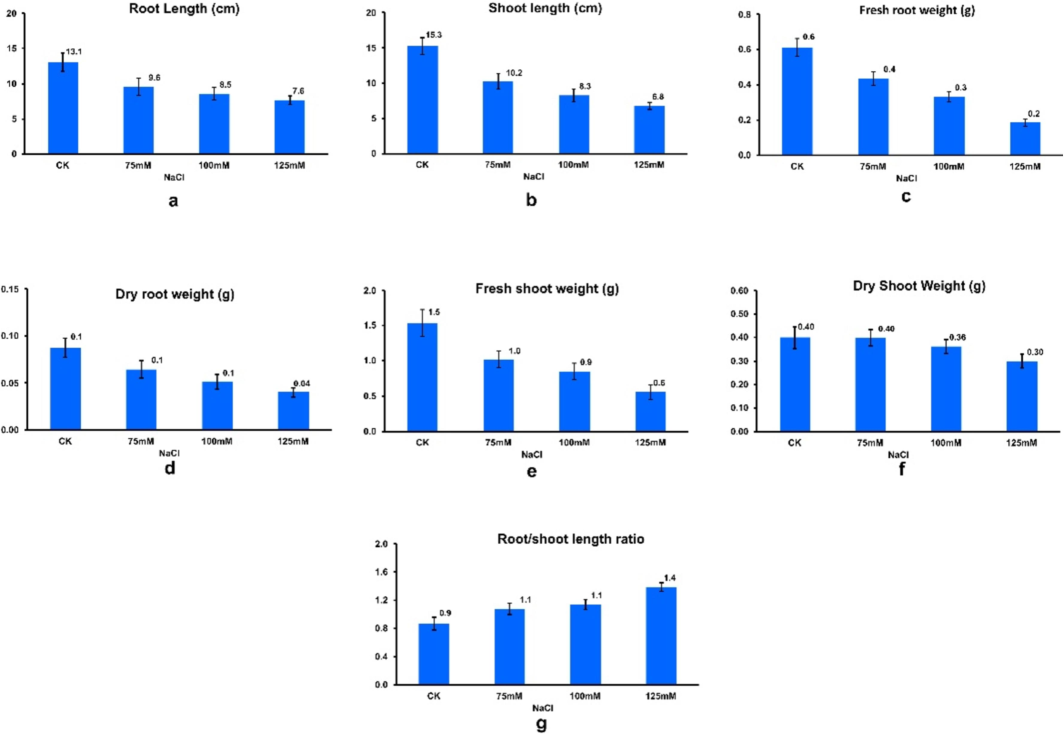
Effect of salt stress on a. soybean seedling root length (cm), b. shoot length (cm), c. fresh root weight (g), d. dry root weight (g), e. fresh shoot weight (g), f. dry shoot weight (g), g. root/shoot ratio.
Additionally, E-1531 produced the shortest shoot length at 125 mM (2.33 cm). Fresh root weight demonstrated slight variability across treatments, ranging from 0.01 g to 1.20 g, with an average of 0.34 g. Remarkably, NIBGE-183 exhibited the highest fresh root weight at 75 mM (1.20 g), followed by PGRA-04 and NIBGE-308 at 100 mM. Conversely, −84 and GP-18 displayed the lowest fresh root weights at 0.01 g and 0.04 g, respectively. Notably, genotype Faisal at 125 mM also showed a fresh root weight of 0.04 g. Similarly, fresh shoot weight showed relatively low variability across different salt treatments, ranging from 0.17 g to 1.81 g, with an average of 0.85 g. The Black genotype exhibited the maximum fresh shoot weight at 100 mM (1.81 g), followed by GP-21 and GP-25 at 125 mM. However, an increase in salt concentration negatively affected fresh root weight, as observed in SPS-56, PGRA-61, and PGRA-66 at 125 mM. Dry root weight ranged from 0.01 g to 0.13 g, with a mean of 0.05 g, showing low variability among treatments. Notably, maximum dry root weight was recorded at 75 mM, with genotypes like AVRDC-14 and AVRDC-9 exhibiting the highest values. Conversely, −84, Black, and E-1360 displayed the lowest dry root weights at 125 mM. Regarding dry shoot weight, moderate variation was observed across treatments, ranging from 0.21 g to 1.07 g, with a mean of 0.36 g. Notably, NIBGE-183 exhibited the maximum dry shoot weight at 100 mM, followed by NIBGE-130. Conversely, SPS-45 and SPS-36 displayed the lowest dry shoot weights at 125 mM, followed by PGRA-9 at 100 mM. Root shoot length ratio showed significant variation among treatments, ranging from 0.28 to 5.88, with a mean of 1.19. Interestingly, this trait appeared less sensitive to salt concentration compared to other parameters. Genotypes such as SPS-8 and PGRA-68 exhibited the highest root/shoot ratios at 100 mM and 125 mM, respectively, while PGRB-55 and NIBGE-335 displayed the lowest ratios at 125 mM and 75 mM, respectively. It was observed that at all salinity levels (75, 100 and 125 mM NaCl), Na+ concentration consistently increased in both the roots and shoots of the seedlings (Fig. 3). CAT, SOD, POD, and APX are key antioxidant enzymes involved in the scavenging of reactive oxygen species (ROS). To assess the activities of various enzymatic antioxidants, such as SOD and POD, seedlings were exposed to different salt concentrations. The results indicated that the highest antioxidant activity was observed at 125 mM NaCl, followed by 100 mM NaCl, and then 75 mM NaCl, respectively (Fig. 4). Exposure to salinity significantly increased lipid peroxidation and reactive ROS generation in both the roots and leaves of soybean, compared to the control (Farhangi-Abriz and Torabian, 2018). Consistently, our results for H2O2 and O2− showed the highest activity in seedlings treated with 125 mM NaCl, with a decreasing trend observed as the salt concentration decreased (i-e 100 mM and 75 mM NaCl concentration) (Fig. 4).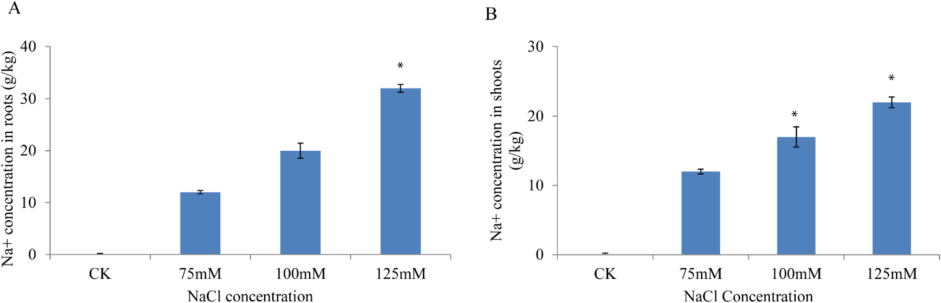
Na+ concentration at different concentration in roots (A) and shoots (B).
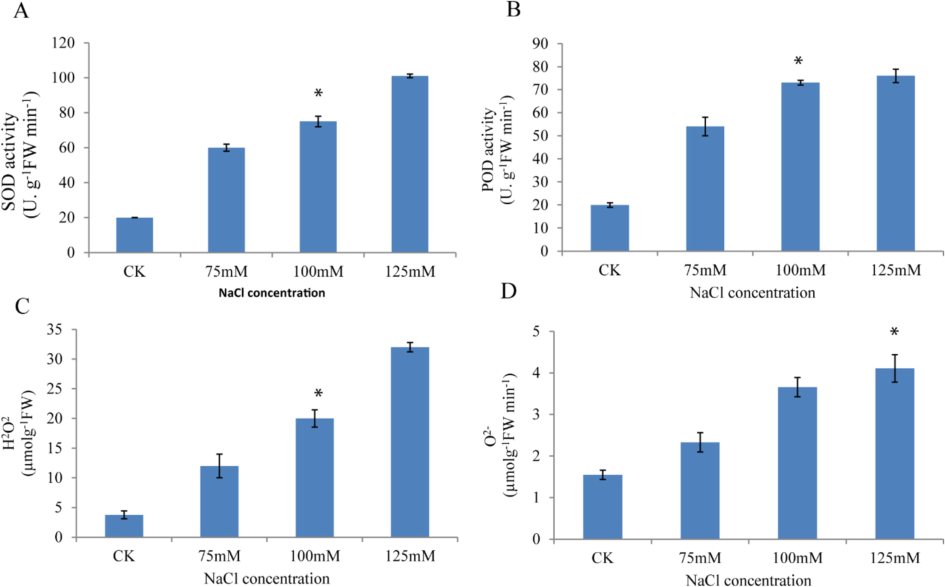
Effect of with or without salt stress on activities of (A) SOD, (B) POD, (C) H2O2 and (D) O2–.
Pearson’s correlation was calculated for morpho-physiological traits means data of seventy soybean genotypes under control and treatments. Most of the traits had highly significant positive correlation with each other (Fig. 3). Root length and fresh shoot weight had the highly significant positive correlation (0.69***) followed by correlation between root length and shoot length (0.60***). Shoot length depicted a highly significant positive association with fresh shoot weight (0.63***). Likewise, a significantly positive correlation was observed between shoot length and dry root weight (0.35**). Fresh root weight also exhibited significantly positive correlation with fresh shoot weight (0.49**), root length (0.43**), shoot length (0.40**) and dry root weight (0.24*). On the contrary, root shoot length ratio showed significantly negative correlation with shoot length (−0.13*) and dry root weight (0.09). The interdependence of these traits can be handily used as a selection criterion for salinity tolerant soybean genotypes for further crop improvement.
3.2 Phenotypic variation in germplasm under salinity stress
Principal Component Analysis (PCA) was conducted to determine the extent of phenotypic variation in all the genotypes. Overall, the biplot captured 56.5 % variability for phenotypic plasticity in all the seventy genotypes (Fig. 5). The distribution of genotypes around all the quadrants was asymmetric without noticeable grouping pattern. The SPS-33 performed better for FRWt and DRWt along with AVRDC-, NIBGE281, PGRA-37 and Faisal-Soy, while SPS-23 showed variation for SL and FRWt. The eigen vectors depicted that FSWT and DSWt had the pronounced effect in showing variation in SPS-22, NIBGE185, PGRB-68, GP18 along with Black and William-82. Similarly the SPS-8, E-1360 and Callend showed high variation for DSWt and RSLR. Cultivars from the northern region i.e. Ajmeri, Sawat-84 and Malakand-96 clustered together owing to their shared ecology and adaptation. Likewise, William-82 and Rawal-1 both maintained at NARC Islamabad had higher variation for FSWt, DSWt and RSLR. Moreover, Faisal-Soy the southern cultivar co-inhabited 16 genotypes in the second quadrant which was mainly characterized for its higher SL, RL.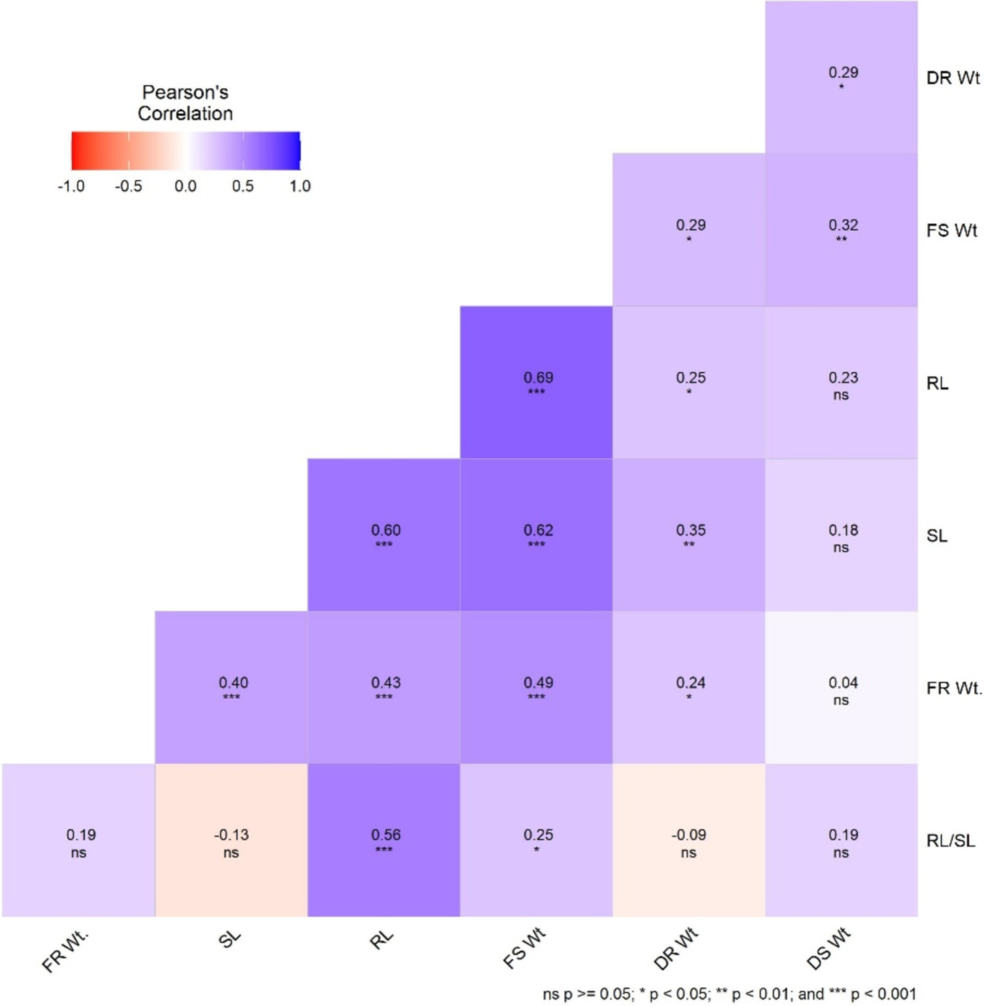
Correlation between morpho-physiological traits under salt stress.
3.3 Salinity tolerance indices
Higher value of fresh weight stress tolerance index (FWSI) indicates genotype’s ability to sustain stress under salinity stress. The average FWSI value of 54.20 ± 12.93 was recorded for all genotypes under treatments. Highest FWSI was recorded by Black (92.52) followed by NIBGE-224 (84.70) and NIBGE-183 (81.05). Malakand-96 had minimum FWSI (28.49) followed by SPS-10 (32.74) and SPS-08 (34.55) (Fig. 6).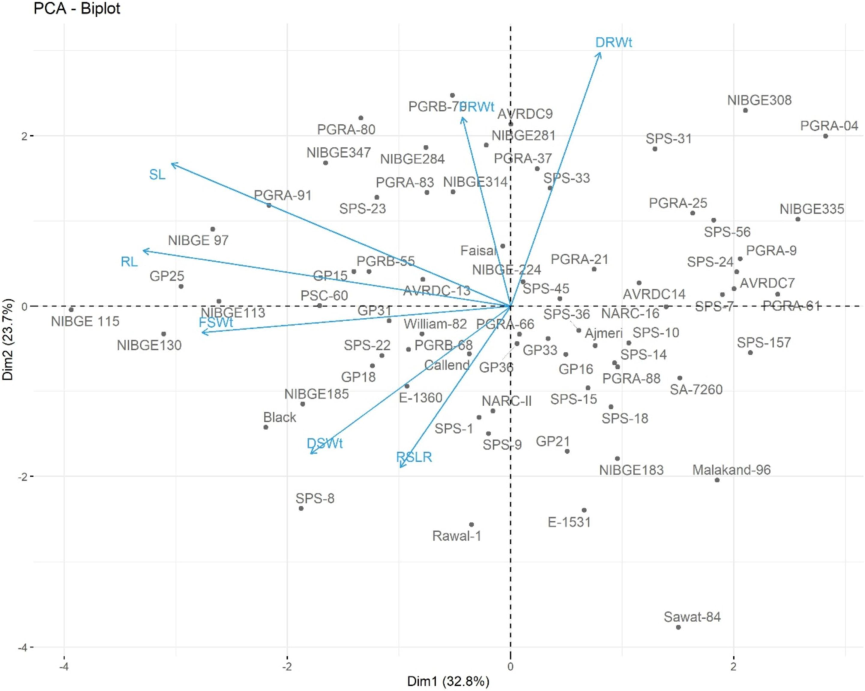
PCA biplot showing morphometric variation among 70 soybean genotypes under salinity stress.
Mean dry weight stress tolerance index (DWSI) ranged from 52.53 % to 98.53 % with a mean value of 77.93 ± 11.45. The NIBGE-185 (98.53) and −84 (98.43) showed highest DWSI followed by GP-18 (97.68). The lowest values were recorded in SPS-24 (52.42) and PGRA-9 (52.53). Root length salinity index (RLSI) varied between 15.96 % to 97.21 % with mean value of 65.86 ± 21.9. AVRDC-9 (97.66 %) has the highest RLSI followed by GP-33 (96.63 %) and Black (96.51 %). Moreover, SPS-9 (15.96 %) and Malakand-96 (19.17 %) has the lowest RLSI value. The shot length salinity index ranged from 21.19 % to 99.22 % with average index of 56.16 ± 20.6. PGRA-91 and GP-31 reported the highest SLSI of 99.22 % and 98.73 %, respectively. On the contrary, E-1531 (21.19 %) and Malakand-96 (25.56 %) recorded minimum SLSI values.
Salinity tolerance index (STI) value closer to 1 shows higher adaptation of a genotype to withstand salt stress. In the present experiment the mean values of STI for all genotypes among treatments ranged from 0.32 to 0.83 with an average value of 0.53 ± 0.1. Genotypes PGRA-91 (0.83) showed highest STI followed by SPS-9 (0.75) and NIBGE-115 (0.72). However, NIBGE-335 (0.32), SPS-24 (0.34) and Malakand-96 (0.36) had the lowest salinity tolerance index. Salinity susceptibility index (SSI) is also an important index to discriminate between salt tolerant and susceptible genotypes. Genotypes with STI value < 1 are considered as salt tolerant and vice versa. Mean STI values of 70 studied genotypes for all treatments ranged from 0.26 to 1.56 with mean value of 0.99 ± 0.24. Genotypes i.e. SPS-10 and SPS-18 and Malakand-96 had the highest values as 1.55, 1.41 and 1.40, respectively. The lowest STI was recorded for NIBGE-183 (0.26), AVRDC-7 (0.54) and Faisal-Soy (0.55).
Tolerance index (TI) was also determined to identify salinity tolerant soybean genotypes. Genotypes with lower TI values are desirable having the ability to perform good under saline conditions. In the present experiment, TI values varied between 0.12 and 2.02 with average TI value of 1.1 ± 0.37. Highest TI value 2.02 was observed in SPS-10 followed by 1.75 in Malakand-96 while Black recorded minimum TI value of 0.12 followed by 0.27 in NIBGE-224 and 0.34 in NIBGE-183. Percent reduction (PR) is another important salinity stress index as genotypes with PR value less the 60 % are considered as stress tolerant. The PR values ranged from 15.3 % to 71.51 % with a mean value of 45.8 ± 12.93. Genotypes i.e. Malakand-96 (71.51 %), SPS-10 (67.26 %) and SPS-8 (65.45 %) had the highest percent reduction. Moreover, Black (7.48 %), NIBGE-224 (15.3 %) and NIBGE-183 (18.95 %) had the lowest TI values showing their ability to be less affected by salt stress.
3.4 Classification of soybean germplasm based on salinity indices
The Euclidean distances based dendrogram on the salinity indices data distributed all the genotypes in to 6 groups (Fig. 7). The cluster I comprised of six genotypes having lowest average value of FWSI (48.42) but maximum mean RLSI (83.63) and SLSI (87.72). The cluster II was manifested by 18 genotypes showing highest average for DWSI (87.12) and above average RLSI (80.8) and STI (0.57). Moreover, these genotypes fared lower for FWSI (55.84), SSI (0.97) and TI (0.95). Fourteen genotypes settled in group III were characterized for lowest DWSI (70.82) and STI (0.45). The fourth cluster integrated 15 genotypes having low stress tolerance. These genotypes showed lowest FWSI (40.24), RLSI (43.24) and SLSI (35.38). On the contrary, their values for PR (59.76), SSI (1.27) and TI (1.48) were highest which signified their poor vegetative performance under salt stress. Cluster V assembled 10 highly salt tolerant genotypes with higher FWSI (75.21), DWSI (80.1) and STI (0.58). Likewise, their minimum score for indices e.g. PR (24.79), SSI (0.63) and TI (0.48) confirmed their ability to perform good under salinity stress. Group VI also comprised of seven relatively better genotypes having considerable level of salinity tolerance as these performed well for FWSI (71.85), RLSI (74.79), SLSI (60.98) and STI (0.54). Similarly, these genotypes posted lower values for PR (28.15), SSI (0.68) and TI (0.53) whereas lower values for these indices are indication of ability of the genotype to sustain morpho-physiological degradation under salt conditions. Overall, soybean genotypes responded differently under various salt treatments for their morphometric traits and subsequent salinity indices.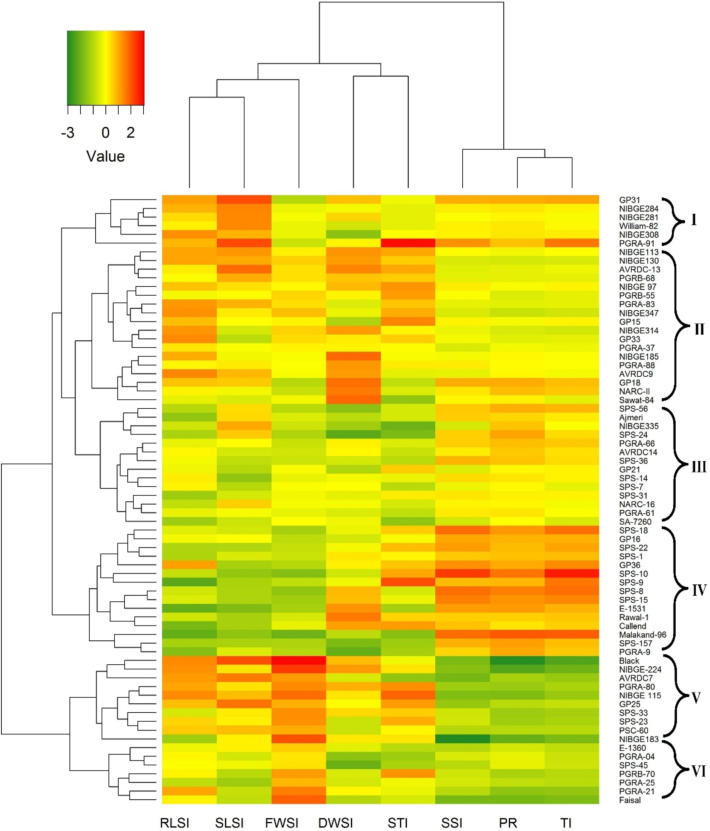
Distribution of 70 soybean genotypes in various groups on the basis of salinity tolerance indices scores.
4 Discussion
In middle vegetative stages the salt stress may affect growth vigor, plant height, leaf size, number of branches plant−1, number of seeds pod−1 and grain weight. These traits are major contributors of overall soybean seed yield which can be drastically limited due to salt stress (Newsome, 2016). Salinity stress not only reduces germination or yield, but it can also severely reduce the agronomic quality of grain produced under stress condition. Negative effect of salt stress on accumulation of protein and oil content has been found by Chang and Wan (1994). Furthermore, studies have proved that salt stress has significantly negative role in reducing active nodule biomass as well as their efficiency to fix nitrogen. Also, salt stress is found to be inhabiting initiation of symbiosis between soybean roots and rhizobia by deforming root hairs which acts as main conduit for Nod factors (Duzan et al., 2004). The lower nodulation in soybean may result in nitrogen deficiency which prompts growers to look for synthetic fertilizers for supplementing the nutrient (Amante et al., 2024).
These issues forces plant breeders to develop soybean varieties with sufficient tolerance level against salinity while targeting salt affected soils in various breeding programs (Ashraf & Munns, 2022).
The genetic background of salt tolerance in soybean has been studied by researchers in detail (Rasheed et al., 2022). Moreover, the primary step to harness the natural tolerance against salt concentration in crop is to evaluate the existing gene pool for the same. Fine mapping processes identified the putative causal gene in this locus as Glyma03g32900 (named GmCHX1 or GmSALT3), which encodes a sodium/hydrogen (Na+/H + ) exchanger family protein. Although the NaCl locus is a strong source of salt tolerance in many soybean cultivars, other loci contributing to this trait have been discovered through genome-wide association studies (Cho et al., 2021). To date many genes and pathways, that correlate to salt tolerance has been identified (Van Zelm et al., 2020; Chen et al., 2021).
Recent advances in phenotyping functionally and genetically linked cellular signaling responses, ion transport, water management, and gene expression to growth, development, and survival. Halophytes, which are naturally salt-tolerant plants, were highlighted as success stories to learn from. It was emphasized that (a) filling the major knowledge gaps in salt-induced signaling pathways, (b) increasing the spatial and temporal resolution of our knowledge of salt stress responses, (c) discovering and considering crop-specific responses, and (d) including halophytes in comparative studies were all essential to take approaches to increasing crop yields in saline soils to the next level (Van Zelm et al., 2020). This is incumbent upon plant breeders and physiologists to screen soybean germplasm against salinity and identify elite genotypes with sufficient tolerance level.
Guihua and Jingzhi (1986) evaluated 1716 soybean varieties of which 1556 were collected from 21 provinces, for their response against salt stress during germination, seedling, flowering and pod filling stages. The authors reported six genotypes as tolerant against salinity at all stages during cropping season whereas 415 genotypes exhibited tolerance at various stages. They proposed development of varieties using selected genotypes which survived in salinized soil. More, similar salt screening investigations in soybeans have been reported by different researchers (Zhang et al., 2011; Putri et al., 2017).
In the present study 70 soybean genotypes were evaluated at seedling stage against various salt concentrations (75, 100 and 125 mM) and their vegetative response was recorded. A deleterious effects of successive salt concentration was observed in the studied soybean genotypes for seedling morphological parameters i.e. root length, shoot length, fresh root weight, dry root weight, fresh shoot weight, dry shoot weight and shoot/root ratio. Root length showed decrease of 26.7 %, 35.1 % and 41.9 % than control at 75, 100 and 150 mM NaCl concentration, respectively. Shoot length showed reduction of 33.3 %, 45.5 % and 55.5 % against control at NaCl levels 75,100 and 125 mM, respectively. These traits represent vigor of the seedlings and reduction of root and shoot length at early stage is detrimental to soybean growth. These results were confirmed by findings of Oprica and Marius (2014) as they observed reduction of performance in soybean morphological parameters at three salt concentration levels (50, 100, 150 mM). Besides, other seedling traits such as fresh root weight fresh shoot weight, dry root weight and dry shoot weight were also reduced up to 60 % showing susceptibility of most of the germplasm against NaCl stress at seedling stage. Agarwal et al. (2015) evaluated 15 soybean genotypes at seedling stage against various salt levels (30, 60, 72, 100, 120 and 140 mM). They reported 50–90 % reduction in root length in some cultivars while 40–60 % decrease was observed in shoot growth of 5 of the 15 genotypes. Their results are comparable to findings of the present study as similar pattern of salt negative effect was recorded. Oprica and Marius (2014) also presented 15–60 % decrease in soybean root length and dry weight while screening soybean seedlings at 50, 100 and 150 mM NaCl concentration. Farhoudi and Tafti (2011) studied soybean seedling growth and ions homeostasis in response to salt stress. They found significant reduction in seedling germination, seedling fresh weight and dry weight. These results were in conformity with the findings of present study. Similarly, results of Zhang et al. (2011) were in complete harmony with the findings of present study. Similarly, results of Zhang et al. (2011) were in complete harmony with the findings of present study. Furthermore, our findings on the increasing Na+ concentration, antioxidant enzyme activities, and ROS production at varying salt concentrations are consistent with the study by Farhangi-Abriz and Torabian (2018), Ghorbani et al. (2024), Mansoor et al. (2022), and Ahmad et al. (2019). Their research demonstrated that high salt concentrations lead to elevated Na+ levels, causing nutritional imbalances, which in turn increase ROS production and ultimately result in reduced plant growth and biomass.
In addition to statistical analysis of morphological parameters data, these parameters were utilized to calculate values for salinity indices as earlier reported by Nawaz et al. (2019). These salinity indices are important parameters calculated based on variation between stressed and normal condition plants for various morphological traits i.e. root/ shoot length, weight and biomass etc. These help in classifying susceptible and tolerant genotypes for efficient selection under various salt concentrations. In the present study the data of eight indices were used for multivariate based hierarchical cluster analysis dispersing 70 genotypes in 6 different groups. Similar approach was used by Nawaz et al. (2019) as they used 8 indices to classify 13 mungbean varieties into 3 different clusters.
Chunthaburee et al. (2016) utilized hierarchical clustering to analyze salinity indices for rice seedlings exposed to a 100 mM salt concentration. The clear grouping based on salt stress response indicated sufficient genetic variation for NaCl tolerance in the studied soybean germplasm. Similarly, Mannan et al. (2010) supported these findings by confirming the grouping pattern and varying levels of salinity tolerance among soybean genotypes.
Khan et al. (2012) screened 41 soybean genotypes at 0, 100, and 150 mM salt concentrations, selecting seven genotypes as salt tolerant. These findings align with the conclusions of the present study. In this study, a dendrogram identified a fourth group consisting of 15 soybean genotypes, including the cultivars Rawal-I, Callend, and Malakand-96, which were designated as salt tolerant due to their superior performance on salinity indices. These genotypes demonstrated better mean performance at all salt levels. The successful selection of these varieties under different ecological conditions, including saline ones, likely contributed to their salt tolerance. The study revealed the explicit genetic structure of the soybean population under consideration, particularly regarding its germination in saline conditions.
The PCA revealed significant morphometric variation for important seedlings traits such root length, shoot length, root shoot length ratio and fresh and dry root weight. The divergence in cultivars mostly grown in the northern region like Islamabad, and Khyber Pakhtunkhwa i.e. Ajmeri, Rawal-I, Sawat-84 and Malakand-96 vs those in the south such as Faisal-Soy was more pronounced. The former group is mainly developed for temperate and shorter photoperiod zones with somewhat acidic soils whereas the latter is developed for high heat and salt stress regions in Punjab. These genotypes merit inclusion in breeding populations while contemplating strategies for developing salt tolerant soybean varieties. Several challenges have been identified in studies on salt stress in soybeans (Hasanuzzaman et al., 2022). These include the complex genetic basis of salt tolerance (Chen et al., 2018), which involves multiple genes and complicates the identification of specific genetic factors (Patil et al., 2017). The considerable phenotypic variation among different soybean genotypes (Zhou et al., 2021) adds further complexity to establishing consistent criteria for evaluating and comparing salt tolerance (Rasheed et al., 2022). Moreover, variations in environmental factors (Yang et al., 2021) like soil composition (Hasanuzzaman et al., 2022), temperature (Szczerba et al., 2021), and humidity (Bakhshandeh et al., 2020) can significantly influence the outcomes of salt stress experiments (Staniak et al., 2023), posing challenges in controlling these variables during field studies.
5 Conclusions and recommendations
This study investigated the response of seventy soybean genotypes to salinity stress during early seedling stages, exposing them to sodium chloride concentrations ranging from 0 to 125 mM. Eight salinity tolerance indices assessed genotype responses, revealing clusters of genotypes with higher salt tolerance based on specific indices. Notable genotypes with superior stress tolerance, such as Black, NIBGE-224, and NIBGE-183, exhibited high Fresh Weight Stress Tolerance Indices (FWSI), while others like Malakand-96 demonstrated lower tolerance. These findings provide valuable insights for breeding programs aimed at developing salt-tolerant soybean varieties essential for sustainable agriculture on saline soils. These genotypes merit inclusion in sustainable breeding populations while contemplating strategies for developing salt tolerant soybean varieties for sustainable commercial production. These findings also offer potential solutions for areas where direct planting is hindered by salinity issues. Furthermore, it is recommended to utilize the identified salt-tolerant genotypes in breeding programs to develop new varieties adapted to saline soils, with emphasis on root architecture and ion regulation, is essential. Additionally, exploring halophytes for beneficial traits and fostering collaboration among researchers and stakeholders will accelerate progress toward developing sustainable solutions for salt stress in soybean cultivation.
CRediT authorship contribution statement
Muhammad Arif: Writing – review & editing, Conceptualization. Haris Khurshid: Supervision, Methodology, Investigation, Formal analysis, Data curation, Conceptualization. Malik Ashiq Rabbani: Writing – original draft, Conceptualization. Muhammad Jahanzaib: Writing – review & editing, Conceptualization. Sahir Hameed Khattak: Writing – review & editing. Ihsan Ullah: Writing – review & editing. Mohammad Abul Farah: Writing – original draft, Funding acquisition, Formal analysis, Data curation. Rattandeep Singh: Writing – original draft, Funding acquisition, Formal analysis, Data curation. Luhua Li: Writing – review & editing, Writing – original draft, Methodology, Data curation, Conceptualization.
Acknowledgement
The authors would like to extend their sincere appreciation to the Researchers Supporting Project number (RSPD2024R694), King Saud University, Riyadh, Saudi Arabia.
Authors Contributions
Muhammad Arif, Luhua Li and Haris Khurshid, contributed to the study conception, supervision and design. Muhammad Arif and Haris Khurshid performed experiments, data collection and analysis. The initial draft of the manuscript was written by Muhammad Arif and Haris Khurshid, commented, reviewed and edited by Malik Ashiq Rabbani, Muhammad Jahanzaib, Sahir Hameed Khattak, Luhua Li and Ihsan Ullah in the initial version. Mohammad Abul Farah, Luhua Li and Rattandeep Singh analyzed the data and also wrote discussion part of this manuscript. All authors listed have significantly contributed to the development and the writing of this article.
Declaration of competing interest
The authors declare that they have no known competing financial interests or personal relationships that could have appeared to influence the work reported in this paper.
References
- Evaluation of soybean (Glycine max L.) cultivars under salinity stress during early vegetative growth. Int. J. Curr. Microbiol. App. Sci.. 2015;4:123-134.
- [Google Scholar]
- Revisiting the role of ROS and RNS in plants under changing environment. Environ. Exp. Bot.. 2019;161:1-3.
- [Google Scholar]
- Soybean (Glycine max (L.) Merr.) response to application of mineral nitrogen and bradyrhizobia on Nitisols of Teppi, Southwest Ethiopia. Heliyon. 2024;10(9)
- [Google Scholar]
- Soybean production in Pakistan: experiences, challenges and prospects. Int. J. Agric. Biol.. 2020;24(4):995-1005.
- [Google Scholar]
- Evolution of approaches to increase the salt tolerance of crops. Crit. Rev. Plant Sci.. 2022;41(2):128-160.
- [Google Scholar]
- Plant growth promoting microorganisms can improve germination, seedling growth and potassium uptake of soybean under drought and salt stress. Plant Growth Regul.. 2020;90:123-136.
- [Google Scholar]
- Advances in genetics and breeding of salt tolerance in soybean. In: Salinity Responses and Tolerance in Plants, Volume 2: Exploring RNAi, Genome Editing and Systems Biology. 2018. p. :217-237.
- [Google Scholar]
- Novel QTL identification and candidate gene analysis for enhancing salt tolerance in soybean (Glycine max (L.) Merr.) Plant Sci.. 2021;313:111085
- [Google Scholar]
- Physiological and biochemical parameters for evaluation and clustering of rice cultivars differing in salt tolerance at seedling stage. Saudi J. Biol. Sci.. 2016;23:467-477.
- [Google Scholar]
- Leaf senescence: correlated with increased levels of membrane permeability and lipid peroxidation, and decreased levels of superoxide dismutase and catalase. J. Exp. Bot.. 1981;32(1):93-101.
- [Google Scholar]
- Perception of Bradyrhizobium japonicum Nod factor by soybean [Glycine max (L.) Merr.] root hairs under abiotic stress conditions. J. Exp. Bot.. 2004;55:2641-2646.
- [Google Scholar]
- Nano-silicon alters antioxidant activities of soybean seedlings under salt toxicity. Protoplasma. 2018;255:953-962.
- [Google Scholar]
- Effect of salt stress on seedlings growth and ions homeostasis of soybean (Glysin max) cultivars. Adv. Environ. Biol.. 2011;5:2522-2526.
- [Google Scholar]
- Does biochar mitigate the adverse effects of drought on the agronomic traits and yield components of soybean? Ind. Crop. Prod.. 2019;128:445-454.
- [Google Scholar]
- Nano-enabled agrochemicals: mitigating heavy metal toxicity and enhancing crop adaptability for sustainable crop production. J. Nanobiotechnol.. 2024;22(1):91.
- [Google Scholar]
- Guihua, S., Jingzhi, S., 1986. Preliminary studies on the evaluation of salt tolerance in soybean varieties. In: Scientia Agricultura Sinica, China.
- Salt stress responses and tolerance in soybean. In: Plant Stress Physiology-Perspectives in Agriculture. London: IntechOpen; 2022. p. :47-82.
- [Google Scholar]
- Agro-morphological and physiological responses of Brassica rapa ecotypes to salt stress. Pak. J. Bot.. 2016;48:1379.
- [Google Scholar]
- Khan, M., Karim, M., Haque, M., Karim, A., Mian, M., 2012. Screening of soybean genotypes for salt tolerance in hydroponics.
- Miracle crop: the present and future of soybean production in Pakistan. MOJ Biol. Med.. 2017;2:189-191.
- [Google Scholar]
- Genetic structure of Pakistani Oilseed Brassica cultivars revealed by morphometric and microsatellite markers. Pak. J. Bot. 2019;51:1331-1340.
- [Google Scholar]
- Assessment of subcellular ROS and NO metabolism in higher plants: multifunctional signaling molecules. Antioxidants. 2019;8(12):641.
- [Google Scholar]
- Assessment of genetic divergence in salt tolerance of soybean (Glycine max L.) genotypes. J. Crop Sci. Biotechnol.. 2010;13:33-37.
- [Google Scholar]
- Reactive oxygen species in plants: from source to sink. Antioxidants. 2022;11(2):225.
- [Google Scholar]
- Heavy metal induced oxidative stress mitigation and ROS scavenging in plants. Plants. 2023;12(16):3003.
- [Google Scholar]
- Screening Mungbean Germplasm for salt tolerance using growth indices and physiological parameters. Int. J. Agric. Biol.. 2019;22:401-406.
- [Google Scholar]
- Newsome, J.A., 2016. Dissecting Salt Tolerance in Soybean by Profiling Differential Physiological Responses under Salt Stress.
- Evaluation of morphological and biochemical parameters of soybean seedlings induced by saline stress. Romanian Biotechnol. Lett.. 2014;19:9615.
- [Google Scholar]
- Molecular mapping and genomics of soybean seed protein: a review and perspective for the future. Theor. Appl. Genet.. 2017;130:1975-1991.
- [Google Scholar]
- Response of soybean genotypes to salinity in germination stage. Nusantara Biosci.. 2017;9:133-137.
- [Google Scholar]
- Molecular tools and their applications in developing salt-tolerant soybean (Glycine max L.) cultivars. Bioengineering. 2022;9(10):495.
- [Google Scholar]
- Responses of soybean to selected abiotic stresses—Photoperiod, temperature and water. Agriculture. 2023;13(1):146.
- [Google Scholar]
- Effect of low temperature on germination, growth, and seed yield of four soybean (Glycine max L.) cultivars. Agronomy. 2021;11(4):800.
- [Google Scholar]
- Environmental and genetic regulation of plant height in soybean. BMC Plant Biol.. 2021;21:1-15.
- [Google Scholar]
- Hydrogen peroxide-induced chilling tolerance in mung beans mediated through ABA-independent glutathione accumulation. Funct. Plant Biol.. 2003;30(9):955-963.
- [Google Scholar]
- Differential Cl−/salt tolerance and NaCl-induced alternations of tissue and cellular ion fluxes in glycine max, glycine soja and their hybrid seedlings. J. Agron. Crop Sci.. 2011;197:329-339.
- [Google Scholar]
- Development of an automated plant phenotyping system for evaluation of salt tolerance in soybean. Comput. Electron. Agric.. 2021;182:106001
- [Google Scholar]


