

Translate this page into:
Monitoring and evaluation of free acidity levels in Talh honey originated from Talh tree Acacia gerrardii Benth
⁎Corresponding author. alqarni@ksu.edu.sa (Abdulaziz S. Alqarni)
-
Received: ,
Accepted: ,
This article was originally published by Elsevier and was migrated to Scientific Scholar after the change of Publisher.
Peer review under responsibility of King Saud University.
Abstract
Talh, Acacia gerrardii Benth. (Talh relevant to the Arabic local name) trees are main nectar source for honey production in the Arabian Peninsula. However, honey originated from nectar of this plant is characterized by relatively high levels of free acidity (FA), which has caused quality concerns with regard to marketing and exportation of Talh honey. This pioneer study investigated the free acidity of Talh honey starting where the honey originates and continuing throughout its processing and preparation. Furthermore, the pH and electrical conductivity (EC) of tested Talh honey made by Apis mellifera L. were monitored. Samples were collected during the flowering season of Talh trees. The FA levels showed a gradual significant increase from Talh tree leaves and flowers (30 ± 0.99; 34 ± 0.92 meq/kg) to bee crop (honey stomach) and unripe honey (43 ± 1.80; 72 ± 1.56 meq/kg) and finally to ripe honey (77 ± 1.28 meq/kg), respectively. For the pH level, the highest value was recorded in the leaves (6.41 ± 0.03), and it decreased as honey production continued, reaching its lowest value in ripe honey (4.91 ± 0.06). Contrarily, the EC increased from 0.98 ± 0.06 mS/cm in the leaves to 1.56 ± 0.08 mS/cm in unripe honey. Seasonal variations in FA, pH, and EC were monitored, and these factors showed significant fluctuations over time during the experimental period. The mean values of FA, pH, and EC in the newly harvested Talh honey were 82 meq/kg, 5.1, and 1.54 mS/cm, respectively. The levels of FA in Talh honey were higher than the range permitted in the international standards for honey quality. FA was significantly positive correlated with relative humidity (RH) and EC, whereas a significant negative correlation was observed between FA and pH. These results confirmed that Talh honey is primitively highly acidic, with low pH and high EC. The high levels of FA in the Talh honey were related to the nature of the origin plant, and were not associated with honey quality. The modification of Talh honey standards based on regional honey characteristics are suggested. Further research on the physicochemical properties of all Acacia spp. honeys that appear to have high FA levels is recommended.
Keywords
Acacia gerrardii
Free acidity
pH
Electrical conductivity
Honey quality
Botanical origin

1 Introduction
Acacia gerrardii Benth., also locally known as “Talh”, is a native tree from the arid and semi-arid regions of Africa and West Asia (Dharani, 2007), including the Arabian Peninsula (Alqarni et al., 2011; Alqarni et al., 2015). Acacia trees are the most prevalent desert plants in Saudi Arabia, and are the main provenance of nectar and pollen for honey bee colonies (Alqarni et al., 2011). They are quite rich in proteins and minerals, and provide nectar-rich summer and subtropical bee forage in Saudi Arabia (Awad et al., 2017). Honey originating from Talh trees (A. gerrardii) is regionally called “Talh honey” in reference to its floral nectar origin. It is one of the most desirable types of honey in the Arabian Peninsula (Adgaba et al., 2017; Alqarni et al., 2017), and exhibits significant antimicrobial activity against pathogenic microorganisms (Owayss et al., 2020).
Natural honey is highly preferred in Saudi Arabia because of its unique cultural, medicinal, and nutritional values (Alqarni et al., 2016). Honey consumption in Saudi Arabia is gradually increasing (Owayss et al., 2020). According to the latest statistics, more than 20,000 tons of honey are available in the Saudi market annually. Of these, domestic production is approximately 2,500 tons, and 18,000 tons are imported from different countries to fulfil market demands (MEWA, 2018).
Honey originates from flowers or certain plant exudates and is processed by honey bees in their stomachs and hives through different physical and physiological treatments. It is a complex nutrient source composed basically of carbohydrates and water with a wide range of minerals, vitamins, enzymes, and organic acids; of these, gluconic acid is predominant in honey as a byproduct of the enzymatic activity of glucose oxidase. Organic acids also influence honey by determining its flavor and aroma (Machado De-Melo et al., 2018). The composition and characteristics of honey depend on variable factors, such as the geographical nectar source, climatic conditions, soil composition, beekeeping practices, honey processing and storage conditions (Pavlova et al., 2018). Certain physicochemical characteristics of honey, e.g., its color, taste, mineral content, pH, moisture, electrical conductivity (EC) and acidity level, are linked with its botanical origin, whereas its hydroxymethylfurfural content and purity are associated to the manufacturing process (Bogdanov et al., 2004).
Various studies have been performed on certain quality parameters of Saudi honeys (Al-Khalifa and Al-Arify, 1999; Mohammed et al., 2017). Talh honey is characterized by a distinct taste and high mineral, acid, and phenolic contents. More importantly, its free acidity levels were shown to exceed the standard permitted levels (Alqarni et al., 2014; Alqarni et al., 2016). This has led to problems in the marketing and exportation of Talh honey. Therefore, this introductory study investigated the free acidity of Talh honey at different stages, i.e., where it originates (leaves and flowers), is processed (bee crops), and is prepared (inside beehives). In recent decades, tools have been developed to assess honey quality and authenticity for consumer protection and fair producer competition (Soares et al., 2017). Quality standard limits and values are usually determined by national and international organizations based on honey composition databases. In Saudi Arabia, there is no comprehensive database characterizing Saudi Arabian honeys, and no published research has addressed this subject. If available, such data could be used to formulate an appropriate and nationally accepted honey quality standard for Talh honey, among others.
2 Materials and methods
2.1 Study area
Field investigations were carried out in the Huraymila Valley (25° 7′36 “N, 46° 7′21″ E), located approximately 100 km northwest of Riyadh city, Saudi Arabia. The valley has diverse plant species enriched by perennial desert plants including Acacia gerrardii Benth. A group of twenty-five bee colonies (Apis mellifera L.) were kept under A. gerrardii (Talh) trees during the summer bloom season (May-August 2019). Temperature (°C) and relative humidity (RH %) were also recorded throughout the season for subsequent correlation analyses. The analytical experiments with honey were conducted at the Melittology Research Laboratory in the Department of Plant Protection, College of Food and Agriculture Sciences, King Saud University, Riyadh, Saudi Arabia.
2.2 Analysis of FA, pH, and EC
Free acidity (FA) and two other physicochemical parameters: pH and electrical conductivity (EC) were measured in the plant leaves and flowers, the honey crops of nectar-collecting worker bees, unripe honey, and ripe honey using a Hanna® PH/PPM Meter HI-9813–6 N according to the protocol described by (AOAC, 1990). All three parameter tests were performed in triplicate.
2.3 Sample collection, preparation, and analysis
Five trees of A. gerrardii and five colonies of bees were randomly selected and labeled in the experimental area. Testing samples were collected every two weeks in the morning (9–10 am) throughout the flowering season from the selected trees and bee colonies. Samples of A. gerrardii were collected during the blooming season (May-August 2019). A 30 g stock samples of each of the fresh leaves and flowers were taken from each of the five trees of A. gerrardii. Each sample were sub-sampled to three replicates (10 g each) taken randomly from different sides of each tree. The total sample size (150 g) of leaves or flowers from all five trees was analyzed every two weeks during the flowering season of A. gerrardii. These samples were stored in an icebox were transported to the laboratory for subsequent analyses.
2.4 Determination of FA, pH, and EC
The levels of FA, pH, and electrical conductivity (EC) were determined in the in-hive honey (unripe and ripe), worker bee honey crops, the nectar flowers and plant leaves of A. gerrardii. In addition, these three parameters were also measured in the harvested honey. Ten grams of each sample replicate was washed with deionized water, ground, and dissolved in 75 ml deionized water to measure the pH and EC (mS/cm) using multi-parameter meter (Hanna® HI-9813–6 N). The levels of FA were measured using the titrimetric method. Titration was performed with 0.05 N NaOH until the pH reached 8.5, and the burette reading was recorded. A reagent blank was also analyzed simultaneously, and the results of the measurement (acidity) were expressed as milliequivalents per kg (meq/kg) of honey (AOAC, 1990).
2.5 Sample preparation and analysis of honey bee crops
Forager worker bees were dissected to quantify the FA, pH, and EC of their crops. Foraging worker bees (100–150) returning to the colonies were collected in small cages at the entrance of each of the five bee colonies every two weeks during the flowering season of A. gerrardii (May-August 2019). The collected forager bees were placed in an icebox and subsequently dissected according to standard methods (Dade, 1994). Approximately 130 crops of forager bees were detached, transferred into an Eppendorf tube and crushed. The crop body tissues were removed from the solution, and 1.25 g of the remaining solution was mixed with 9.4 ml deionized water. Then, the pH, EC and free acidity of the prepared bee crop solution were measured according to the standard protocol (AOAC, 1990).
2.6 Sample preparation and analysis of unripe and ripe honey
The honey inside the bee hives was tested every two weeks by collecting 15 g/colony (in three replicates of 5 g each) from each bee colony. Unripe honey was collected from open comb cells, and ripe honey was collected from sealed ones. Samples were kept in an icebox and transferred to the lab for FA, pH, and EC tests (AOAC, 1990).
2.7 Botanical origin of Talh honey
To determine the botanical origin of the tested honeys, its pollen content was analyzed on three samples of the honey harvested from each colony (3x5) (Basically following (Louveaux et al., 1978).
2.8 Statistical analysis
The data were subjected to statistical analyses in SAS® 9.2 software using ANOVA, and Duncan’s multiple-range test to evaluate any significant differences (p < 0.05) among means. Correlation analysis were performed among meteorological data (temperature and relative humidity) and different physicochemical properties (pH, EC, and FA).
3 Results
The physicochemical properties (FA, pH and EC) were determined in the plant leaves, flowers, crops of worker bee (honey stomachs), and the unripe and ripe honey originating from A. gerrardii.
3.1 Free acidity (FA)
The results revealed significant differences among the FA levels in all tested sources (leaves, flowers, bee crops, and unripe and ripe honey) throughout the flowering season of A. gerrardii (Fig. 1). The highest mean FA was recorded in ripe honey (77 ± 1.28 meq/kg), followed by unripe honey (72 ± 1.56 meq/kg). FA increased gradually from the lowest value in the leaves (30 ± 0.99 meq/kg) to the highest one (77 ± 1.28 meq/kg) in the ripe honey. FA decreased in the order ripe honey (77 ± 1.28 meq/kg) > unripe honey (72 ± 1.56 meq/kg) > honey bee crops (43 ± 1.80 meq/kg) > flowers (34 ± 0.92 meq/kg) > leaves (30 ± 0.99 meq/kg). Levels of FA continued to increase after honey extraction. The mean level of FA from harvested Talh honey after extraction was 82 ± 0.01 meq/kg (Table S1).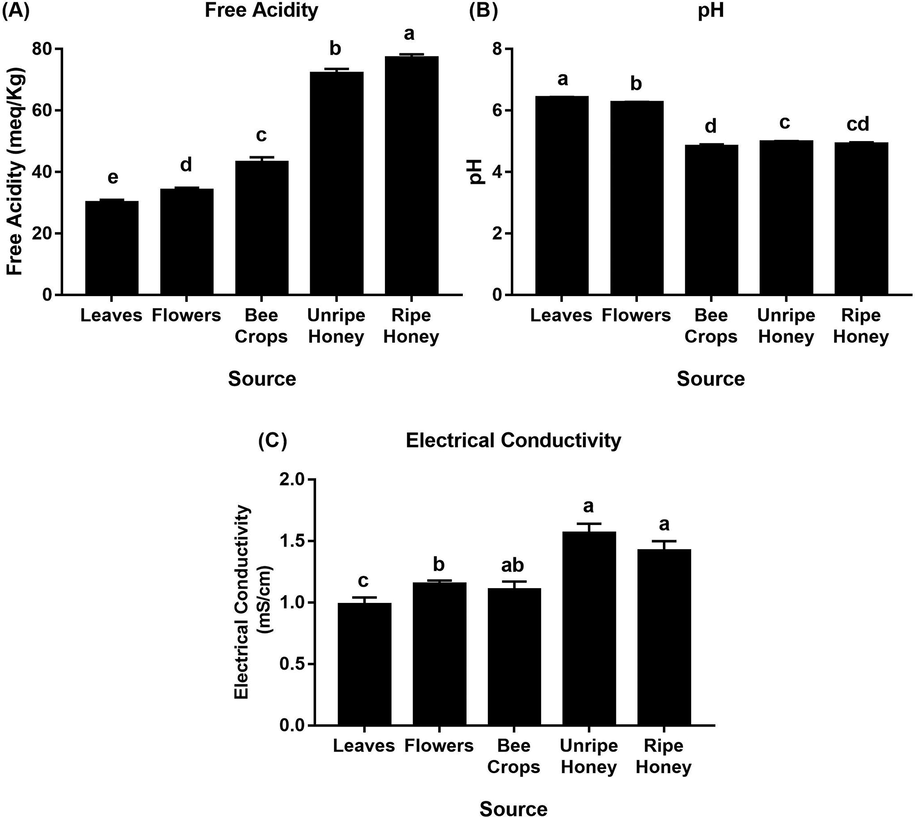
Level of physicochemical properties (mean ± SE): (A) free acidity, (B) pH and (C) electrical conductivity detected in leaves, flowers, bee crops, unripe honey and ripe honey originating from Talh trees (Acacia gerrardii). Means with the common letter in each figure are not significantly different from each other (p < 0.05, Duncan’s test).
3.2 FA at each interval
Throughout the flowering season, the FA at two-week intervals exhibited a gradual constant increase in each tested source, with significant differences among intervals (Fig. 2). The lowest values of FA were recorded in the 1st interval of the flowering season from the leaves (22 ± 1.14 meq/kg), flowers (26.6 ± 0.29 meq/kg), bee crops (34.6 ± 2.60 meq/kg), unripe honey (54.0 ± 1.22 meq/kg) and ripe honey (68.6 ± 0.55 meq/kg), whereas the highest FA values were recorded from leaves (35 ± 0.63 meq/kg) at the 3rd interval, flowers (38.2 ± 1.32 meq/kg) at the 6th interval, bee crops (54.6 ± 1.30 meq/kg) at the 6th interval, unripe honey (77.6 ± 0.24 meq/kg) at the 4th interval, and ripe honey (84.4 ± 0.55 meq/kg) at the 6th interval (Fig. 2 and Table S2).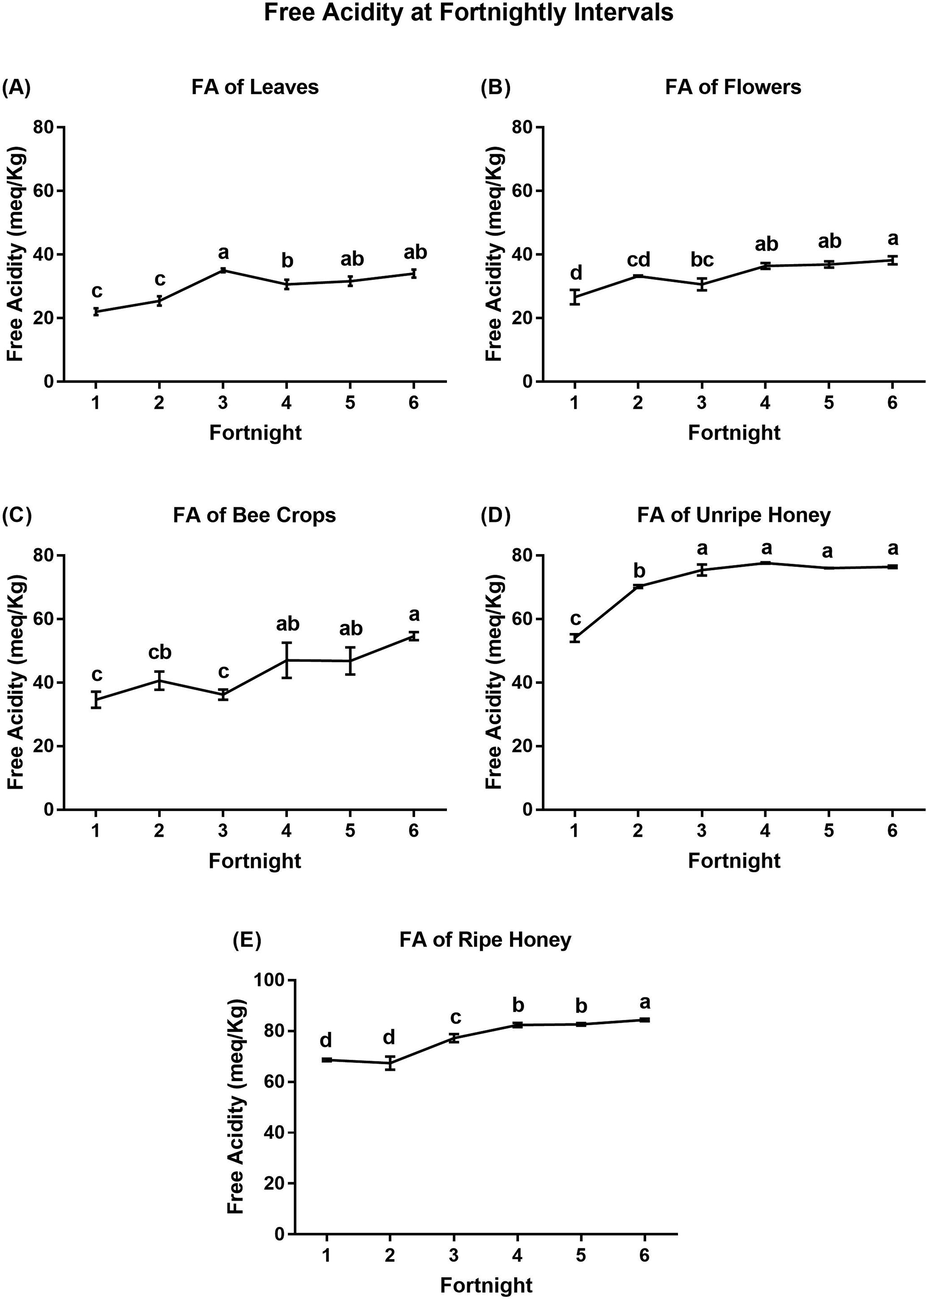
Determination of free acidity (mean ± SE) from A) leaves, B) flowers, D) unripe honey, C) ripe honey, and E) bee crops at fortnightly intervals. Means with the same letter in each figure are not significantly different from each other (p < 0.05, Duncan’s test).
3.3 pH
The pH values generally showed the opposite trend of the FA values in the tested sources. There were significant differences among the pH records of the tested sources (Fig. 1). The highest pH value was measured in the leaves, and the lowest one was measured in the bee crops. The leaves and flowers of A. gerrardii were less acidic than the bee crops and in-hive honey (unripe and ripe honey). The highest pH value was measured in the leaves (6.41 ± 0.03), followed by that in the flowers (6.25 ± 0.03). The pH values of the bee crops (4.82 ± 0.08), unripe honey (4.97 ± 0.04), and ripe honey (4.91 ± 0.06) indicated the acidity. The mean pH value of the harvested Talh honey after extraction was 5.1 ± 0.10 (Table S1).
3.4 pH at each interval
Fig. 3 shows the pH data at fortnightly (two-week) intervals for leaves, flowers, bee crops, unripe honey, and ripe honey during the flowering season of A. gerrardii. A diversified pattern of fluctuating pH was recorded at fortnightly time intervals throughout the flowering season. There were significant differences among pH values at fortnightly intervals. Relatively low pH values were recorded from leaves (6.3 ± 0.04) at the 3rd, 5th and 6th fortnights; flowers (6.1 ± 0.04) at the 4th and 6th fortnights; bee crops (4.4 ± 0.13) at the 6th fortnight; unripe honey (4.8 ± 0.13) at the 3rd fortnight; and ripe honey (4.3 ± 0.04) at the 1st fortnight. The highest pH values (low acidity) were recorded from leaves (6.7 ± 0.04) at the 1st fortnight, flowers (6.4 ± 0.04) at the 2nd and 3rd fortnights, bee crops (5.5 ± 0.09) at the 3rd fortnight, unripe honey (5.2 ± 0.09) at the 5th fortnight and ripe honey (5.2 ± 0.09) at the 2nd fortnight (Fig. 3 and Table S3). Generally, the pH values of unripe and ripe honey samples were acidic, within the range of 4.3 ± 0.04 to 5.2 ± 0.09, which fall within the recommended limits (pH 3.4 to 6.1) for fresh honey.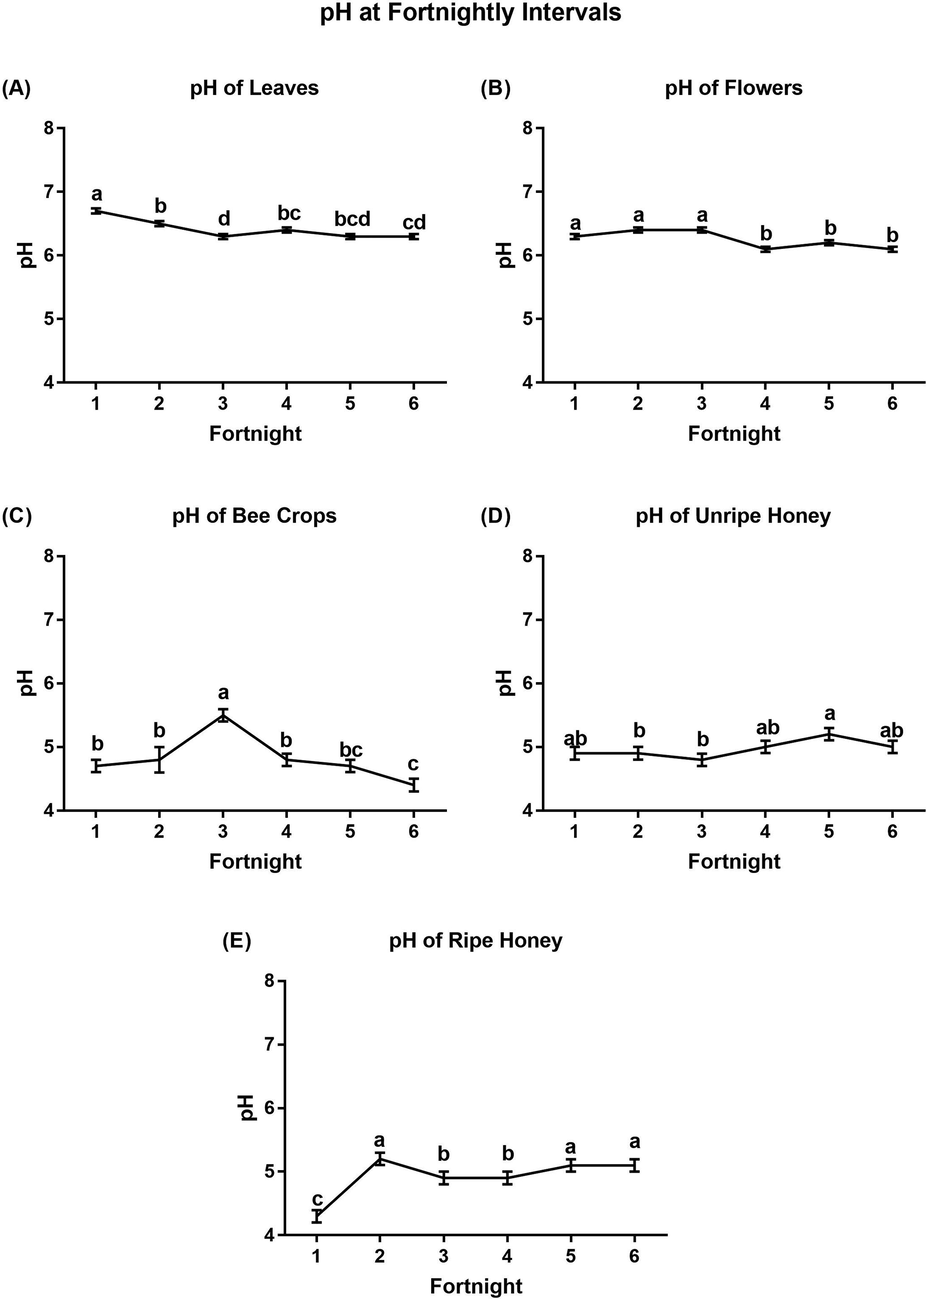
Determination of pH (mean ± SE) from A) leaves, B) flowers, D) unripe honey, C) ripe honey, and E) bee crops at fortnightly intervals. Means with the same letter in each figure are not significantly different from each other (p < 0.05, Duncan’s test).
3.5 Ec
The data revealed significant differences among the ECs of different sources (leaves, flowers, bee crops, unripe honey, and ripe honey) (Fig. 1). Relatively high EC values were determined in the unripe and ripe honey compared to those in the other tested sources. The EC levels varied within a range of 0.98 mS/cm to 1.56 mS/cm from all tested samples. The EC values in the leaves and flowers of A. gerrardii were 0.98 ± 0.06 mS/cm and 1.15 ± 0.03 mS/cm, respectively. The lowest EC was recorded in the plant leaves (0.98 ± 0.06 mS/cm), and the highest one was recorded in the unripe honey (1.56 ± 0.08 mS/cm), followed by that in the ripe honey (1.42 ± 0.08 mS/cm). A value of 1.10 ± 0.07 mS/cm was recorded in the honey bee crops. The mean EC value in the harvested Talh honey after extraction was 1.54 ± 0.10 mS/cm (Table S1).
3.6 EC at each interval
Fig. 4 shows the variable patterns of EC data at each fortnightly (two-week) interval for each tested source across the flowering season. Significant differences were observed among intervals for each tested source. Lower values of EC were recorded in the leaves (0.75 ± 0.05 mS/cm) at the 1st fortnight, flowers (0.97 ± 0.08 mS/cm) at the 5th fortnight, while bee crops (0.75 ± 0.25 mS/cm), unripe honey (1.10 ± 0.04 mS/cm) and ripe honey (0.69 ± 0.0.03 mS/cm) were recorded at the 1st fortnight. The highest EC was recorded from leaves (1.59 ± 0.04 mS/cm) at the 3rd fortnight, flowers (1.27 ± 0.02) at the 1st fortnight, however, bee crops (1.30 ± 0.17 mS/cm), unripe honey (2.01 ± 0.23 mS/cm) and ripe honey (1.75 ± 0.03 mS/cm) were recorded at the 2nd fortnights (Table S4).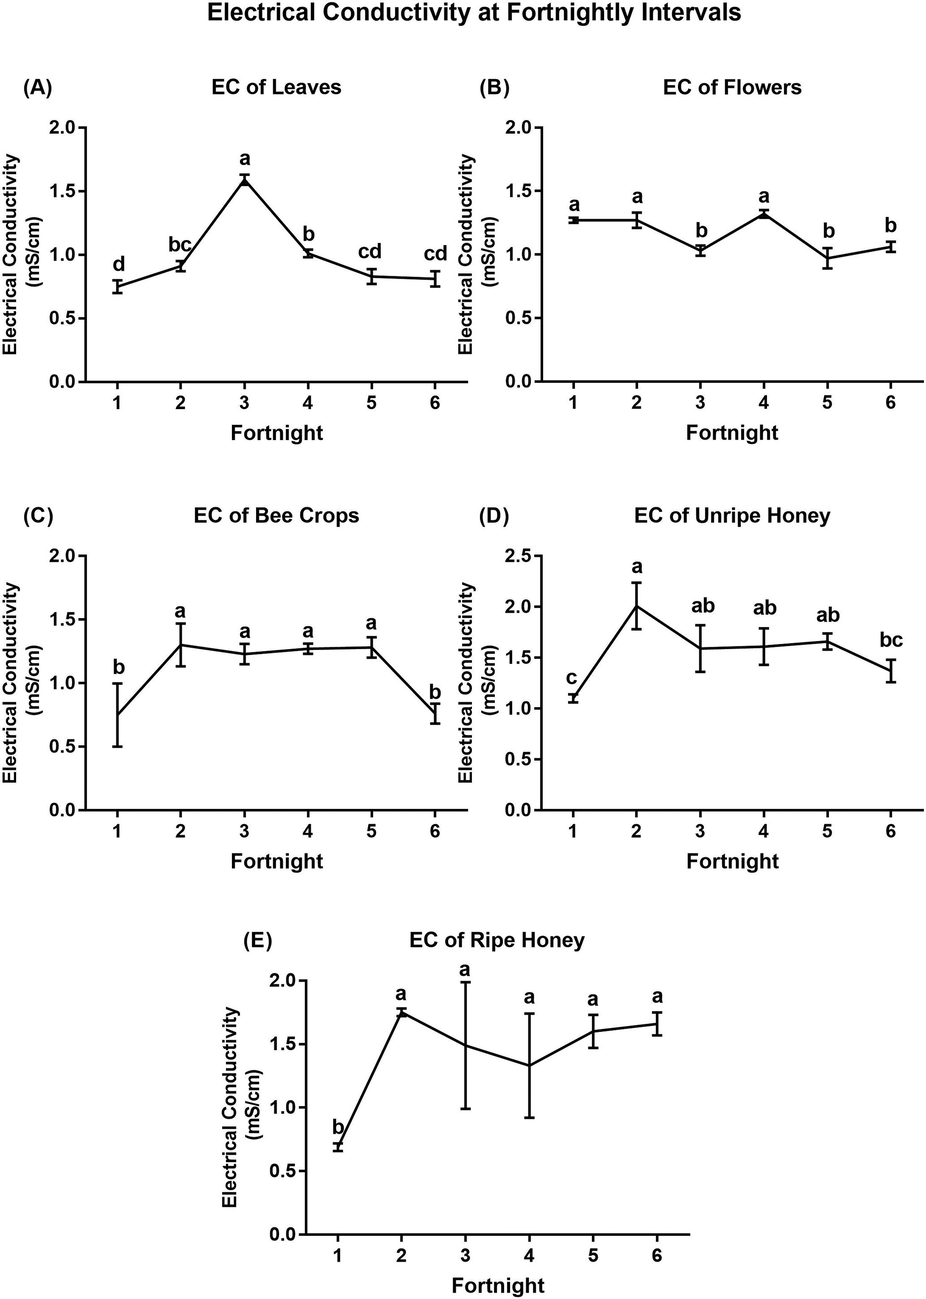
Determination of EC (mean ± SE) from A) leaves, B) flowers, D) unripe honey, C) ripe honey, and E) bee crops at fortnightly intervals. Means with the same letter in each figure are not significantly different from each other (p < 0.05, Duncan’s test).
3.7 Seasonal mean values of all three parameters
The values of FA, pH, and EC for each tested source were combined. Fig. 5 shows graphical illustration at each fortnightly interval, regardless of the source, during the season. The data analysis revealed significant differences in FA, pH, and EC over time. FA increased at each interval, with significantly lower values recorded during the early fortnights (1, 2 and 3; values of 41 ± 3.65 meq/kg, 47 ± 3.77 meq/kg and 51 ± 4.30 meq/kg, respectively) than during the last fortnights (4, 5 and 6; values of 55 ± 4.48 meq/kg, 55 ± 4.31 meq/kg, and 58 ± 4.12 meq/kg, respectively) (Table S2). For the pH values, the trend was steady, with values ranging between 5.39 ± 0.15 at the 6th interval and 5.77 ± 0.13 at the 3rd interval with insignificant differences (Table S3). For EC, the data showed a significant increase from the lowest value at the 1st interval (0.91 ± 0.07 mS/cm) to highest value 1.45 ± 0.10 mS/cm at the 2nd interval and then decreased significantly towards the end of the season (Table S4).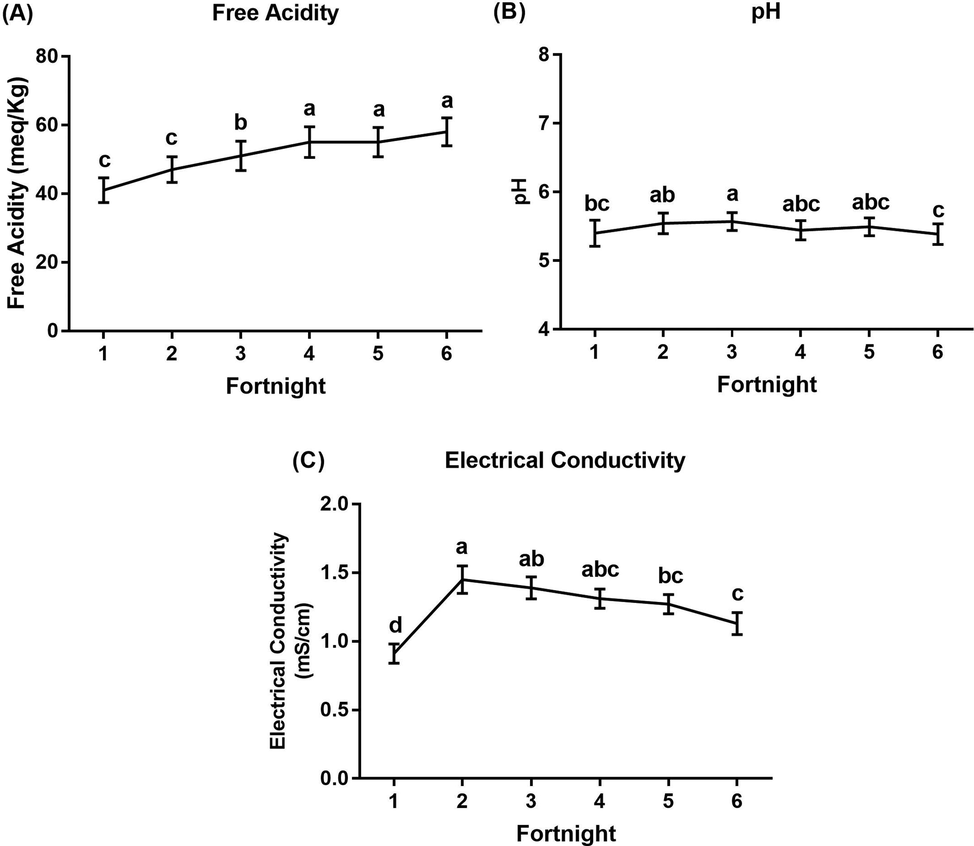
Seasonal data (mean ± SE) of physicochemical properties from all sources (leaves, flowers, bee crops, and unripe and ripe honey) A) free acidity, B) pH and C) electrical conductivity during the flowering season of Acacia gerrardii. Mean values with the same letter are not significantly different (p < 0.05, Duncan’s test).
3.8 Meteorological data and correlation analyses between variables
During the flowering season of A. gerrardii, the mean temperature was 37 °C (highest 40 °C; lowest 34 °C). The mean RH was 11%, with a maximum value of 14% and a minimum value of 8.8% (Fig. 6 and Table S5). The Pearson correlation analyses (p < 0.05) were done among the meteorological data (temperature and RH) and the physicochemical properties (FA, pH and EC) (Table 1). FA had a significant positive correlation with RH (r = 0.18069), whereas EC exhibited a significant negative correlation (r = -0.29246) with temperature (Table 1(. A significant negative correlation (r = -0.70402) was recorded between FA and pH, and a significant positive correlation (r = 0.50974) between FA and EC (Table 1).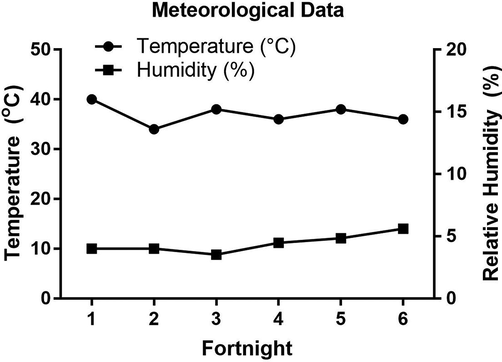
Mean ± SE of temperature and relative humidity every two weeks (fortnightly) during the flowering season of Acacia gerrardii. (mean seasonal temperature = 37 °C; mean seasonal Humidity = 11).
Parameter
Correlation Coefficient values (r)
EC
pH
FA
Temp.
RH
EC
1
−0.17321
0.50974*
−0.29246*
−0.11576
pH
1
−0.70402*
−0.02298
−0.05912
FA
1
−0.10517
0.18069*
Temperature (°C)
1
−0.22177
Relative Humidity (RH) %
1
4 Discussion
Our results confirmed that A. gerrardii honey is normally characterized by increased levels of FA than those of standards. The values of FA among all tested sources were significantly different along the pathway from leaves and flowers to bee crops and unripe and ripe honey. The FA values of Talh honey in the present study exceeded the maximum level (50 meq/kg) permitted by the (Codex Alimentarius Commission, 2019) and the EU (Council, 2002) as well as the maximum limit (40 meq/kg) adopted by the GC (Council, 2014). The levels of FA in Acacia honey recorded in this study are in line with those reported in the previous studies. (Alqarni et al., 2016) measured a wide range of FA values (12.0–134.5 meq/kg) in a variety of local and imported honey samples and found high acidity values (112–134.5 meq/kg) in Acacia honey that were over the permitted levels, and were even higher than the FA values recorded in the present study. In addition, honey imported from Tualang (Malaysia), the Black Forest (Germany), and Cotton (Egypt) also revealed high values of FA. (Al-Farsi et al., 2018) found high FA levels with an average of 84.9 meq/kg (range: 38.5 to 126 meq/kg) in 18 out of 21 Acacia honey samples obtained from various areas of Oman. (Al-Doghairi et al., 2007) found that FA ranged between 9.12 and 93.02 meq/kg in different Saudi honeys. The FA of Acacia honey was also found to be affected by altitude such as 19.8 meq/kg at 1000 m altitude to 65 meq/kg at 2200 m altitude in the Asir Mountains of Saudi Arabia (Mohammed et al., 2017). The levels of FA in honey are correlated mainly to its content of organic acids, specifically gluconic acid (Crane, 1990). Gluconic acid in honey is produced after the bee enzyme glucose oxidase acts on the glucose in nectar (White et al., 1978). FA is associated with the flower type, mineral content, harvest season, and presence of inorganic ions (Karabagias et al., 2014). The FA levels in our study increased from the leaves and flowers to the bee crops and the unripe and ripe honey and finally to the harvested honey. This increase may be due to the presence of high levels of gluconic acid in Acacia flowers, which would confirm the value of Acacia trees as a rich source of nectar (Awad et al., 2017). (White and Crane, 1975) stated that the gluconic acid levels in honey increased with the time required for the total conversion of nectar into honey.
Another possible source of the high levels of FA in Talh honey is the extrafloral nectaries (EFNs) found on each compound leaf of the Talh tree. (Phadke et al., 1970) confirmed that honey derived from EFNs may show increased FA levels. Several studies have reported that EFNs are frequently visited by honey bee workers (Alqarni et al., 2015; Alqarni et al., 2017). The presence of numerous components, such as amino acids and carbohydrates in nectar reflects the specific taste of nectar from floral and EFN nectaries and corresponds to their attractiveness to forager insects (Nicolson et al., 2007).
High FA levels that are above the permitted standards could therefore be considered a feature rather than an indicator of low quality and are related to the geographical and floral origin of the honey (Ananias et al., 2014). The adoption of national guidelines for monofloral honey quality evaluation has been thoroughly deliberated. (Thrasyvoulou et al., 2018) reported that several countries; such as Greece and Serbia, have national legislations regarding the properties of eight types of monofloral honey. Germany has laws regarding ten monofloral honeys, and Turkey manages national regulations for almost all monofloral honeys produced in the country. The botanical origin of honey is normally determined through pollen analysis (Bogdanov et al., 2004). According to (Louveaux et al., 1978); the botanical of honey was determined through its pollen content analysis. We found that 88% of the pollen examined in Talh honey was related to A. gerrardii (Talh), indicating that Talh honey tested in this study was monofloral i.e. originating primarily from A. gerrardii. Several countries have established legal pollen limits for some kinds of monofloral honey. For example, Croatia has defined 12 kinds of monofloral honey, Germany has defined nine, Serbia has defined eight, Greece has defined six, and Italy has defined two (Thrasyvoulou et al., 2018). The establishment of legal standards for the characteristics of Talh honey is crucial to overcome its ineligibility for trade due to its high FA levels. Previous reports have argued that a single parameter should not be used to disqualify honey (Welke et al., 2008).Therefore, it is very important to review the honey quality standards for local Saudi honeys, especially Talh honey. FA levels in natural Talh honey should be modulated when compared to standard quality evaluation criteria, as the existing standards could disqualify the natural Talh honey which has naturally high FA.
For pH values, the trend was similar to that for FA. The pH values in unripe and ripe honey and bee crops were more acidic (lower) than those in leaves and flowers. Thus, Talh honey originating from A. gerrardii is acidic in nature. These results are consistent with those in several previous studies (Al-Doghairi et al., 2007; Alqarni et al., 2016; Mohammed et al., 2017). The pH range recorded in the present study was within the permitted limits (3.42–6.10) of the (Codex Alimentarius Commission, 2019). An acidic pH is desirable in honey both for flavor and to resist microbial growth during the long shelf life of honey (Al-Doghairi et al., 2007; Krishnasree and Ukkuru, 2017).
The EC values (0.98–1.56 mS/cm) in all tested samples (leaves, flowers, bee crops, unripe honey, and ripe honey) exceeded permitted standards (0.8 mS/cm) (Codex Alimentarius (Commission, 2001); EU (Council, 2002); GC (Council, 2014). Previous study reported similar findings (Mohammed et al., 2017). High levels of FA correspond to high EC values, and vice versa (Krishnasree and Ukkuru, 2017); this implies the high mineral content of Talh honey, which is considered a distinctive nutritional feature (Mohammed et al., 2017). Therefore, considering high EC values in the quality evaluation criteria for Talh honey is recommended for the same reasons provided to consider high FA values in the criteria.
The seasonal variations in FA, pH, and EC were monitored at fortnightly intervals during the experimental period. A gradual, significant increase in FA and fluctuating patterns of pH and EC over time were recorded from the tested samples of leaves, flowers, bee crops and in-hive honey (unripe and ripe honey). The unique patterns of physicochemical parameters in different honeys provide a useful method for distinguishing among honeys of various geographical origins (Acquarone et al., 2007). Many biotic and abiotic factors can significantly influence the quality and quantity of nectar secretions (Adgaba et al., 2017). The temperature and humidity can affect the volume and nectar concentration (Nicolson et al., 2007). The rate of nectar secretion varies hourly and monthly, mainly due to fluctuations in weather (temperature, rainfall, relative humidity, etc.) during the plant flowering season (Alqarni, 2015); these factors may indirectly affect honey characteristics and quality. The basic properties of honey change over time due to variable aspects of the nectar, flora and season (Nicolson et al., 2007; Adgaba et al., 2017; Alqarni et al., 2017). Therefore, fluctuations in physicochemical properties such as those observed in our experiments are inevitable. Our results revealed significant positive correlations between FA and RH and between FA and EC. (Krishnasree and Ukkuru, 2017) indicated that high levels of FA were associated with high EC, and vice versa. (Živkov-Baloš et al., 2018) also found a strong positive correlation between FA and EC. Direct correlations between FA and pH (Cavia et al., 2007) and strong positive correlations between FA, EC and pH (Ratiu et al., 2020) were also reported. The different geographical and floral origins, environmental factors, and beekeeping practices over the globe may result in different trends in honey. However, for A. gerrardii (Talh) honey, it is obvious that the high levels of FA associated with high EC values are related to the nature of its botanical origin rather than to a lack of quality.
5 Conclusion
Our investigation demonstrated that free acidity during the Talh tree blooming season gradually increased from leaves and flowers to bee crops and unripe honey and reached its highest value in ripe honey. Likewise, we recorded a strong, significant connection among the free acidity, pH level, and electrical conductivity. The high FA and EC levels in Talh honey can be viewed as a feature that is related to its botanical origin rather than to a lack of quality. Further studies are warranted to fully understand the mechanism underlying the natural high free acidity in Talh trees and honey, especially in the hot and arid regions e.g. the Arabian Peninsula.
Acknowledgement
The authors are thankful to Deanship of Scientific Research at King Saud University for funding this research through the initiative of DSR Graduate Students Research Support (GSR).
Declaration of Competing Interest
The authors declare that they have no known competing financial interests or personal relationships that could have appeared to influence the work reported in this paper.
References
- Pattern of pH and electrical conductivity upon honey dilution as a complementary tool for discriminating geographical origin of honeys. Food. Chem.. 2007;101(2):695-703.
- [CrossRef] [Google Scholar]
- Nectar secretion dynamics and honey production potentials of some major honey plants in Saudi Arabia. Saudi J. Biol. Sci.. 2017;24(1):180-191.
- [CrossRef] [Google Scholar]
- Physicochemical and antimicrobial properties of natural honeys produced in Al-Qassim region, Saudi Arabiaالخواص الكيمو فيزيائية وتضاد الميكروبات للأعسال الطبيعية المنتجة في منطة القصيم بالمملكة العربية السعودية. J. King Abdul. Univ. Meteorol. Environ. Arid Land Agri. Sci.. 2007;18(2):3-18.
- [CrossRef] [Google Scholar]
- Physicochemical characteristics and pollen spectrum of some Saudi honeys. Food. Chem.. 1999;67(1):21-25.
- [CrossRef] [Google Scholar]
- Honeybee foraging, nectar secretion, and honey potential of wild jujube trees Ziziphus nummularia. Neotrop. Entomol.. 2015;44(3):232-241.
- [CrossRef] [Google Scholar]
- Pollination ecology of Acacia gerrardii Benth. (Fabaceae: Mimosoideae) under extremely hot-dry conditions. Saudi J. Biol. Sci.. 2017;24(7):1741-1750.
- [CrossRef] [Google Scholar]
- The indigenous honey bees of Saudi Arabia (Hymenoptera, Apidae, Apis mellifera jemenitica Ruttner): Their natural history and role in beekeeping. Zookeys.. 2011;134(134):83-98.
- [CrossRef] [Google Scholar]
- Evaluation of Acacia gerrardii benth. (Fabaceae: Mimosoideae) as a honey plant under extremely hot-dry conditions: Flowering phenology, nectar yield and honey potentiality. J. Anim Plant Sci.. 2015;25(6):1667-1674.
- [Google Scholar]
- Physicochemical characteristics, total phenols and pigments of national and international honeys in Saudi Arabia. Arab J. Chem.. 2016;9(1):114-120.
- [CrossRef] [Google Scholar]
- Mineral content and physical properties of local and imported honeys in Saudi Arabia. J. Saudi Chem. Soc.. 2014;18(5):618-625.
- [CrossRef] [Google Scholar]
- Analysis of moisture content, acidity and contamination by yeast and molds in Apis mellifera L. honey from central Brazil. Braz. J. Microbiol.. 2014;44(3):679-683.
- [CrossRef] [Google Scholar]
- AOAC Official methods of analysis, Index of method number 920 (15 ed.). Arlington: Association of Official Analytical Chemists; 1990.
- Performance of two honey bee subspecies during harsh weather and Acacia gerrardii nectar-rich flow. Sci. Agric.. 2017;74(6):474-480.
- [CrossRef] [Google Scholar]
- Physico-chemical methods for the characterisation of unifloral honeys: A review. Apidologie.. 2004;35(Suppl. 1):S4-S17.
- [CrossRef] [Google Scholar]
- Evolution of acidity of honeys from continental climates: Influence of induced granulation. Food. Chem.. 2007;100(4):1728-1733.
- [CrossRef] [Google Scholar]
- Codex Alimentarius Commission, 2001. Revised Codex Standard for Honey Codex Stan 12-1981, Rev. 1 (1987), Rev. 2 (2001),” Codex Standard, Vol. 12. 1981, pp. 1-7.
- Standard for honey. CXS 12–1981, Rev. 1 (1987), Rev. 2 (2001) Amended in. 2019;2019:1-9.
- [Google Scholar]
- The traditional hive products: honey and beeswax. Oxford, UK: Heinemann Newnes; 1990. p. :400-401.
- Anatomy and dissection of the honeybee. UK: International Bee Research Association; 1994.
- Field guide to acacias of East Africa (1st ed.). Cape Town, South Africa: Struik Random House Publishers; 2007.
- European Union Council, Council Directive 2001/110/EC of 20 December 2001 relating to honey. Official Journal of the European Communities L. 2002;10:47-52.
- [Google Scholar]
- GC Council, 2014. Gulf Cooperation Council, Standardization Organization (GSO), 2014. GSO 5/FDS Final Draft for Honey. pp. 1–12.
- Characterisation and classification of Greek pine honeys according to their geographical origin based on volatiles, physicochemical parameters and chemometrics. Food. Chem.. 2014;146:548-557.
- [CrossRef] [Google Scholar]
- Krishnasree, V., Ukkuru, P.M., 2017. Quality Analysis of Bee Honeys. Int. J. Curr. Microbiol. Appl. Sci. 6(2), 626-636. 10.20546/ijcmas.2017.602.071
- Composition and properties of Apis mellifera honey: A review. J. Apic. Res.. 2018;57(1):5-37.
- [CrossRef] [Google Scholar]
- MEWA, 2018. Ministry of Environment Water and Agriculture,Statistical Yearbook of 2018, Issue No. 54, Open data Library, Information and Statistics. Saudi Arabia, Riyadh., in: Agriculture, M.o.E.W.a. (Ed.).
- Mohammed, M.E.A., Alfifi, A., Aamadawi, A., Alfaifi, M.Y., Elbehairi, S.E., Al-bushnaq, H.A., 2017. Some physiochemical properties of Acacia honey from different altitudes of the Asir Region in Southern Saudi Arabia. Czech J. Food Sci. 35321-327. 10.17221/428/2016-CJFS
- Nicolson, S.W., Nepi, M., Pacini, E., 2007. Nectaries and Nectar. Springer, Netherlands.
- In vitro antimicrobial activities of Saudi honeys originating from Ziziphus spina-christi L. and Acacia gerrardii Benth. trees. Food Sci. Nutr.. 2020;8(1):390-401.
- [CrossRef] [Google Scholar]
- Correlation Study of Honey Regarding their Physicochemical Properties and Sugars and Cyclitols Content. Molecules.. 2020;25(1):34.
- [Google Scholar]
- A Comprehensive Review on the Main Honey Authentication Issues: Production and Origin. Compr. Rev. Food Sci. Food Saf.. 2017;16(5):1072-1100.
- [CrossRef] [Google Scholar]
- Legislation of honey criteria and standards. J. Apic. Res.. 2018;57(1):88-96.
- [CrossRef] [Google Scholar]
- Caracterização físico-química de méis de Apis mellifera L. da região noroeste do Estado do Rio Grande do Sul. Cienc. Rural.. 2008;38(6):1737-1741.
- [Google Scholar]
- Honey. In: Chichester C.O., Mrak E.M., Stewart G.F., eds. Adv Food Res. New York: Academic Press; 1978. p. :287-374.
- [Google Scholar]
- Electrical Conductivity and Acidity of Honey. Arch. Vet. Med.. 2018;11(1):91-101.
- [CrossRef] [Google Scholar]
Appendix A
Supplementary data
Supplementary data to this article can be found online at https://doi.org/10.1016/j.jksus.2021.101678.
Appendix A
Supplementary data
The following are the Supplementary data to this article:


