

Translate this page into:
Molecular structure simulation of (E)-2-(butan-2-ylidene) hydrazinecarbothioamide using the DFT approach, and antioxidant potential assessment of its complexes
⁎Corresponding author. tahminakhan30@yahoo.com (Tahmeena Khan)
-
Received: ,
Accepted: ,
This article was originally published by Elsevier and was migrated to Scientific Scholar after the change of Publisher.
Peer review under responsibility of King Saud University.
Abstract
The molecular structure of (E)-2-(butan-2-ylidene)hydrazinecarbothiomide (2-butanone thiosemicarbazone) was validated by density functional theory (DFT) calculations. The characterization of the ligand was done using various spectroscopic techniques. Four transition metal complexes were prepared with the ligand and their antioxidant activity was tested. Molecular docking studies of the complexes were also performed against nicotinamide adenine dinucleotide phosphate (NADPH) and myeloperoxidase (MPO). Structure validation of the ligand was done in Gaussian 09 software. The geometry optimization was done at B3LYP/6-31G++(d,p) level. The 1H and 13C NMR chemical shifts, FT-IR vibrations and UV–visible transitions were validated with the help of theoretical calculations. The frontier molecular orbital analysis, molecular electrostatic potential (MEP) and global reactivity descriptors were calculated to predict the stability of the molecule. Non-linear optical (NLO) properties were assessed and compared with urea. Natural bond orbital (NBO) analysis was done to predict the stability of the ligand resulting from hyper conjugative interactions and electron delocalization. Molecular docking studies of the complexes were performed with iGEMDOCK 2.1 and AutoDock 4.2.6.Antioxidant potential was assessed by 2,2-diphenyl-1-picrylhydrazyl (DPPH) Assay. 1H and 13C correlation coefficients (R2) were 0.9964 and 0.9974 respectively. In case of FT-IR, the correlation coefficient (R2) was 0.9984. [Fe(C5H11N3S)2(SO4)] possessed maximum antioxidant potential followed by [Cu(C5H11N3S)2(SO4)]. Molecular docking findings suggested that the Fe complex released the minimum binding energy. Computational structure validation is an important aspect in finding a lead moiety. The theoretical spectral findings correlated well with the experimental findings in the present study. The metal complexes showed appreciable antioxidant potential as predicted by the computational and experimental findings. The ligand possessed better NLO properties than urea.
Keywords
Gaussian
Optimization
Quantum
Mechanics
Thiosemicarbazone
Antioxidant

1 Introduction
Through quantum mechanical simulations the structural characteristics of new materials can be easily and accurately predicted. The computational predictions can also validate the experimental findings. Owing to the fast and accurate predictions by automated softwares, computational chemistry has received considerable attention (Matulkova et al., 2008; Boo et al., 2008). Due to the remarkable growth in the field of computational resources, many theoretical algorithms have been proposed to calculate various properties of a compound using semi-empirical and DFT methods. The theoretical data can be easily compared with the experimental one (Brewerton, 2008; Ravna and Sager, 2008). DFT has become a major tool for structure prediction and understanding the mechanistic approach (Lipkowitz et al., 2009; Lorenc et al., 2008). Quantum studies enable to envisage the structure of a chemical entity with the help of computer aided softwares. With the added support of experimental results, new molecules of significant utility may be generated (Lorenc et al., 2008). Thiosemicarbazone are one such type of Schiff based ligands of known biological importance (Kola and Landis, 2004). Thiosemicarbazones have gained considerable interest owing to their binding ability with metal ions (Pelosi, 2010). They can bind to the metal ion via N and S atoms. The authors have reported the anticancer and antibacterial activity of (E)-2-(butan-2-ylidene)hydrazinecarbothioamide and its’ complexes with Cu, Fe, Zn and Co salts in their previous manuscript where a significant activity enhancement was observed upon the coordination of metal ions (Khan et al., 2017). In this paper the experimental results obtained after the FT-IR, 1H NMR, 13C NMR and UV analysis have been verified by the quantum mechanics studies in this paper. The antioxidant activity of its’ complexes has also been assessed using the DPPH assay. Molecular docking studies of the complexes were also performed against NADPH and MPO,
2 Materials and methods
For chemical synthesis, thiosemicarbazide, 2-butanone and ethanol were purchased from Fisher Scientific. 1H and 13C NMR spectra were recorded on a Bruker instrument on 500.1 MHz at 295 K using tetramethylsilane (TMS) as an internal standard. The sample was run in DMSO‑d6. Mass spectrum of the ligand was obtained on FAB-MS, JEOL SX-102 mass spectrometer. IR spectra were recorded on a Bruker vertex 70 IR spectrophotometer. UV spectrum was recorded on a SpectraMax-5 spectrophotometer (Molecular Devices) between 200 and 400 nm. Density functional methods were used to predict ligand’s 1H, 13C, FT-IR and UV spectra. The DFT calculations have been carried out using Gaussian 09 software package with the internally stored DFT/B3LYP/6–31++G(d,p) basis set. NMR parameters were calculated using a single-point calculation through Guage independent atomic orbital (GIAO) approach and DFT/B3LYP method with 6–31++G(d,p) basis set and IEFPCM model with DMSO which was used to understand the solvent induced effect. The basis of selection was due to past studies showing good agreement between experimental and calculated chemical shifts (Fraser et al., 2013; White et al., 2015; Pierens et al., 2015). NMR parameters (NMR = GIAO) were calculated with a single-point calculation in gaseous and solvent phases both by the same basis set, using the optimized structures from the B3LYP/6–31++G(d,p) calculation. The structure was optimized in Gaussian 09 with the help of B3LYP/6–31++G(d,p) in vacuum. The characterization of the normal modes was done on the basis of the PED analysis using VEDA4 program and Gauss View 6.0 was used to visualize and analyze the normal modes. Molecular docking was performed using iGEMDOCK 2.1 and AutoDock 4.2.6. The target proteins NADPH-oxidase (PDB I.D.5VOH) and myeloperoxidase (MPO) (PDB I.D. 5FMA) were downloaded from www. rcsb.org/pdb.
3 Chemistry
3.1 Synthesis of 2-butanone thiosemicarbazone
The ligand was synthesized taking reference from a earlier published study with some alterations (Supplementary Fig. 1) (Khan et al., 2017; Kumar and Kumar, 2013).
3.1.1 C5h11N3S
Yield: 90%, MW:145, Solubility: Ethanol, DMSO, DMF, MP(°C): 99 °C, FTIR (KBr) (cm−1): 1619 (C⚌N), 772, 1077 (C⚌S), 1H NMR (DMSO) (ppm) 1.1 (t, 3H), 1.9 (s, 3H), 2.3 (q, 2H), 4.9 (s, 1H,NH), 7.69 (s, 2H,NH2), 13C NMR (DMSO) (ppm): 10.70 (CH3), 18.72 (CH3), 31.62 (CH2), 155.5 (C⚌N) and 178.72 (C⚌S), ESI MS (m/z): 146.1 M+, λmax (nm): 267.
Four transition metal complexes of Cu, Fe, Zn and Co were prepared using the ligand with the chemical formulae [Cu(C5H11N3S)2(SO4)], [Fe(C5H11N3S)2(SO4)], [Zn(C5H11N3S)2(SO4)] and [Co(C5H11N3S)2Cl2]+. The detailed preparation and characterization of the complexes has already been described in our previous manuscript (Khan et al., 2017) and summarized in Supplementary Table 1.
4 Results and discussion
4.1 Spectral characterization of the ligand
The 1H NMR spectrum of the ligand had signals due to CH3, CH2, NH and NH2 groups. Significant shifting in values confirmed the formation of complexes. In the proton spectrum, a triplet at δ 1.1, singlet at δ 1.9, quartet at δ 2.3 were obtained corresponding to CH3, CH3 and CH2 groups respectively. Two small singlets at δ 4.9 and 7.69 were obtained for NH and NH2 groups. The 13C spectrum of the ligand revealed signals at δ 10.70, 18.72, 31.62, 155.5 and 178.72 corresponding to CH3, CH3, CH2, C⚌N and C⚌S groups. NH and NH2 protons were most downfield. Mass spectrum of the ligand furnished a M+1 peak at 146 corresponding to its molecular weight of 145. The IR spectrum of the ligand showed a strong band at 1619 cm−1 related to the azomethine group, ν(C⚌N) (Tada et al., 2011). The strong bands at 1077 cm−1 & 772 cm−1 were assigned to ν(C⚌S) (Bindu and Kurup, 1997). λmax of the ligand (267 nm) corresponded to π-π* transition (Misner et al., 2003).
5 DFT analysis of the ligand
DFT is mainly used for theoretical calculations of electronic structure of a molecule. It is based on quantum mechanical semi-emperical approach for investigations. Theoretical observations may be useful for the prediction of interactions with biological macromolecules as well (Brewerton, 2008).
5.1 Frontier molecular orbital analysis
The energy gap between the highest occupied molecular orbital (HOMO) and the lowest occupied molecular orbital (LUMO) mainly governs the molecular electrical transport properties (Silverstein et al., 1981). HOMO denotes the nucleophilicity, whereas the LUMO represents the electrophilicity. They are also referred to as frontier molecular orbitals (FMOs). The HOMO and LUMO of the ligand is presented in Fig. 1. The negative value of the energy gap indicated molecular stability. Lower HOMO energy value indicated that the molecule has low electron donating ability (Barakat et al., 2015). The energy gap also predicts the intramolecular charge transfer (Padmaja et al., 2009).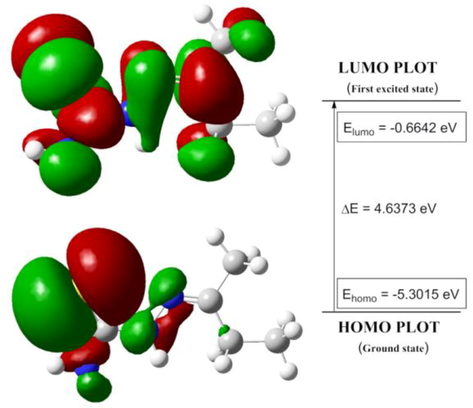
HOMO-LUMO plot of ligand in isolated (gaseous) phase.
HOMO-LUMO energy gap:
HOMO = −5.3015 eV
LUMO = −0.6642 eV
HOMO-LUMO energy difference = −4.6373 eV
5.2 Optimized geometry parameters
The main aim of geometry optimization is to find a new low energy conformation of the molecule. The geometry optimization was done by B3LYP/6–31++G(d,p) method. The N4-C5 bond length was 1.287 Å indicating double bond character (Table 1) (Mary et al., 2008). Bond lengths of S1-C2 aand C2-C9 were 1.663 Å and 1.378 Å respectively indicating partial double bond character. Though the bond lengths were higher than that obtained for a pure double bond length (1.22 Å) suggesting multiple bond character (Politzer and Truhlar, 1981). The optimized structure of the ligand is presented as Supplementary Fig. 2.
Bond length (Å)
Bond angle (°)
Dihedral angle (°)
S1-C2
1.663
S1-C2-N3
126.0
S1-C2-N3-N4
−4.344
C2-N3
1.376
S1-C2-N9
122.4
C2-N3-N4-C5
173.109
N3-N4
1.364
C2-N3-N4
121.6
N3-N4-C5-C6
179.204
N4-C5
1.287
N3-N4-C5
118.2
N3-N4-C5-C7
−0.722
C5-C6
1.505
N4-C5-C6
115.5
N4-C5-C7-C8
−179.54
C5-C7
1.522
N4-C5-C7
123.8
C7-C8
1.532
C5-C6-C8
116.3
C2-C9
1.378
5.3 Molecular electrostatic potential (MEP)
The electrophilic and nucleophilic sites on a molecule are predicted through MEP (Luque et al., 2000). The sites of negative potential are susceptible to nucleophilic attack whereas sites having positive potential are electrophilic. The positive electrostatic potential is shown by blue colour and depicts the area of low electron density. This is the state of repulsion of the proton by the nucleus. The negative electrostatic potential depicted by red colour shows the attraction felt by the proton towards the electron density. Potential increases in the order red < orange < yellow < green < blue. MEP diagram of the ligand (Fig. 2) showed the presence of positive region around hydrogen atoms, whereas the negative region was found around sulphur atom associated with its’ lone pair.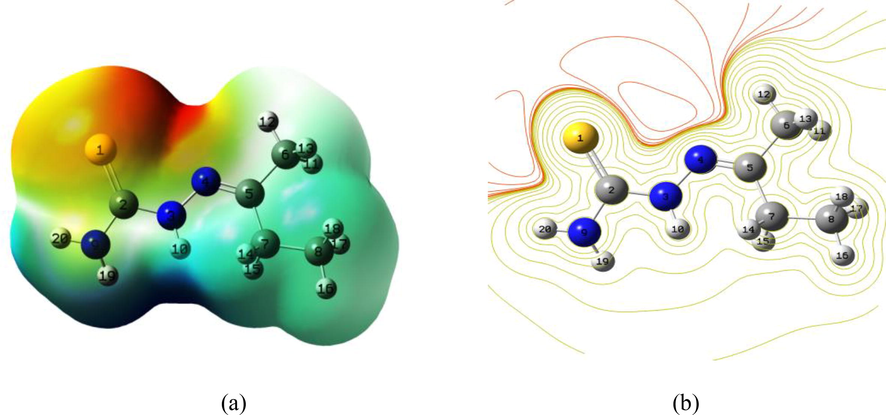
The MEP of Ligand, (a) 3D structure, (b) embedded 2D structure.
The color range, in kcal/mol, is: red greater than 4.5, 4.5 > yellow > −11.0, −11.0 > green > −26.6 and blue < −26.6.
5.4 NMR spectral analysis (1H NMR and FT-IR)
Experimental NMR spectrum of the ligand was obtained in DMSO. The calculated and experimental chemical shifts are given in Tables 2-3. The structure was optimized in Gaussian 09. The experimental values were obtained between 1.1 and 7.69 ppm whereas the calculated values were between 1.03 and 8.03 ppm. The highest deviation was obtained for H14, 15 viz. 0.3 ppm. The 13C chemical shifts were obtained in the range 10.70–178.72 ppm experimentally. The theoretical values were between 8.70 and 180.98 ppm. The highest variation was for C6 viz. 8.5 ppm at the B3LYP level. A larger deviation is obtained for 13C chemical shifts than for 1H. 1H and 13Ccorrelation coefficients (R2) were 0.9964 and 0.9974 respectively (Supplementary Fig. 3). A higher degree of correlation was obtained between 13CNMR experimental and calculated chemical shifts (Asadi et al., 2016).
= Stretching.
= Wagging. τ = Twisting.
= Rocking. σ = Scissoring.
= Out-of-plane deformation.
= In-plane deformation.
Atom
Exp. 1H NMR
Calc. 1H NMR
δexp-δcal
H-10
7.69
8.03
−0.34
H-19,20
4.82
4.74
0.08
H-11,12,13,
1.9
1.97
−0.07
H-14,15
2.3
2.00
0.3
H-16,17,18
1.1
1.03
0.07
Atom
Exp. 13C NMR
Calc. 13C NMR
δexp-δcal
C-2
178.72
180.98
−2.26
C-5
155.85
154.14
1.71
C-6
31.62
23.12
8.5
C-7
18.72
21.17
−2.45
C-8
10.70
8.70
2.0
Modes
IRUnscale
IRScale
IRObserv
%PED
54
3689
3546
3448
[v as(N9H19)(72)- v as(N9H20)(25)]
53
3547
3410
3371
[v s(N9H19)(72)- v s(N9H20)(24)]
52
3532
3396
3251
[v(N3H10)(96)]
51
3163
3040
–
[v (C6H12)(88)]
50
3134
3012
–
[v as(C8H18)(50)- v as(C8H17)(48)]
49
3127
3006
–
[v(C8H16)(64)- v s(C8H17)(18)- v s(C8H18)(17)]
48
3090
2970
2973
[v as(C6H13)(52)- v as(C6H11)(47)]
47
3058
2940
2934
[v s(C8H16)(35)- v s(C8H17)(32)- v s(C8H18)(31)]
46
3039
2921
–
[v s(C6H11)(46)- v s(C6H13)(40)- v s(C6H12)(11)]
45
3018
2901
2906
[v as(C7H15)(50)- v as(C7H14)(48)]
44
2991
2875
2886
[v s(C7H14)(51)- v s(C7H15)(49)]
43
1702
1636
1619
[v(N4C5)(80)]
42
1640
1576
1572
[v(σ-H20N9H19)(81)]
41
1558
1497
1502
[v(σ-H10N3N4)(66)- v(N3C2)(12)]
40
1522
1463
–
[v(σ-H16C8H18)(44)- v(σ-H18C8H17)(23)- v(δ-H18C8C7C5)(11)]
39
1520
1461
–
[v(σ-H17C8H16)(43)- v(σ-H18C8H17)(25)- v(δ-H17C8C7C5)(11)]
38
1493
1435
1435
[v(σ-H13C6H12)(43)- v(σ-H12C6H11)(19)- v(δ-H12C6C5C7)(13)]
37
1489
1432
–
[v(σ-H15C7H14)(40)- v(σ-H11C6H13)(23)]
36
1484
1426
1420
[v(σ-H15C7H14)(30)- v(σ-H11C6H13)(26)]
35
1435
1379
1386
[v(ω-H17C8H16)(18)- v(ω-H16C8H18)(17)- v(ω-H18C8H17)(16)- v(ω-H11C6H13)(10)]
34
1433
1378
1368
[v(N3C2)(12)- v(ω-H16C8H18)(12)- v(ω-H17C8H16)(12)- v(ω-H18C8H17)(11)]
33
1409
1354
1349
[v(N3C2)(20)- v(σ-H19N9C2)(16)- v(ω-H11C6H13)(11)]
32
1366
1313
1286
[v(δ-H15C7C5C6)(28)- v(ω-H15C7H14)(17)- v(δ-H14C7C5C6)(16)]
31
1310
1259
1247
[v(σ-H14C7C8)(53)- v(γ-H15C7C5C6)(19)- v(γ-H14C7C5C6)(13)]
30
1307
1256
–
[v(σ-H10N3N4)(66)- v(N9C2)(52)]
29
1280
1230
1221
[v(C6C5)(27)- v(C7C5)(22)]
28
1179
1133
1107
[v(N3N4)(53)]
27
1121
1077
–
[v(γ-C8C7C5C6)(22)- v(γ-H18C8C7C5)(13)]
26
1103
1060
1066
[v(C8C7)(27)- v(δ-H17C8C7C5)(13)- v(δ-H18C8C7C5)(12)]
25
1059
1018
1036
[v(σ-H19N9C2)(34)- v(C8C7)(15)- v(N3C2)(13)]
24
1025
985
995
[v(δ-H13C6C5C7)(21)- v(δ-H11C6C5C7)(18)- v(C8C7)(16)]
23
1018
979
981
[v(γ-H12C6C5C7)(30)- v(γ-H14C7C8)(10)]
22
997
958
968
[v(C6C5)(13)- v(C8C7)(20)- v(δ-H18C8C7C5)(18)- v(δ-H17C8C7C5)(16)]
21
796
765
772
[v(S1C2)(36)- v(C7C5)(14)- v(σ-C5N4N3)(11)]
20
793
762
–
[v(γ-H16C8C7C5)(22)- v(γ-H14C7C5C6)(13)]
19
777
747
721
[v(C6C5)(23)- v(C7C5)(28)- v(S1C2)(14)]
18
640
615
–
[v(γ-S1N3N9C2)(71)]
17
590
567
583
[v(C6C5)(13)- v(σ-C2N3N4)(13)- v(σ-S1C2N9)(10)]
16
562
541
–
[v(γ-H20N9C2N3)(32)- v(σ-N9C2N3)(13)]
15
558
536
–
[v(γ-H20N9C2N3)(45)- v(γ-S1N3N9C2)(15)]
14
523
503
–
[v(γ-C7C6N4C5)(41)- v(γ-H14C7C5C6)(15)]
5.5 Vibrational spectral analysis
The experimental and calculated (scaled as well as non-scaled) wave numbers were observed between 400 and 4000 cm−1 and calculated PED are given in Table 3. The calculated and experimental IR spectra are given in Fig. 3. The correlation coefficient (R2) was 0.9984 showing good agreement between the calculated and experimental values (Supplementary Fig. 4). The experimental and theoretical peak of C⚌ was found at 1619 and 1639 cm−1 respectively. The experimental and theoretical C⚌S peaks were obtained at 772 and 765 cm−1 respectively (Roeges, 1994). The experimental and theoretical asymmetric νas NH vibrations were obtained at 3448 and 3546 cm−1 respectively. The experimental and theoretical symmetric νsym vibrations were obtained at 3371 and 3410 cm−1 respectively. The difference may be due to intermolecular interactions as the experimental spectrum was obtained in solid state. The stretching N-N vibration was at 1107 cm−1 and the calculated value was 1133 cm−1 (Singh et al., 2013; Gambino et al., 2007). The C–H in plane deforming vibration was observed at 1435 cm−1 experimentally and coincided with the observed value. The difference between the experimental and calculated harmonic frequencies may be due to non competent treatment of electronic correlation (James et al., 2011). A scaling factor of 0.9613 was used to scale down the calculated wave number to remove any possible harmonicity (Pople et al., 1981).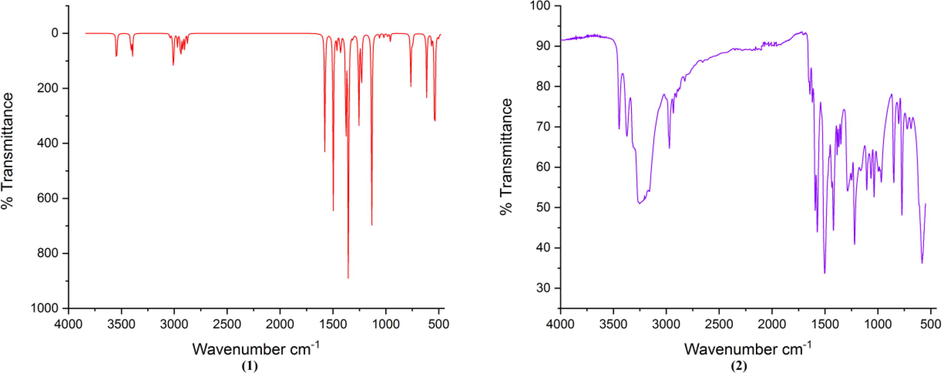
Calculated (a) and Experimental (b) IR spectrum of ligand.
5.6 UV–vis spectral analysis
The UV–visible spectrum of 2-butanone thiosemicarbazone was calculated using the time dependent density functional theory (TD-DFT). The spectrum was obtained both in gaseous phase as well as in solvent phase in DMSO (Fig. 4). The experimental spectrum was recorded in DMSO with the λmax obtained at 267 nm and a shoulder band (Khan et al., 2017). In gaseous phase three transitions at 303, 269 and 251 nm were obtained corresponding to π → π* charge transfer transition. The π → π* transition is mainly governed by HOMO → LUMO excitation. In solvent phase (DMSO) transitions at 305, 261 and 248 nm were obtained. The electronic transitions are presented in Table 4. Transitions involved with oscillator strength viz. f = 0.1455 and 0.1022 were not obtained experimentally. The electronic transitions were accompanied by a slight red shift in DMSO which may be attributed to electrostatic and dispersion contributions and H-bonding (Krawczyk, 2015). Solvatochromic changes also occur when polarity of the medium is changed (Zakerhamidi et al., 2012).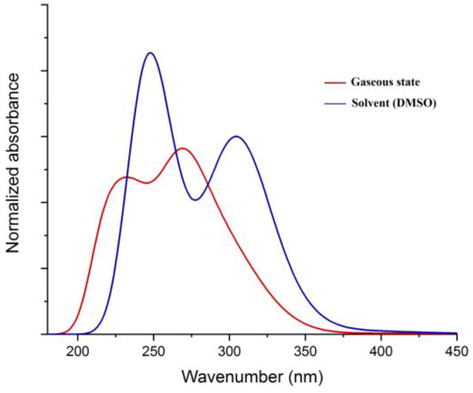
TD-DFT predicted UV–vis spectra in gaseous and solvent (DMSO) states.
Excitation energy (eV)
Oscillator strength (f)
Experimental wavelength (nm)
Calculated Wavelength (nm)
Major trasition and expansion coefficient
Assignment
Contribution %
Gaseous state
4.0873
0.0485
–
303.34
H(38) → L(40) (0.56614)
π → π*
32.05
4.6003
0.1208
–
269.51
H(39) → L(41) (0.57411)
π → π*
32.96
4.9298
0.0025
–
251.50
H(38) → L(41) (0.63928)
π → π*
40.86
Solvent (DMSO)
4.0579
0.1455
–
305.54
H(38) → L(40) (0.64965)
π → π*
42.20
4.7421
0.0378
267
261.45
H(39) → L(41) (0.53050)
π → π*
28.14
4.9970
0.1022
–
248.12
H(37) → L(40) (0.53544)
π → π*
28.66
5.7 Global reactivity descriptors
Hardness (η), global softness (S), electronegativity (χ), chemical potential (µ) and electrophilicity index (ω) are the global reactivity descriptors generally used to predict the stability and reactivity (Geerlings et al., 2003). The electrophilicity index describes the tendency of a molecule to accept electron. A nucleophile has a lower value of ω, whereas an electrophile has high value of ω (Babu and Jayaprakash, 2015). The value of chemical potential (μ) describes the reactivity of the compound. The greater the electronic potential, more reactive would be the compound. According to Koopman’s theorem, global reactivity descriptors are calculated using HOMO and LUMO of the FMOs (Parr and Yang, 1989). The low value of global electrophilicity index (1.9185) indicated ligand’s nucleophilic nature. The ionization energy (I) and electron affinity (A) can be predicted through HOMO and LUMO orbital energies as I = -EH and A = EL. ΔNmax defines the electrophilic charge transfer (ECT) between the two molecules. If ECT is greater than 0 then charge flows from second molecule to first. ECT is calculated from the equation- ECT = (ΔNmax)1-(ΔNmax)2, here (ΔNmax)1 = −(µ/η)1 and (ΔNmax)2 = −(µ/η)2. The ΔNmax for the reacting molecules is 1.2868 indicating that the charge flows from molecule 2 to 1 (Singh and Singh, 2015). Calculated global descriptors are given in Supplementary Table 2.
5.8 Natural bond orbital analysis (NBO)
NBO also helps in understanding the hybridization, covalent bonding, hydrogen bonding and van der Waals interaction (Glendening et al., 2001). Second order perturbation theory analysis of the Fock matrix in the NBO basis for intermolecular interactions was calculated by DFT/B3LYP/6–311++G(d,p) method is presented in Supplementary Table 3. Stable donor to acceptor interactions involve delocalization of electron density between occupied Lewis-type (bonding or lone pair) NBO’s and unoccupied (antibonding) non-Lewis NBO’s (Glendening et al., 2001). The most important interaction was related to electron donation from n(2)S1 atom to the σ*C2-N3 resulting in the maximum stabilization energy 19.08 kcal/mol.
5.9 Thermodynamic calculations
Thermodynamic energies were calculated using vibrational frequency calculations for the ligand at 298.15 K. The values of enthalpy (ΔHReaction), Gibbs free energy (ΔGReaction) and entropy change of reaction (ΔSReaction) are given in Supplementary Table 4. The negative values of ΔH and ΔG indicated that the ligand formation is exothermic and spontaneous at room temperature. The free energy of the molecule was calculated including the zero-point vibrational energy.
5.9.1 Non-linear optical properties
To test the non-linear optical response of the ligand, dipole moment (μ0), polarizability (α0), anisotropy of polarizability (Δα) and first hyperpolarizability (β0) were calculated at B3LYP/6–31++G (d,p) basis set level.
The calculated polarizability of the ligand (Δα) was 6.1054 × 10⁻²³ esu and α0 and β0 were 1.3533 × 10⁻²³ esu and 4.8098 × 10⁻³⁰ esu respectively. Urea is one of the archetypal compounds known for its NLO properties (Supplementary Table 5). The β0 value of urea is 0.13x10⁻³⁰ esu. The hyperpolarizability of the ligand was higher than urea.
6 Molecular docking studies
iGEMDOCK 2.1 is a graphical, automated software for integrated docking. For docking, protein and ligand structure files were prepared. The binding sites were defined and prepared. The set parameters were as follows: screening: population size = 800, generations = 80, number of solutions = 10. The empirical scoring function of iGEMDOCK is estimated as: where, vdW = van der Waal energy, H bond = hydrogen bonding energy, Elect = electrostatic energy
The ligand was docked with the binding site using accurate docking function (slow docking). AutoDock 4.2.6 was also used for the prediction of the binding energy. Ligand and its four complexes were docked with NADPH oxidase and MPO. Many cellular pathways and environmental conditions cause production of reactive oxygen species (ROS) (Singh and Singh, 2015). Reactive oxygen and nitrogen species are often produced by cellular enzymes such as myeloperoxidase, cytochrome P450 oxidases and NADPH oxidases (Singh and Singh, 2015) etc. Energy minimization was done by General AMBER force field (GAFF). Against NADPH [Fe(C5H11N3S)2SO4] possessed minimum energy viz. −105.60 kcal/mol and −6.9 kcal/mol. Against MPO also [Fe(C5H11N3S)2SO4] showed minimum binding energies −116 and −7.3 kcal/mol as predicted by the two softwares. The docking poses of Fe complex are shown as Fig. 5 (a,b). Docking interactions are given in (Supplementary Tables 6–7 and Fig. 5-6).![Docking poses of [Fe(C5H11N3S)2(SO4)] with (a) NADPH and (b) MPO.](/content/185/2021/33/2/img/10.1016_j.jksus.2020.101313-fig5.png)
Docking poses of [Fe(C5H11N3S)2(SO4)] with (a) NADPH and (b) MPO.
6.1 Free radical scavenging activity
The free radical scavenging activity of all the synthesized metal complexes was evaluated by DPPH Assay (Scherer and Godoy, 2009). The antioxidant activity was tested at 10, 50, 80 and 100 µM concentration. The absorbance was measured at 517 nm. Lower the absorbance, higher would be the free radical scavenging activity. The scavenging the DPPH radical was calculated by using the following formula: where, Ac = absorbance of the control reaction (DPPH solution) and
As = absorbance of the complexes
Uncontrolled generation of ROS causes redox imbalance and oxidative stress harmful for many diseases including cancer and neurological disorders. The antioxidant activity is summarized in Table 5. [Fe(C5H11N3S)2(SO4)] showed maximum antioxidant activity viz. 81.70% followed by [Co(C5H11N3S)2Cl2]+ (77.15%).
Complex
10 µM/mL
50 µM/mL
80 µM/mL
100 µM/mL
[Cu(C5H11N3S)2SO4]
67.55
68.13
68.13
72.61
[Fe(C5H11N3S)2SO4]
72.61
73.16
77.80
81.70
[Zn(C5H11N3S)2SO4]
64.43
64.89
64.89
73.55
[Co(C5H11N3S)2Cl2]+
67.85
70.04
74.60
77.15
7 Future scope of the study
The study has elaborated the use of DFT technique for the prediction of molecular structure and prediction of important properties of the compound. The potential NLO properties of the ligand may be explored further for its use in optical devices. Furthermore, the potential antioxidant activity of the complexes can also be useful for the development of antioxidant drugs.
8 Conclusion
2-butanone thiosemicarbazone was synthesized and characterized by 1H and 13C NMR, FT-IR, UV–Vis and mass spectroscopic techniques. The experimental data was validated using DFT generated theoretical data. DFT analysis mainly correlates electronic structure of compound long with various parameters such as HOMO-LUMO, MEP, spectral as well as chemical reactivity analysis. It also explains internal hydrogen bonding along with other interactions. On the other hand, docking analysis provides information about the interaction of a lead compound with the target proteins. HOMO-LUMO energy gap illustrates the chemical stability which is an important decisive factor for the prediction of the reactivity of a molecule. The FMO analysis predicted that the molecule is stable. The low value of global electrophilicity index (1.9185) indicated its’ nucleophilic nature. In solvent phase the λmax values experienced a slight red shift. In case of NMR, a larger deviation was obtained for 13C chemical shifts than for 1H. The antioxidant activity of four complexes of the ligand was tested using DPPH assay. Fe complex was found to possess maximum antioxidant potential followed by Cu complex. Molecular docking studies showed that the Fe complex released the minimum binding energy. The docking results were further validated by the experimental results of the antioxidant activity.
Acknowledgements
The authors are thankful to Mr. Mohsin Ali Khan, Chancellor, Era’s University, Lucknow, for extending the necessary facilities and co-operation for carrying out in silico studies and biological activity evaluation. The authors are also thankful to the R&D wing of Integral University, Lucknow, for allotting the communication number (IU/R&D/2018-MCN000260) to the manuscript. Dr.Mohammad Azam is thankful to the support through Researchers Supporting Project number (RSP-2020/147), King Saud University, Riyadh, Saudi Arabia.
Declaration of Competing Interest
The authors declare that they have no known competing financial interests or personal relationships that could have appeared to influence the work reported in this paper.
Funding
This research did not receive any specific grant from any specific grant from funding agencies in the public, commercial, or not-for-profit sectors.
References
- Novel compounds of 4-amino-1, 4-triazole with dicarboxylic acids–crystal structures, vibrational spectra and non-linear optical properties. J. Mol. Struct.. 2008;873:46-60.
- [Google Scholar]
- Ab initio, DFT, and spectroscopic studies of excited-state structure and dynamics of 9-ethylfluorene. J. Mol. Struct.. 2008;892:110-115.
- [CrossRef] [Google Scholar]
- The use of protein–ligand interaction fingerprints in docking. Curr. Opin. Drug Discov. Devel.. 2008;11:356-364.
- [Google Scholar]
- Molecular model of the outward facing state of the human multidrug resistance protein 4 (MRP4/ABCC4) Bioorg. Med. Chem. Lett.. 2008;18:3481-3483.
- [Google Scholar]
- Reviews in Computational Chemistry. John Wiley & Sons; 2009.
- Crystal and molecular structure of 2-amino-5-chloropyridinium hydrogen selenite and its IR and Raman spectra, DFT calculations and physicochemical properties. J. Raman Spectrosc.. 2008;39:863-872.
- [Google Scholar]
- Can the pharmaceutical industry reduce attrition rates? Nature Reviews and Drug Dis.. 2004;3:711-715.
- [Google Scholar]
- Thiosemicarbazone metal complexes: from structure to activity. Open Crystal J.. 2010;3:16-28.
- [Google Scholar]
- Molecular docking, PASS analysis, bioactivity score prediction, synthesis, characterization and biological activity evaluation of a functionalized 2-butanone thiosemicarbazone ligand and its complexes. J. Chem. Biol.. 2017;10:91-104.
- [Google Scholar]
- Secondary metabolites of the sponge-derived fungus Acremonium persicinum. J. Nat. Prod.. 2013;76
- [Google Scholar]
- Rearranged diterpenes and norditerpenes from three Australian Goniobranchus mollusks. J. Nat. Prod.. 2015;79:477-483.
- [Google Scholar]
- Comparison of experimental and DFT-calculated NMR chemical shifts of 2-amino and 2-hydroxyl substituted phenyl benzimidazoles, benzoxazoles and benzothiazoles in four solvents using the IEF-PCM solvation model. Magn. Reason. Chem.. 2015;54:298-307.
- [Google Scholar]
- Synthesis, characterization and antimicrobial studies on some transition metal complexes of thiosemicarbazone. Int. J. Res. Pharm. and Bio. Sci.. 2013;4:305-311.
- [Google Scholar]
- Synthesis and characterization of some new thiosemicarbazide derivatives and their transition metal complexes. J. Chem. Pharm. Res.. 2011;3:290-297.
- [Google Scholar]
- E.S.R. and electrochemical studies of four- and five-coordinate copper(II) complexes containing mixed ligands. Trans. Met. Chem.. 1997;22:578-582.
- [Google Scholar]
- Directed Deposition of Nanoparticles Using Diblock Copolymer Templates. Adv. Mat.. 2003;15:221-224.
- [CrossRef] [Google Scholar]
- Spectrometric Identification of Organic Compounds. New York: Wiley; 1981.
- Synthesis, NMR, FT-IR, X-ray structural characterization, DFT analysis and isomerism aspects of 5-(2,6-dichlorobenzylidene)pyrimidine-2,4,6(1H,3H,5H)-trione. Spectrochim Acta A: Mol. Bio. Spect.. 2015;147:107-116.
- [CrossRef] [Google Scholar]
- Density functional study on the structural conformations and intramolecular charge transfer from the vibrational spectra of the anticancer drug combretastatin-A2. J. Raman Spectrosc.. 2009;40:419-428.
- [Google Scholar]
- Vibrational spectroscopic studies and ab initio calculations of 5-nitro-2-(p-fluorophenyl)benzoxazole. Spectrochim. Acta.. 2008;71A:566-571.
- [CrossRef] [Google Scholar]
- Politzer P., Truhlar D.G., eds. Chemical Application of Atomic and Molecular Electrostatic Potentials. New York: Plenum; 1981.
- Perspective on Electrostatic interactions of a solute with a continuum. A direct utilization of ab initio molecular potentials for the prevision of solvent effects. Theor. Chem. Acc.. 2000;103:343-345.
- [Google Scholar]
- A structural study of fentanyl by DFT calculations, NMR and IR spectroscopy. J. Mol. Str.. 2016;1128:552-562.
- [Google Scholar]
- A Guide to the Complete Interpretation of Infrared Spectra of Organic Structures. New York: Wiley; 1994.
- A combined experimental and theoretical (DFT and AIM) studies on synthesis, molecular structure, spectroscopic properties and multiple interactions analysis in a novel Ethyl-4-[2-(thiocarbamoyl)hydrazinylidene]-3,5-dimethyl-1H-pyrrole-2-carboxylate and its dimer. Spectrochim. Acta Part A Mol. Biomol. Spectrosc.. 2013;112:182-190.
- [CrossRef] [Google Scholar]
- Vibrational spectra of palladium 5-nitrofuryl thiosemicarbazone complexes: Experimental and theoretical study, Spectrochim. Acta Part A Mol. Biomol. Spectrosc.. 2007;68:341-348.
- [CrossRef] [Google Scholar]
- Evolution of amide stacking in larger γ-peptides: triamide H-bonded cycles. J. Phys. Chem. A. 2011;115:13783-13798.
- [Google Scholar]
- Molecular orbital studies of vibrational frequencies. Int. J. Quantum Chem.. 1981;15:269-278.
- [Google Scholar]
- Time-dependent density functional theory calculations of the solvatochromism of some azo sulfonamide fluorochromes. J. Mol. Model.. 2015;21:118.
- [Google Scholar]
- Solvatochromism effects on the dipole moments and photo-physical behavior of some azo sulfonamide dyes. Spectro Acta Part A. 2012;85:105-110.
- [Google Scholar]
- Global and reactivity descriptors studies of cyanuric acid tautomers in different solvents by using of density functional theory (DFT) J. Chem. Pharm. Res.. 2015;7:1155-1160.
- [Google Scholar]
- Density Functional Theory of Atoms and Molecules. Oxford, New York: Oxford University Press; 1989.
- Synthesis, molecular structure, spectral analysis, natural bond order and intramolecular interactions of 2-acetylpyridine thiosemicarbazone: A combined DFT and AIM approach. J. Mol. Str.. 2015;1094:61-72.
- [Google Scholar]
- NBO Version 3.1. Pittsburgh, PA: Gaussian Inc.; 2001.
- Synthesis, crystal structure, spectroscopic analysis and computational study of (Z)-1-(2, 4-dinitrophenyl)-2-((E)-3-(4-methoxyphenyl)-1-(thiophen-2-yl) allylidene) hydrazine by DFT and AIM approach. J. Mol. Str.. 2015;1089:191-205.
- [CrossRef] [Google Scholar]
- Antioxidant activity index (AAI) by the 2,2-diphenyl-1-picrylhydrazyl method. Food Chem.. 2009;112:654-658.
- [CrossRef] [Google Scholar]
Appendix A
Supplementary data
Supplementary data to this article can be found online at https://doi.org/10.1016/j.jksus.2020.101313.
Appendix A
Supplementary data
The following are the Supplementary data to this article:


