

Translate this page into:
Metal contaminants and chloramphenicol in Litopenaeus vannamei and Penaeus silasi at various supply chain stages in Johor Bahru, Malaysia and their health risk assessment
⁎Corresponding authors at: Department of Chemistry, Faculty of Science, Universiti Teknologi Malaysia, Johor Bahru 81310, Johor, Malaysia (N.A. Mahat). Department of Bioprocess and Polymer Engineering, School of Chemical and Energy Engineering, Faculty of Engineering, Universiti Teknologi Malaysia, Johor Bahru 81310, Johor, Malaysia (I.I. Muhamad). naji.arafat@utm.my (Naji Arafat Mahat), naji@kimia.fs.utm.my (Naji Arafat Mahat), idaidayu@utm.my (Ida Idayu Muhamad)
-
Received: ,
Accepted: ,
This article was originally published by Elsevier and was migrated to Scientific Scholar after the change of Publisher.
Peer review under responsibility of King Saud University.
Abstract
Abstract
Objectives
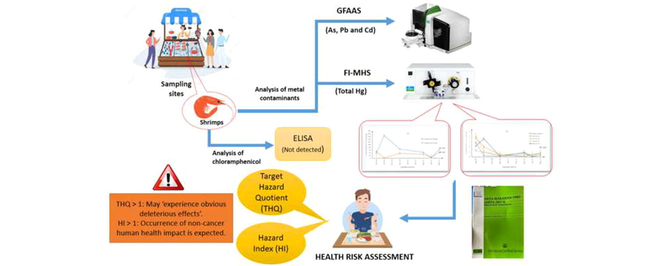
This present research evaluated the concentrations of metal contaminants (As, Pb, Cd and total Hg) and chloramphenicol as prescribed by the Malaysian Food Act (1983) and Regulations (2021) in Penaeus silasi and Litopenaeus vannamei shrimps sampled from the different supply chain stages (landing sites, major markets and grocers) in Johor Bahru, Johor, Malaysia at six sampling intervals.
Methods
Graphite furnace atomic absorption spectrometer and flow injection mercury/hyride system were used to determine the concentration of As, Pb and Cd as well as total Hg, respectively. Enzyme-linked immunosorbent assay was used to determine the concentration of chloramphenicol.
Results
The median As and Cd concentrations during the six sampling intervals ranged between below detection limit-167.5 mg/kg and 0.46 mg/kg, respectively. The total Hg concentrations ranged between 0.02 and 1.13 mg/kg. Although Pb and chloramphenicol were not detected, As and total Hg concentrations varied significantly across sampling intervals (P < 0.05), exceeded the maximum permitted proportions prescribed by the Malaysian law. Identified as P. silasi, shrimps from landing sites Mersing and Pontian had significantly higher As and total Hg concentrations than those of L. vannamei from major markets and their surrounding grocers (P < 0.05). Alarmingly, Hazard Index for P. silasi from landing sites Mersing and Pontian as well as L. vannamei from major markets and grocers exceeded 1.00.
Conclusion
Hence, formulating suitable intervention programs and devising efficient removal technologies are paramount for benefiting the public at large.
Keywords
Litopenaeus vannamei
Penaeus silasi
Metal contaminants
Health risk assessment
Graphite furnace atomic absorption spectrometry
Flow injection mercury/hydride system

- AC
-
Average consumer
- AKUATROP
-
Institute of Tropical Aquaculture and Fisheries
- AOAC
-
Association of Official Analytical Collaboration
- As
-
Arsenic
- Cd
-
Cadmium
- DNA
-
Deoxyribonucleic acid
- DOF
-
Department of fishery
- EDI
-
Estimated dietary intake
- ELISA
-
Enzyme-linked immunosorbent assay
- FI-MHS
-
Flow injection mercury/hydride system
- GF-AAS
-
Graphite furnace-atomic absorption spectrometer
- GPS
-
Global positioning system
- HC
-
High consumer
- HCl
-
Hydrochloric acid
- Hg
-
Mercury
- HI
-
Hazard index
- HNO3
-
Nitric acid
- IBM
-
International Business Machines
- i.e
-
That is
- KMNO4
-
Potassium permanganate
- LOD
-
Limit of detection
- LLOQ
-
Lower limit of quantification
- MPP
-
Maximum permitted proportion
- MRL
-
Maximum residue limit
- MYR
-
Malaysia ringgit
- P
-
Probability
- Pb
-
Lead
- PTDI
-
Provisional tolerable daily intake
- RFD
-
Oral reference dose
- RSD
-
Relative standard deviation
- SnCl2
-
Tin(II) chloride
- SPSS
-
Statistical Package for the Social Sciences
- THQ
-
Target hazard quotient
- USA
-
United States of America
- USEPA
-
United States Environmental Protection Agency
- USFDA
-
United States Food and Drug Administration
- UTM
-
Universiti Teknologi Malaysia
- Viz
-
Namely
- WHO
-
World Health Organization
Abbreviations
1 Introduction
White shrimp (Litopenaeus vannamei) and false white shrimp (Penaeus silasi) are popular aquaculture products in many countries (Okpala et al., 2014). According to the Malaysia Department of Fisheries (DOF), Malaysia has been producing 50,000 metric tons of shrimps a year (approximately 13 % of aquaculture total production volume), contributing to approximately MYR 1.3 billion worth of fishery exports (DOF, 2020). Exclusively for Johor (the southernmost state of peninsular Malaysia), about 4457.94 metric tons of shrimps have been traded in the market for the year of 2019, accountable for approximately MYR 175 million in economic values (Abidin M.N, personal communication, August 25, 2020). The escalating demand for shrimps has been attributable to its comparatively affordable price and favorable nutritional values (Pires et al., 2018), as well as the rapidly growing population (Ghee-Thean et al., 2016).
Interestingly, despite being cheaper in prices than that of black tiger shrimps (Penaeus monodon), L.vannamei has been reported to have a higher protein content (18.8 %) than that of the former (17.1 %) (Sriket et al., 2007). Despite slightly lower protein content in P. silasi (13.6 %) (European Commission, 2021) than those of L. vannamei and P. monodon, the false white shrimp can still be considered as an important source of protein. Such findings would translate as L. vannamei and P. silasi being good sources of amino acids, especially those of essential ones for human consumption (Gunalan et al., 2013).
Pollution by metal contaminants in the aquatic ecosystem is one of the most alarming, decade-long environmental issues due to their inherent toxicity, non-degradability and persistency in water (Muneer et al., 2022). Such a situation eventually leads to toxic accumulations in aquatic organisms (Olmedo et al., 2013). Industrial, agricultural and mining activities appear to be among the major sources of the anthropogenic contamination of the aquatic ecosystem for metal contaminants (Muneer et al., 2022). In this context, researchers (Rabiul Islam et al., 2017; Mahat et al., 2018) indicated the possible toxicities of metal contaminants via ingestion of seafood following acute and chronic exposures. The adverse health implications included brain damage, paralysis, anemia and disruption of vital body systems (Rabiul Islam et al., 2017; Mahat et al., 2018). In addition, contamination of the aquatic ecosystem with pharmaceutical drugs would further exert an unwanted environmental stressor on aquatic organisms (McCallum et al., 2019). Being a broad spectrum antibiotic, chloramphenicol has been illegally used in aquaculture for promoting growth and production, as well as treating bacterial diseases of aquatic products (like white shrimps) (Suseno et al., 2016). Because chloramphenicol can be carcinogenic and possibly suppress the human bone marrow, as well as affecting various vital systems in the human body including that of the reproductive, its utilization in food producing animals for human consumption has been banned by many developed countries (Chen et al., 2020). Importantly, it has also been indicated that bacterial antibiotic resistance such as chloramphenicol can be augmented by heavy metals (e.g. species of arsenic) even at sub-toxic levels which subsequently may cause higher health risk towards human and the environment (Chen et al. 2015).
Despite the categorical placement of Malaysian shrimp exporters in the United States Food and Drug Administration (US FDA) red list due to the detection of chloramphenicol since 2018, such tainted shrimps have been reportedly sold in Malaysia for domestic consumption (Malay Mail, 2020, January 4). In the immediate response by the DOF (2020), a press statement associating the presence of chloramphenicol to the element of transshipment, by illegally importing shrimps and re-exporting the commodity to the USA, was made on 4th January 2020. However, no tangible evidence has been offered to support such a claim. Such a negative connotation has not only tarnished the reputation of Malaysia as one of the aquaculture products exporting countries in Asia, but also detrimentally affects the well-being of the population, causing public health and economic issues that merit scientific clarification.
It is pertinent to indicate here that the Malaysian Food Act 1983 (Act 281) and Regulations (2021) has specifically listed four toxic metals namely arsenic (As), lead (Pb), cadmium (Cd) and total mercury (total Hg) to be analyzed for shrimps meant for human consumption, consistent with many other international guidelines. The Maximum Permitted Proportions (MPPs) (wet weight) for As, Pb, and Cd as 1.0 mg/kg, with slightly lower MPP of 0.5 mg/kg for total Hg in shrimps. In addition, the Malaysian Food Act 1983 (Act 281) and Regulations (2021) further specifies that chloramphenicol must not be detected in any type of foods, including shrimps, accentuating its severe toxicity for human consumption. Considering these specific indications by the Malaysian law, As, Pb, Cd, total Hg and chloramphenicol analyses were investigated in shrimps sampled in this present research.
While review of literature does not reveal any study that evaluated chloramphenicol in shrimps from Malaysia, studies on the amount of metal contaminants in the same matrix appear to suffer a great deal of limitations. The limitations include (a) analysis that excluded As and Hg, leading to inappropriate conclusion on its risk assessment (e.g. Yap et al., 2019), (b) inadequate description of sampling procedure and locations (e.g. Rajan and Ishak, 2017), (c) outdated sampling time (e.g. Anual et al., 2018) as well as (d) incomplete validation data (e.g. Rajan and Ishak, 2017). Moreover, there is no medium to long-term study that investigated all the four metal contaminants (As, Pb, Cd and total Hg) and chloramphenicol in L. vannamei and P. silasi sold at various supply chain stages (seafood landing sites, major markets and retail grocers) in Malaysia. While it is important to ensure that the concentrations of metal contaminants (viz. As, Pb, Cd and total Hg) in L. vannamei and P. silasi comply fully with the prescribed MPPs, it is also paramount to perform its health risk assessment (target hazard quotient (THQ) and hazard index (HI)). Such evaluations are important because the long-term consumption of metal contaminants (even at low concentrations) can cause detrimental effects on human (Rabiul Islam et al., 2017). The effects include disruption of numerous physiological and biochemical processes, resulting in various health problems including thalassemia, dermatitis, brain and kidney damages or worse, cancer (World Health Organization, WHO, 2021).
Hence, this study was aimed at determining the amounts of metal contaminants as prescribed by the Malaysian law (i.e. As, Pb, Cd and total Hg) and chloramphenicol in L. vannamei and P. silasi obtained from various supply chain stages (viz. seafood landing sites, major markets and retail grocers) in Johor Bahru, a metropolitan located in the eastern most part of peninsular Malaysia. Additionally, this research too was aimed at investigating its health risk assessment which may prove beneficial for the relevant health authorities in developing and implementing appropriate intervention strategies for the community as a whole.
2 Materials and method
2.1 Standards and reagents
This present research utilized analytical-grade potassium permanganate (KMNO4) and tin (II) chloride dehydrate (SnCl2·2H2O) procured from Merck (Germany). As for the standard compounds (≥99.5 % purity) for As, Pb, and Cd (in 2 % HNO3) as well as the total Hg (in 10 % HNO3) and chloramphenicol (≥98 %), they were purchased from Sigma Aldrich (USA). Using deionised water from Sartorius arium® pro ultrapure water system (Gottingen, Germany), the standards and sample solutions were prepared. For performing the sample digestion process, HNO3 (65 %), HCL (37 %), and H2O2 (30 %), purchased from QRëC (Malaysia) were used.
2.2 Study areas and species identification
Shrimp samples were collected from three different stages of supply chain in Johor Bahru, Johor, Malaysia involving seafood landing sites (Mersing and Pontian), major markets (A and B), as well as selected retail grocers. The grocers were situated within 2 km radius from the two aforementioned major markets (4 grocers for each surrounding area). The Global Positioning System (GPS) locations for all the sampling sites are provided in Table 1. Grocers A1-A4 and B1-B4 represent the local grocers located within the 2 km radius from the major markets A and B, respectively. The sampling of shrimps was made during September, October and December 2020 as well as March, April and May 2021.
No.
Sites and its GPS location
Sites and its GPS location
1.
Landing site-Mersing
(2.430982416136425, 103.83227796784125)
Landing site-Pontian
(1.4768940315293275, 103.39219689416595)
2.
Major market A
(1.526570624610324, 103.76434922551348)
Major market B (1.5088179268241801, 103.6868391966782)
3.
Grocer A1
(1.5138702258276695, 103.75594764085491)
Grocer B1
(1.5118170264519906, 103.70286628318422)
4.
Grocer A2
(1.5344204088936395, 103.75677668419345)
Grocer B2
(1.5002180036423767, 103.68038923832047)
5.
Grocer A3
(1.5262789438207183, 103.77543563534728)
Grocer B3
(1.5001916782102087, 103.69381205434894)
6.
Grocer A4
(1.5452680026820311, 103.7637178251649)
Grocer B4
(1.5134873525772132, 103.68266679347974)
While P. silasi was the species identified at seafood landing sites Mersing and Pontian, L. vannamei was the one available at the major markets A and B as well as the selected surrounding retail grocers. Morphological taxonomic identification of the shrimps was performed by a fishery expert from Universiti Malaysia Terengganu, followed by comparing the DNA sequences of Cytochrome oxidase 1 gene with that of the GenBank database (https://blast.ncbi.nlm.nih.gov). The molecular identification was performed by a certified DNA analyst at Research Laboratory Division, Institute of Tropical Aquaculture and Fisheries (AKUATROP), Universiti Malaysia Terengganu.
2.3 Sampling
Each sample (300 g of pooled shrimps) was purchased from all the landing sites and markets over a period of six sampling intervals (September, October and December 2020 as well as March, April and May 2021). Each collected sample was transported to the laboratory in a cold box filled with ice cubes, and immediately kept at −20 °C prior to analysis. Taking into account the better homogeneity as well as the readiness of guidelines for inferring toxicity (Mahat et al., 2018), the dry weight of the shrimp sample was used in this study. The sample was thawed at room temperature (about 26 °C) on a clean tissue paper, followed by removing their exoskeletons. For enabling fast drying process, the flesh was cut into small pieces (about 2 cm each) and dried in an oven at 60 °C until the constant dry weight was achieved. Next, the sample was pulverized into a fine powdery form using kitchen grinder and stored in an airtight plastic container at room temperature (about 26 °C) until further analysis.
2.4 Analyses of metal contaminants
The chemical analyses were conducted in a certified (MS ISO/IEC 17025:2017) commercial laboratory at Universiti Teknologi Malaysia, Johor Bahru. Analysis of metal contaminants was performed using the laboratory in-house methods (TM/UTM/CHEM/SF), adapted from the AOAC 999.10 standard methods, Association of Official Analytical Collaboration, AOAC (2008). Prior to chemical analysis using a graphite furnace-atomic absorption spectrometer (GF-AAS) and flow injection mercury/hydride system (FI-MHS), the sample was digested using a microwave digester (Titan-MPS, Perkin Elmer). About 0.5 g of pulverized and dried sample of shrimps was weighed directly into a digestion vessel, followed by the addition of 5.0 mL of concentrated HNO3 65 % (w/w) and 2 mL of hydrogen peroxide (30 %). The sealed vessel was then placed in a microwave digestion system. Upon completion, the obtained solution was transferred into a volumetric flask (25 mL) and further diluted with deionized water to a final total volume of 25 mL.
An atomic absorption spectrometer (Analyst PinAAcle 900 T, Perkin-Elmer) equipped with a graphite furnace and an auto sampler (GF-AAS) was used for quantitating the respective concentrations of As, Pb, and Cd, while flow injection mercury/hydride system (FI-MHS) (FIAS 100, Perkin Elmer) was utilized for the total Hg. The argon gas flow was maintained at 250 L/min with the sample volume of 20 µL, the temperature programming of the furnace started with the drying process (about 30 s at 120 °C) and increased to 160 °C after 30 s. The pyrolysis was achieved at 1200 °C for 20 s. Electrode-less discharge lamp was used with 0.7 nm slit width and the observed wavelengths were: 283.3 nm (Pb), 228.8 nm (Cd) and 193.7 nm (As). The analytical conditions of FI-MHS were as follows: argon flow 90 mL/min at 20 s integration time, wavelength of 253.7 nm and a slid width of 0.7 nm.
The working standards for As and Pb were 10–100 µg/L, while Cd and total Hg were 1–4 µg/L and 1–10 μg/L, respectively. A 3 % HCl solution was used as the diluent for total Hg standard. For preparing the reducing agent (1.1 % SnCl2), 11 g of SnCl2·2H2O was mixed with 10 mL deionized water and 3 mL of concentrated HCl, prior to leaving it to stand for 10 min. The solution was then transferred into a 100 mL volumetric flask and further diluted with deionized water up to the calibration mark. For preparing the carrier solution for the FI-MHS analysis, 30 mL of concentrated HCl was diluted with deionized water (up to the mark) in a 1 L volumetric flask. The KMNO4 solution (5 %) was prepared by diluting 1.25 g of KMNO4 with deionized water in a 25 mL volumetric flask. To stabilize the solutions for calibration standard of Hg and blank, four drops of % KMNO4 solution were added.
2.4.1 Analytical method validation
For analyzing As, Pb, and Cd as well as total Hg in shrimp samples, the methods were validated following the parameters prescribed by the US FDA for bioanalytical method validation (US FDA, 2018). The shrimp samples were spiked with known amounts of standards via serial dilutions, and their calibration curves were plotted accordingly. The ranges of calibration curves were 10, 25, 50, 75 and 100 µg/kg for As and Pb, as well as 1, 2, 3, and 4 µg/kg for Cd and 1, 2, 5, and 10 μg/kg for total Hg. Following the criteria prescribed by the United States Environmental Protection Agency US EPA (2010), the calibration curves may be accepted if the coefficient of determination (R2) is ≥ 0.995 with relative standard deviation (RSD) of ≤ 20 %. Using the equations described by US FDA (2018), the limit of detection (LOD) and lower limit of quantitation (LLOQ) for all the metal contaminants analyzed in this present research were mathematically calculated.
In triplicates, the percentage recoveries of metal contaminants from the shrimps were investigated. Standard solutions containing As, Pb, Cd and total Hg were used to spike the sample of 0.5 g shrimps individually. Prior to the analysis of metal contaminants, the samples were digested using microwave digestion method as described earlier. Upon completion, the spiked samples were transferred into separate calibrated volumetric flasks and further diluted with deionized water to the mark. The percentage recovery of each of the metal contaminant analyzed was calculated.
As for the quality control samples for evaluating the percentage recoveries as well as the intra and inter-day precision and accuracy, three concentrations (the middle and highest in the calibration curve) of the investigated individual metal contaminants were prepared as calibrators. For determining the intra-day precision and accuracy, the data from a non-consecutive day (n = 6 for each concentration) were analyzed. As for inter-day precision and accuracy, the determination was made by comparing the data among the three consecutive day runs (n = 18 for each concentration). The accuracy and precision were expressed as the percent deviation from the nominal values and the percent variance of coefficient, respectively (Mc Naught and Wilkinson, 2012).
2.5 Analysis of chloramphenicol
Determination of chloramphenicol for all samples was conducted by a certified (MS ISO/IEC 17025:2017) commercial laboratory in Johor Bahru using an in-house developed Direct Competitive enzyme-linked immunosorbent assay (ELISA) method (MY/STP/119). The obtained results were then compared among the different supply chain stages.
2.6 Statistical analysis
The data were analyzed using the UTM licensed IBM Statistical Package for Social Sciences (SPSS) version 27.0. Since the data violated the assumption of normality, inferential statistic was done using the non-parametric Kruskal-Wallis H and Mann-Whittney U tests. Mann-Whitney U test was used individually for comparing the concentrations of metal contaminants in shrimps sampled between the two landing sites (Mersing and Pontian) as well as the two major markets A and B. As for comparing the concentrations of metal contaminants in shrimps sampled among the major markets and their surrounding grocers (2 km radius), Kruskal-Wallis H was used. Since no significant differences were observed between the major markets and their surrounding grocers, pairwise comparison using Mann-Whittney U test was not attempted. However, pairwise comparison using Mann-Whittney U test was performed following the statistically significant differences detected by Kruskal-Wallis H while comparing the concentrations of the metal contaminants across the six different sampling intervals. Level of significance of 0.05 (α < 0.05) was utilized for determining the significant differences among groups.
2.7 Estimation of daily intake of metal contaminants and health risk assessment
Using Equation (1) as suggested by Song et al. (2009), the Estimated Daily Intake (EDI) values for the selected metal contaminants (i.e. As, Pb, Cd and total Hg) in shrimp samples evaluated here were compared with the provisional tolerable daily intakes (PTDI) suggested by the relevant authorities.
While the EDI refers to an adult daily intake of a metal contaminant via consumption of L. vannamei/P. silasi (in μg/g/day), Cmetal is the concentration of a metal contaminant analyzed in such shrimps (in μg/g, wet weight), Wshrimps being the daily consumption of L. vannamei/P. silasi (in g/day), and Bw represents the body weight of an adult (in kg). Wshrimps was estimated from the data reported by Ministry of Health (MOH, 2008) i.e. 3 g/day and 9 g/day for average consumers (AC) and high consumers (HC), respectively. The average body weight of an adult for Malaysians Bw was reported to be 63 kg (Dee et al., 2019).The results obtained here were used for assessing the risk of metal contaminants through the consumption of L. vannamei/P. silasi. Therefore, the target hazard was calculated based on the US EPA Region III risk-based concentration table (US EPA, 2020) (Eq. (2)):
The exposure frequency (EFr) is 350 days/ year, ED, Wshrimps and Cimetal are the exposure duration (70 years), daily consumption of L. vannamei/P. silasi (in g/day) and the individual concentration of metal contaminants in L. vannamei/P. silasi (in μg/g, wet weight), respectively. In addition, RfD refers to the oral reference dose (in μg/g/day) (US EPA, 2020), Bw is the average body weight of a Malaysian adult (63 kg) and ATn being the average exposure time for no carcinogens (ED × 365 days/year).
Because the RfD value for Pb remains unreported, there is no proof of a limit below which Pb may be permitted as non-harmful (U.S. EPA, 2004). Therefore, the equation recommended by Jović and Stanković, (2014), was used to calculate THQ for Pb as detailed below:
While THQi refers to the target hazard quotient of an individual metal contaminant, HI is the total hazard index for all the four metal contaminants analyzed here viz. As, Pb, Cd, and total Hg with the n value of 4.
3 Results and discussion
3.1 Method validation
Table 2 (a) represents the analytical figures of merit (calibration curve, LOD and LLOQ) for the analysis of As, Pb, Cd and total Hg in L. vannamei and P. silasi samples. The calibration curves for all the four metal contaminants had the R2 values of at least 0.995 with the RSD of<10 %, and hence complied fully with the prescribed criteria for accepting a calibration curve, as suggested by US FDA (2018). The LOD (signal/noise ratio 3:1) and LLOQ (signal/noise ratio 5:1) for all the analytes were calculated using the data from accepted calibration curves, ranging from 0.69 to 10.20 µg/kg and 1.04–15.44 µg/kg, respectively. From the three days of validation period, an average of R2 ≥ 0.995 for the calibration curves was attained over the ranges of 10–100 µg/kg for As and Pb, 1–10 µg/kg for total Hg, and 1–4 µg/kg for Cd (Table 2 a). Taking into account that the concentrations of metal contaminants in shrimps sampled from the various sampling sites during the six sampling intervals would vary substantially, the wide linear ranges of analytical method were considered. Precision was expressed as percent coefficient of variation and accuracy as the percent difference from the nominal values.
(a) Calibration curves, LOD and LLOQ.
Metal contaminants
As
Pb
Cd
Total Hg
Calibration curve range
10–100 µg/kg
10–100 µg/kg
1–4 µg/kg
1–10 µg/kg
R2
0.998
0.998
0.997
0.998
Equation
0.0014x + 0.0033
0.0018x + 0.0061
0.0305x + 0.0094
0.0181x + 0.0013
LOD (µg/kg)
10.20
6.68
0.69
0.69
LLOQ (µg/kg)
15.44
10.12
1.04
1.04
(b) Intra and inter-day accuracy and precision as well as percentage recovery.
Analyte
Nominal conc. (µg/kg)
Intra day
Inter day
Observed conc.
Accuracy (%)
Precision (%)
Observed conc.
Accuracy (%)
Precision (%)
Recovery (%)
As
50
47.22 ± 0.69
5.56
1.47
48.99 ± 1.65
2.02
3.36
98.69
75
74.37 ± 0.06
0.84
0.09
73.96 ± 0.73
1.39
0.99
96.34
Pb
50
49.30 ± 0.30
1.40
0.61
49.61 ± 0.50
0.98
1.00
89.10
75
68.46 ± 0.63
8.72
0.91
72.48 ± 3.53
1.29
4.87
90.01
Cd
2
2.00 ± 0.00
0.15
0.21
1.96 ± 0.04
1.87
1.87
109.32
3
2.89 ± 0.03
3.67
1.00
2.91 ± 0.04
1.53
1.53
105.06
Total Hg
2
1.96 ± 0.05
2.07
2.37
2.19 ± 0.05
9.40
2.08
111.30
5
5.53 ± 0.13
10.50
2.32
5.23 ± 0.3
4.60
5.70
105.88
In this research, precision was expressed as percent coefficient of variation and accuracy as the percent difference from the nominal values, and the data are presented in Table 2 (b). It was observed that the intra-day precision (0.09–2.37 %) and accuracy (0.15–10.50 %) for the four metal contaminants were<10 %, except for the upper limit calibrator of 5 µg/kg for total Hg (10.50 %). As for the inter-day precision (0.99–5.70 %) and accuracy (0.98–9.40 %) for the metal contaminants, the values were<10 %. Considering the indications made by the US FDA, (2018) that for accepting the precision and accuracy the values must not exceed 20 % for bioanalytical validation, the values reported here fell well within the prescribed range. Moreover, the validation results also revealed that the percentage recoveries for all the four metal contaminants ranged between 89.10 and 111.30 %, and therefore, complied fully with the range of percentage recoveries (80 – 120 %) prescribed by the prevailing guideline AOAC (2016). Having considered that all the data of analytical figures of merit and validation parameters complied with the prescribed guidelines, it can be construed that the analytical methods utilized here appear robust, accurate and reliable for analyzing the metal contaminants in L. vannamei and P. silasi shrimps.
3.2 Analysis of metal contaminants
This present research investigated the concentrations of metal contaminants (viz. As, Pb, Cd and total Hg) in shrimps sampled from the two major landing sites in Johor (viz. Mersing and Pontian), as well as the two major markets (A and B) and their surrounding grocers at six different sampling intervals in Johor Bahru, Johor, Malaysia. Table 3 represents the comparison of metal contaminant concentrations in shrimps between the Mersing and Pontian landing sites as well as the two major markets (A and B) in Johor Bahru. Since the data violated the assumption of normality, they are presented as median (range) and tested using the non-parametric Mann-Whitney U test. bdl: below detection limit. The data are presented as median (range), and analyzed using the Mann-Whitney U test for comparing the concentrations of metal contaminants in shrimps sampled between the two landing sites (Mersing and Pontian) as well as the two major markets A and B in Johor Bahru. Significantly higher concentrations of As, Cd, and total Hg were observed in shrimps sampled from the landing site Mersing when compared with that of Pontian (S). Significantly higher concentrations of metal contaminants were also observed between the individual landing sites with those of the nearby major markets (‡). As for comparing the two markets A and B, significant differences in the concentrations of metal contaminants in shrimps were not observed. Level of significance of 0.05 was used for assigning significant differences.
Sampling sites
Metal contaminants [Maximum Permitted Proportion]
Landing site-Mersing
Landing site-Pontian
Major market A (closer to Mersing)
Major market B (closer to pontian)
As
[1.00 mg/kg]
52.64S ‡
(5.27–167.60)
32.72 ‡
(1.61–49.99)0.46
(0.11–3.00)0.87
(0.16–3.55)
Pb
[1.00 mg/kg]bdl
(bdl)bdl
(bdl)bdl
(bdl)bdl
(bdl)
Cd
[1.00 mg/kg]
0.21S ‡
(0.08–0.46)
0.08 ‡
(0.02–0.38)0.02
(bdl − 0.20)0.02
(0.01–0.20)
Total Hg
[0.50 mg/kg]
0.50 ‡
(0.22–1.00)
0.19 ‡
(0.06–1.20)0.04
(0.02–1.00)0.03
(0.02–0.07)
Significantly higher median concentrations of As (52.64 mg/kg), Cd (0.21 mg/kg), and total Hg (0.50 mg/kg) were observed for shrimp samples from the landing site of Mersing when compared with that of Pontian (As: 32.72 mg/kg; Cd: 0.08 mg/kg; total Hg: 0.19 mg/kg) (P < 0.05). Considering the relative proximity of the landing site of Mersing and major market A (≈ 122 km) as well as Pontian and major market B (≈ 42.5 km), a suitable comparison of metal contaminant concentrations was made. It was observed that significantly higher concentrations of metal contaminants were present in shrimps sampled from both of the landing sites (P < 0.05) when compared with those of the major markets A (As: 0.46 mg/kg; Cd: 0.02 mg/kg; total Hg: 0.04 mg/kg) and B (As: 0.87 mg/kg; Cd: 0.02 mg/kg; total Hg: 0.03 mg/kg), correspondingly. Notwithstanding, statistical comparison between the concentrations of metal contaminants in shrimps sampled from major markets A and B did not reveal any significant differences (P > 0.05).
Using the non-parametric Kruskal-Wallis H test, comparisons between the concentrations of metal contaminants in shrimps sampled at the major markets A and B with their surrounding grocers (within 2 km radius from each major market) were made and the data are presented in Tables 4 and 5. Since no significant difference in the concentrations of metal contaminants in shrimps between the major market A and its surrounding four grocers was observed (Table 4, P > 0.05), pairwise comparison was not performed. The same finding also prevailed for the comparison made between major market B and its surrounding grocers (Table 5, P > 0.05). Because no significant differences were observed, the proposition that the shrimps available in the surrounding grocers may originate from their respective nearby major markets, appears to be supported. bdl: below detection limit. The data are presented as median (range), and analyzed using the Kruskal-Wallis H for comparing the concentrations of metal contaminants in shrimps sampled among the major market and the surrounding grocers (2 km radius). No significant differences in the concentrations of metal contaminants in shrimps were observed, and hence pairwise comparisons using Mann-Whittney U test were not attempted. Level of significance of 0.05 was used for assigning significant differences. bdl: below detection limit. The data are presented as median (range), and analyzed using the Kruskal-Wallis H for comparing the concentrations of metal contaminants in shrimps sampled among the major market and the surrounding grocers (2 km radius). No significant differences in the concentrations of metal contaminants in shrimps were observed, and hence pairwise comparisons using Mann-Whittney U test were not attempted. Level of significance of 0.05 was used for assigning significant differences.
Metal contaminants [Maximum Permitted Proportion]
Sampling sites
Major Market A (closer to Mersing)
Grocer A1
Grocer A2
Grocer A3
Grocer A4
As
[1.00 mg/kg]0.46
(0.11–3.00)0.62
(bdl – 3.90)0.59
(0.20–1.33)0.70
(0.32–4.27)0.64
(bdl – 3.66)
Pb
[1.00 mg/kg]bdl
(bdl)bdl
(bdl)bdl
(bdl)bdl
(bdl)bdl
(bdl)
Cd
[1.00 mg/kg]0.02
(bdl − 0.20)0.01
(bdl – 0.10)0.02
(0.01–0.05)0.01
(bdl – 0.04)0.02
(bdl – 0.03)
Total Hg
[0.50 mg/kg]0.04
(0.02–1.00)0.05
(0.04–0.07)0.04
(0.02–0.06)0.05
(0.02–0.10)0.04
(0.02–0.05)
Metal contaminants [Maximum Permitted Proportion]
Sampling sites
Major Market B (closer to Pontian)
Grocer B1
Grocer B2
Grocer B3
Grocer B4
As
[1.00 mg/kg]0.87
(0.16–3.55)1.32
(bdl – 2.67)0.30
(bdl – 2.54)0.72
(0.20–3.59)0.95
(0.31–1.93)
Pb
[1.00 mg/kg]bdl
(bdl)bdl
(bdl)bdl
(bdl)bdl
(bdl)bdl
(bdl)
Cd
[1.00 mg/kg]0.02
(0.01–0.20)0.02
(0.01–0.03)0.01
(bdl – 0.07)0.01
(bdl – 0.07)0.02
(bdl – 0.06)
Total Hg
[0.50 mg/kg]0.03
(0.02–0.07)0.04
(0.02–0.05)0.04
(0.03–0.09)0.03
(0.02–0.10)0.03
(0.02–0.06)
For comparing the concentrations of As, Cd and total Hg across the six sampling intervals from all the sampling sites (Figs. 1–3), Kruskal-Wallis H with pairwise comparison using Mann Whittney U test was used. Results revealed significant differences in the concentrations of these three metal contaminants across the six sampling intervals (Figs. 1–3, P < 0.05). Considering that review of literature does not reveal any specific study focusing on the variations of metal contaminants in shrimps over varying sampling intervals, an exact comparison could not be made. However, a previous study on P. viridis mussels conducted in Malaysia (Mahat et al., 2018) reported significant differences in the concentrations of the same metal contaminants among the 3 months of their sampling period. The authors attributed such variations to the temporal changes at the harvesting site due to extensive industrial and seaport activities.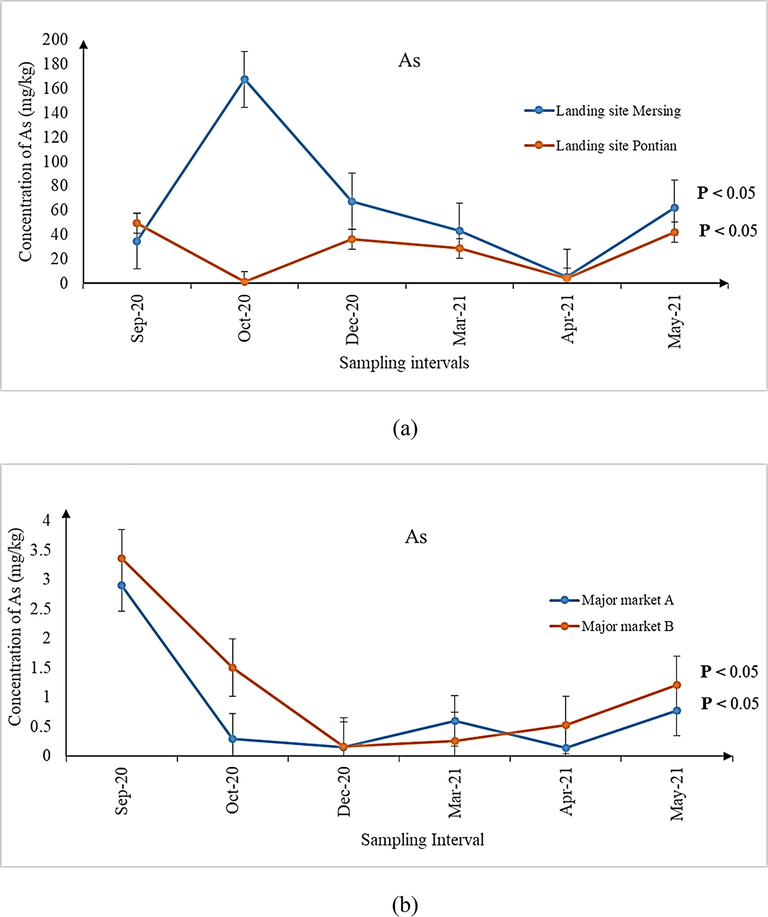
(a-d) Concentration of As in shrimps sampled from (a) landing sites, (b) major markets A and B, as well as (c) grocers surrounding major markets A and (d) B during the six sampling intervals. Significant differences (P < 0.05) in concentrations of As were observed for all the six sampling intervals from all the sampling sites.
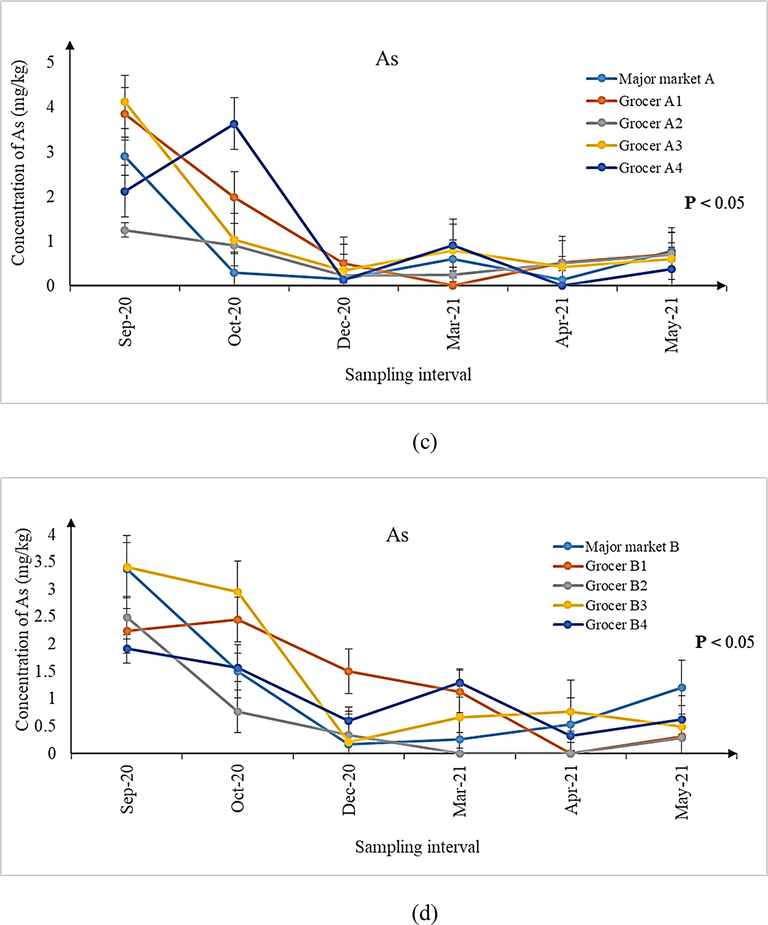
(a-d) Concentration of As in shrimps sampled from (a) landing sites, (b) major markets A and B, as well as (c) grocers surrounding major markets A and (d) B during the six sampling intervals. Significant differences (P < 0.05) in concentrations of As were observed for all the six sampling intervals from all the sampling sites.
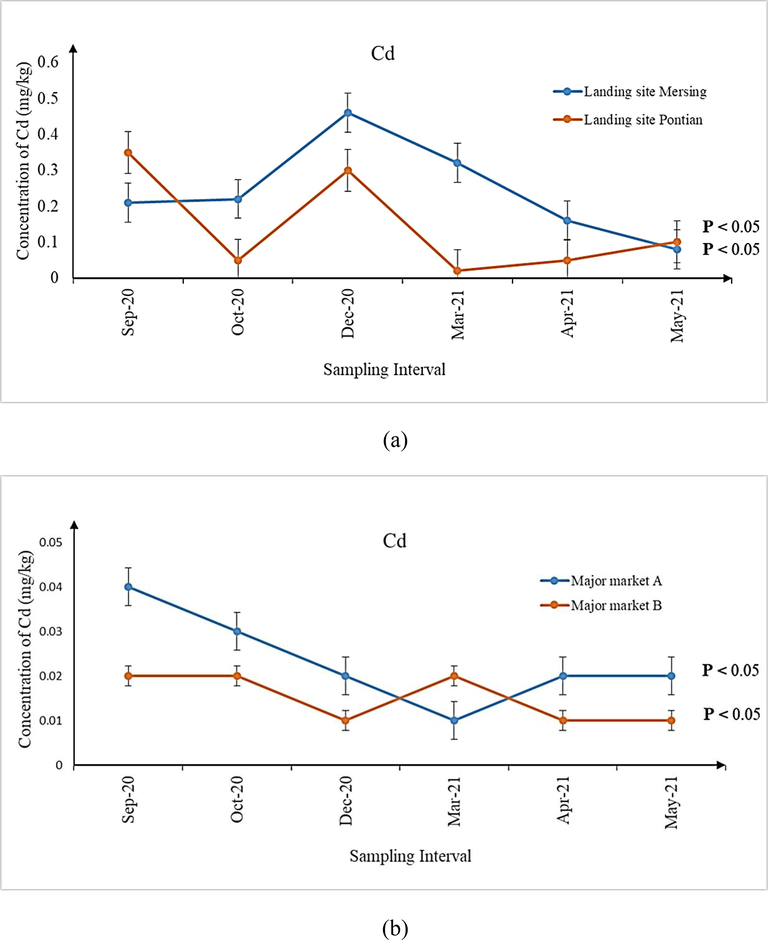
(a-d) Concentration of Cd in shrimps sampled from (a) landing sites, (b) major markets A and B, as well as (c) grocers surrounding major markets A and (d) B during the six sampling intervals. Significant differences (P < 0.05) in concentrations of Cd were observed for all the six sampling intervals from all the sampling sites.
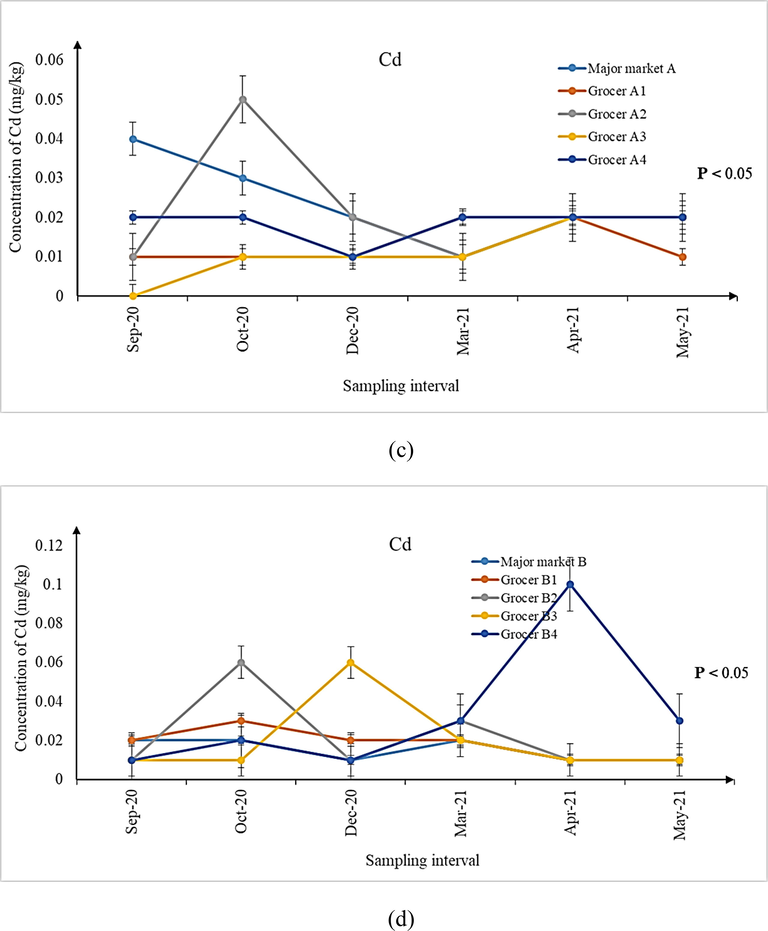
(a-d) Concentration of Cd in shrimps sampled from (a) landing sites, (b) major markets A and B, as well as (c) grocers surrounding major markets A and (d) B during the six sampling intervals. Significant differences (P < 0.05) in concentrations of Cd were observed for all the six sampling intervals from all the sampling sites.
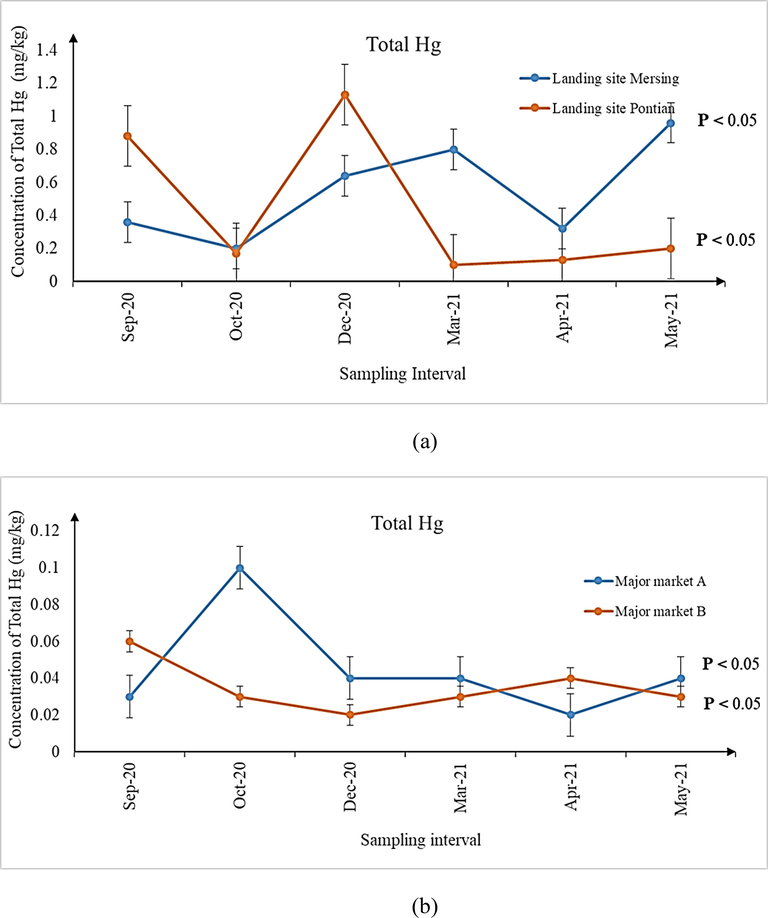
(a-d) Concentration of total Hg in shrimps sampled from (a) landing sites, (b) major markets A and B, as well as (c) grocers surrounding major markets A and (d) B during the six sampling intervals. Significant differences (P < 0.05) in concentrations of total Hg were observed for all the six sampling intervals from all the sampling sites.
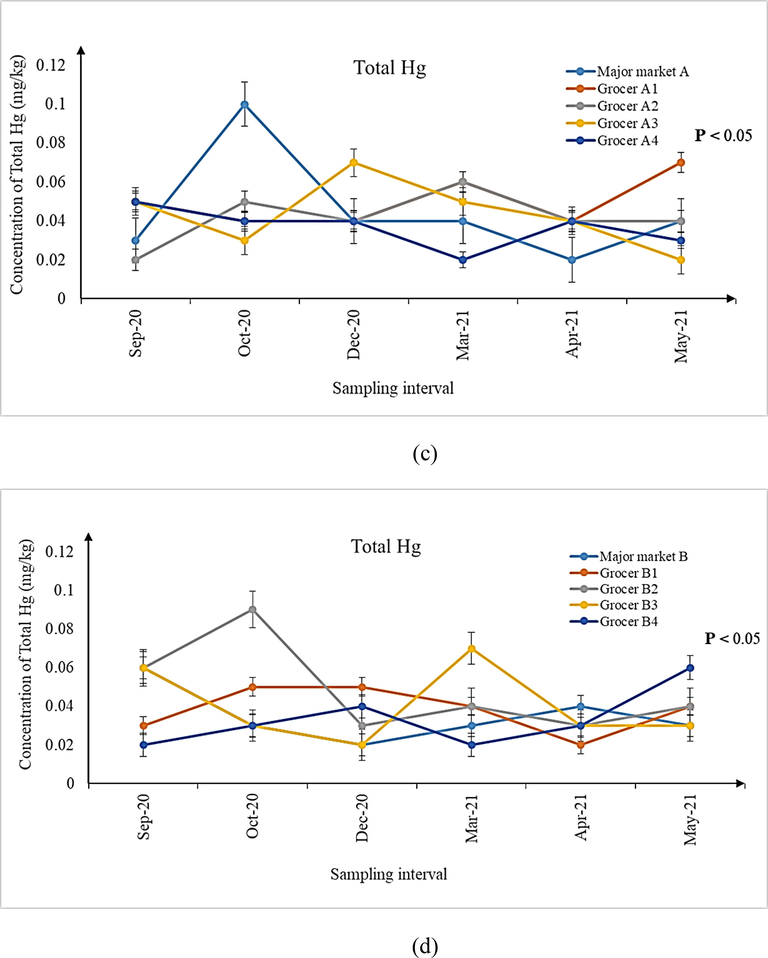
(a-d) Concentration of total Hg in shrimps sampled from (a) landing sites, (b) major markets A and B, as well as (c) grocers surrounding major markets A and (d) B during the six sampling intervals. Significant differences (P < 0.05) in concentrations of total Hg were observed for all the six sampling intervals from all the sampling sites.
It is imperative to mention here that although the median concentrations for metal contaminants observed in samples from all the sampling sites may be lower than the MPPs (As, Pb and Cd: 1.00 mg/kg; total Hg: 0.50 mg/kg) prescribed by the Malaysian Food Act (1983) and Regulations (2021), the ranges of the individual concentrations were higher during several sampling intervals (Tables 3–5). Except for Cd, the ranges of As and total Hg expanded beyond the prescribed MPPs and therefore, investigating its possible detrimental health implications for consuming the shrimps is a matter of public health significance. A similar indication has also been made by previous researchers whom investigated the parallel issue following the ingestion of Perna viridis mussels in Johor Bahru, Johor, Malaysia (Mahat et al., 2018). In this context, many authors have attributed the presence of metal contaminants in the aquatic organisms to the natural and anthropogenic sources, leading to their bioaccumulation and biomagnification in the organisms (Mahat et al., 2018; Ali et al., 2021). Since the areas surrounding Pontian, parts of Malacca and Mersing are undergoing rapid development and land reclamation (Wang et al., 2019) as well as being the routes of shipment, contamination of metal contaminants in aquatic organisms like shrimps is within expectation. Moreover, seepage of minerals and metals from geographical processes (Briffa et al., 2020) may also add to the quantum of metal contaminants observed in the shrimps. As for Pb, it was non-detectable in any of the shrimp samples from all the sampling sites. Hence, further studies to explain this observation may be required.
An interesting fact discovered in this present research was that, significantly varying concentrations of metal contaminants were observed between the shrimps collected from the two landing sites (Mersing and Pontian) with those of major markets A and B as well as their surrounding grocers nearby Johor Bahru. Such a situation has triggered further exploration to ascertain if the shrimps are of the different species although they may look similar. The taxonomic and molecular identifications of the shrimps sampled from all the sampling sites revealed the presence of two different species namely P. silasi (false white shrimp) and L. vannamei (white shrimp). P. silasi was the only species of ‘white shrimps’ available during sampling at both the Mersing and Pontian landing sites. On the other hand, L. vannamei was the one found in major markets A and B as well as their surrounding grocers. As such, it can be construed that the shrimps harvested from the ocean nearby Mersing and Pontian may not be the one contributing to the supply chain of shrimps sold in major markets A and B and their surrounding grocers in Johor Bahru, as investigated during the course of six different sampling intervals of this present research.
Fascinatingly, a few studies in Malaysia concluded that the consumption of shrimps from local markets and the coastal areas in Peninsular Malaysia as safe (Anandkumar et al., 2017) with no non-carcinogenic risk (Yap et al., 2019) and ‘does not pose a health risk to the consumers’ (Rajan and Ishak, 2017). However, the conclusions made by these authors can be considered as pre-matured and erroneous, considering the limitations of their studies. The limitations are the exclusion of As and Hg from the analyses (Yap et al., 2019), insufficient description of the sampling process and locations of study (Rajan and Ishak, 2017), outdated data (collected in 2007 but published in 2019) (Yap et al., 2019), as well as the absence of analytical validation data (Rajan and Ishak, 2017). In view of these limitations and because medium to long-term study investigating all the four metal contaminants in shrimps at various supply chain stages in Malaysia remains unreported, this present research that factored all these pertinent aspects in P. silasi and L. vannamei shrimps sampled in Johor merits scientific considerations.
3.3 Health risk assessment
Considering that metal contaminants in shrimps may cause detrimental human health implications, even at concentrations lower than that of prescribed MPPs following chronic exposure, health risk assessment parameters (EDI, THQ and HI) were calculated. While Table S1 represents the EDI of As, Cd, and total Hg by consuming the shrimps sampled during six sampling intervals, Table 6 depicts the associated THQ and HI values, respectively. Results revealed high EDI values for As in shrimps sampled from landing sites Mersing (0.920–29.130 μg/kg/day) and Pontian (0.290–8.480 μg/kg/day) when compared with that of PTDI value (3.570 μg/kg/ day) suggested by JECFA (1999), JECFA (2003). NA: unavailable data. Values in bold represent the values of THQ and/or HI that exceeded 1.00. THQ > 1: may ‘experience obvious deleterious effects’, the probability of having greater hazard risk. HI > 1: Occurrence of non- cancer human health impact is expected.
Sampling sites
Target hazard quotient (THQs)
Hazard index
As
Pb
Cd
Hg
AC
HC
AC
HC
AC
HC
AC
HC
Landing site-Mersing
0.97–30.72
2.92–92.15
NA
NA
0.00–0.03
0.01–0.08
0.01–0.05
0.03–0.16
3.00–92.22
Major market A
0.03–0.53
0.08–1.60
NA
NA
0.00–0.00
0.00–0.01
0.00–0.01
0.00–0.02
0.10–1.61
Grocer A1
0.00–0.71
0.00–2.12
NA
NA
0.00–0.00
0.00–0.00
0.00–0.00
0.01–0.01
0.01–2.13
Grocer A2
0.04–0.23
0.13–0.69
NA
NA
0.00–0.00
0.00–0.01
0.00–0.00
0.00–0.01
0.14–0.69
Grocer A3
0.06–0.76
0.19–2.27
NA
NA
0.00–0.00
0.00–0.00
0.00–0.00
0.00–0.01
0.20–2.27
Grocer A4
0.00–0.67
0.00–2.00
NA
NA
0.00–0.00
0.00–0.00
0.00–0.00
0.00–0.01
0.01–2.01
Landing site-Pontian
0.30–9.08
0.90–27.23
NA
NA
0.00–0.02
0.00–0.06
0.01–0.06
0.03–0.19
0.94–27.43
Major market B
0.03–0.62
0.09–1.85
NA
NA
0.00–0.00
0.00–0.00
0.00–0.00
0.00–0.01
0.10–1.86
Grocer B1
0.00–0.45
0.00–1.35
NA
NA
0.00–0.00
0.00–0.01
0.00–0.00
0.00–0.01
0.00–1.36
Grocer B2
0.00–0.46
0.00–1.36
NA
NA
0.00–0.00
0.00–0.01
0.00–0.00
0.00–0.02
0.01–1.38
Grocer B3
0.04–0.63
0.12–1.88
NA
NA
0.00–0.00
0.00–0.01
0.00–0.00
0.00–0.01
0.13–1.89
Grocer B4
0.06–0.35
0.18–1.05
NA
NA
0.00–0.01
0.00–0.02
0.00–0.00
0.00–0.01
0.20–1.06
As for the other sampling sites, the EDI values for As and other metal contaminants were evidently lower than the suggested PTDI values (Table S1). The fact that previous health risk assessment studies on shrimps in Malaysia (Anandkumar et al., 2017; Lee et al., 2017; Rajan & Ishak, 2017; Anual et al., 2018; Yap et al., 2019) did not include As, suitable comparison with the EDI values of As reported here with the literature could not be attempted. The EDI values for Cd and total Hg observed in this present research ranged between not available to 0.079 μg/kg/ day and 0.002 to 0.163 μg/kg/ day, respectively (Table S1). While the EDI values for Cd was within the range of 0.05–0.15 ug/kg bw/day reported by previous researchers in Selangor (Rajan and Ishak, 2017), the EDI for total Hg (0.228 μg/kg/ day) can be made out as higher than the Estimated Weekly Intake of 0.368 μg/kg bw reported by Anual et al., (2018) in Perak and Selangor.
Except for shrimps consumed from grocer A2, the calculated THQs for As for HC exceeded 1.00 for all the sampling sites. The highest ranges of THQs for HC were observed in shrimps from the landing sites Mersing (2.92–92.15) and Pontian (0.90–27.23), followed by the remaining sampling sites of major markets and their surrounding grocers. On the other hand, the ranges of THQs for AC exceeded 1.00 only for shrimps from the landing sites Mersing (0.97–30.72) and Pontian (0.30–9.08) alone (Table 6). THQ refers to the ratio of consumed dose of metal contaminant via oral ingestion and can be useful for evaluating such intake of metal contaminant from contaminated food (Mahat et al., 2018; Ali et al., 2022). The fact that the ranges of THQ (especially for those of HC) were higher than 1.00, the possibility of human population exposed to such contaminated shrimp may ‘experience deleterious effects’ cannot be excluded.
Moreover, assessment of the HI value is important to consider the combinatory influence of multiple metal contaminants that occur in aquaculture products (like shrimps). The index would throw light at explaining the risk of having non-cancer health impacts following the ingestion of contaminated food (Mahat et al., 2018). Results revealed that the ranges of HI exceeded 1.00 in all the samples, except for grocer A2, and expectedly, the highest HI ranges were evident in shrimps sampled from the landing sites Mersing (3.00–92.22) and Pontian (0.94–27.43) (Table 6). Since the ranges of HI reported here exceeded the prescribed cut-off value of 1.00, the fact that populations exposed to such contaminated shrimps may be at risk for developing non-cancer health impacts is an alarming matter of public health consideration. Interestingly, there are several studies on shrimps in Malaysia that reported the THQ and HI values of<1.00, indicating that the shrimps are safe for human consumption (Rajan and Ishak, 2017; Yap et al., 2019). However, oddly these studies did not evaluate the complete list of metal contaminants in shrimp (viz. As, Pb, Cd and total Hg) as listed in the Malaysian Food Act (1983) and Regulations (2021). Hence, the inference that they made may be impractical for making any suitable public health decision.
3.4 Analysis of chloramphenicol
Analysis of chloramphenicol was performed by a certified private laboratory using the in-house method of ELISA with the LOD of 0.03 ppb. Results did not reveal any detectable amount of chloramphenicol in any of the samples of shrimps from the landing sites Mersing and Pontian (P. silasi) as well as major markets A and B and their surrounding grocers (L. vannamei). It is acknowledged that broad-spectrum antibiotics (like chloramphenicol) are illegally used in aquaculture (Suseno et al., 2016), and their prolonged exposure in human can be carcinogenic as well as deleterious to various body systems (Chen et al., 2020). Due to such unwanted adverse effects, many countries have banned aquaculture products that contain these antibiotics. Similarly, the Malaysian law has specified that chloramphenicol shall not be present in any seafood products mean for human consumption (Food Act (1983) and Regulations (2021)).
In this context it is pertinent to mention here that shrimp exporters from Malaysia have been put on the red list of the US FDA since 2018 due to detectable amount of chloramphenicol in the consignments (Malay Mail, 2020, January 4). Although the Malaysian fishery authority had responded by indicating the possibility of transshipment element that can be the reason for such contaminated consignments (DOF, 2020), no empirical proof was provided. Element of transshipment refers to importation of shrimps without the official surveillance of DOF and exporting them to other countries (DOF, 2020).To address such an important issue, adequate sampling involving the different stages of supply chain proves necessary. Therefore, the non-detectable results of chloramphenicol in this present study that sampled shrimps sold at various supply chain stages (landing sites, major markets, and surrounding grocers) in Johor Bahru appear to support the proposition of the existence of transshipment element, as advocated by the relevant authority.
Another important aspect to consider is the bacterial cross-resistance, attributable to the chemical interaction between the toxic heavy metals with antibiotics like chloramphenicol, suggesting the pivotal role of the interaction in environments where metal and antibiotic are co-existing (Chen et al. 2015). In this context, mutation in genes encoding antibiotic resistance induced by the presence of toxic heavy metals like arsenate (an arsenic species) could be the possible explanation (Knapp et al. 2011), and hence, further studies to elucidate this aspect proves necessary.
4 Conclusion
Although chloramphenicol and Pb were not detected, significantly higher concentrations of As and total Hg were observed in P. silasi sampled from the landing sites Mersing and Pontian when compared with that of L. vannamei from major markets A and B as well as their surrounding grocers (P < 0.05). Significant differences in the concentrations of metal contaminants over several varying sampling intervals were also observed. For As and total Hg, their concentrations appear to exceed the MPPs prescribed by the Malaysian law. The fact that the THQ and HI for HC exceeded the cut-off values of 1.00, the shrimps may not be safe for prolonged human consumption. This is a matter of importance that requires immediate remedial intervention, especially for developing suitable removal technologies prior to consumption. Considering the different species of ‘white shrimps’ observed at Mersing and Pontian landing sites (P. silasi) as well as their varying concentrations of metal contaminants when compared with the major markets and their surrounding grocers (L. vannamei), it is apparent that the shrimps sold at major markets and grocers in Johor Bahru are originating from the different sources than that of Mersing and Pontian landing sites. The fact that chloramphenicol was not detected in any of the samples, the proposition made by DOF (2020) regarding the transshipment element remains consistent with the overall findings of this present research. Further medium to long-term studies exploring shrimps sampled from the different aquaculture rearing sites may be required to affirm such a proposition. Nonetheless, this traceability study for shrimps at various stages of supply chain in Johor is deemed useful for strengthening the overall safety and security of our seafood industry.
5 Limitation
Firstly, samples of shrimps at the two seafood landing sites were collected without knowing the actual locations where they were harvested by the fishermen. As such, the association between the concentrations of metal contaminants in the shrimps at the landing sites with the extent of seawater pollution at the harvesting locations could not be made. This problem can be addressed by engaging specific fishermen that can potentially provide the required information as well as the seawater samples from the harvesting locations for analysis in future studies. Secondly, this present research only analysed the total elements of As, Pb, Cd and Hg, as specified in the Fourteenth Schedule of the Malaysian Food Act (1983) and Regulation (2021), as well as other international jurisdictions. Because these metal contaminants consist of varying species (e.g. arsenate, methylmercury, lead nitrate) that can be more toxic than the others, the determination of these toxic chemical species in shrimps may provide better insights in interpreting the toxicity for human consumption. Hence, improvements to the list of metal contaminants in the Malaysian Food Act (1983) and Regulation (2021), as well as other international jurisdictions appear timely.
Disclosure of Funding
This work was supported/funded by the Ministry of Higher Education under research grant the Malaysian Research University Network titled ‘Traceability of Food Safety Hazard and Critical Point along the Supply Chain of Seafood Industry in Malaysia, [UPM/800-4/11/MRUN/2019/5539160] (R.J130000.7851.4L868).
Acknowledgments
The authors wish to thank Dr. Mohd Fazrul Hisam bin Abd Aziz, Faculty of Fishery and Food Science, Universiti Malaysia Terengganu and all Centre of research laboratory (PPA) staffs at Universiti Teknologi Malaysia for their assistance throughout this research.
Declaration of Competing Interest
The authors declare that they have no known competing financial interests or personal relationships that could have appeared to influence the work reported in this paper.
References
- Occurrence of heavy metals and their removal in Perna viridis mussels using chemical methods: a review. Environ. Sci. Pollut. Res.. 2022;29(4):4803-4821.
- [CrossRef] [Google Scholar]
- Trace metal dynamics and risk assessment in the commercially important marine shrimp species collected from the Miri coast, Sarawak, East Malaysia. Reg. Stud. Mar. Sci.. 2017;16:79-88.
- [CrossRef] [Google Scholar]
- Mercury and risk assessment from consumption of crustaceans, cephalopods and fish from West Peninsular Malaysia. Microchem. J.. 2018;140(April):214-221.
- [CrossRef] [Google Scholar]
- AOAC, 2008. AOAC Official Method 999.10: Lead, Cadmium, Zinc, Cooper, and Iron in Foods. https://img.21food.cn/img/biaozhun/20100108/177/11285281.pdf (accessed 4 Dec 2021).
- AOAC, 2016. Guidelines for Standard Method Performance Requirements: AOAC International and Official Method of Analysis. http://www.eoma.aoac.org/app_f.pdf (accessed 29 Nov 2021).
- Heavy metal pollution in the environment and their toxicological effects on humans. Heliyon.. 2020;6(9):e04691.
- [CrossRef] [Google Scholar]
- Development of a multi-class method to determine nitroimidazoles, nitrofurans, pharmacologically active dyes and chloramphenicol in aquaculture products by liquid chromatography-tandem mass spectrometry. Food Chem.. 2020;311:125924.
- [CrossRef] [Google Scholar]
- Heavy metal induced antibiotic resistance in bacterium LSJC7. Int. J. Mol. Sci. 2015;16(10):23390-23404.
- [CrossRef] [Google Scholar]
- Health Risk Assessment of Heavy Metals from Smoked Corbicula fluminea Collected on Roadside Vendors at Kelantan. BioMed Res. Int.. 2019;2019:1-9.
- [CrossRef] [Google Scholar]
- DOF, 2020. Udang Ternakan Di Malaysia Selamat Dimakan. (Malaysia): Deparment of Fishery Malaysia. https://www.dof.gov.my/index.php/pages/view/3779 (accessed 22 Dec 2020).
- European Commission, 2021. Penaeus silasi. https://fish-commercial-names.ec.europa.eu/fish-names/species_en?sn=27771 (accessed 24 Nov 2021).
- Malaysian white shrimp (P. vannamei) aquaculture: An application of stochastic frontier analysis on technical efficiency. Int. Food Res J.. 2016;23(2):638-645.
- [Google Scholar]
- Nutritive value of cultured white leg shrimp Litopenaeus vannamei. Int. J. Fish Aquac.. 2013;5(7):166-171.
- [CrossRef] [Google Scholar]
- Joint FAO/WHO Expert Committee on Food Additives, JECFA (1999) Reports ofthe 53rd meeting ofthe joint FAO/WHO expert commit- tee on food additives (JECFA). In: JECFA/53/TRS. Rome, Italy.
- Joint FAO/WHO Expert Committee on Food Additives, JECFA (2003): Summary and conclusions of the 61st meeting of the joint FAO/ WHO expert committee on food additives (JECFA). JECFA/61/ SC; Rome, Italy.
- Human exposure to trace metals and possible public health risks via consumption of mussels Mytilus galloprovincialis from the Adriatic coastal area. Food Chem. Toxicol.. 2014;70:241-251.
- [CrossRef] [Google Scholar]
- Antibiotic resistance gene abundances correlate with metal and geochemical conditions in archived Scottish soils. PLoS ONE. 2011;6(11):e27300.
- [Google Scholar]
- Selected Heavy Metals in Penaeus vannamei (White Prawn) in Aquaculture Pond near Likas Lagoon, Sabah, Malaysia. Int. J. Environ. Sci. Technol.. 2017;8(7):530-533.
- [CrossRef] [Google Scholar]
- Toxic metals in Perna viridis mussel and surface seawater in Pasir Gudang coastal area, Malaysia, and its health implications. Environ. Sci. Pollut. Res.. 2018;25(30):30224-30235.
- [CrossRef] [Google Scholar]
- Malay mail, 2020. US food regulator bans Malaysian shrimp exporters over illegal antibiotics use. https://malaysia.news.yahoo.com/us-food-regulator-bans-malaysian-014207116.html (accessed 22 Dec 2020).
- Compendium of Chemical Terminology-Gold Book (2 ed.). Oxford, UK: Blackwell Scientific Publications; 2012.
- Investigating tissue bioconcentration and the behavioural effects of two pharmaceutical pollutants on sea trout (Salmo trutta) in the laboratory and field. Aquat. Toxicol.. 2019;207:170-178.
- [Google Scholar]
- MOH, 2008. Malaysian Adult Nutrition Survey. Nutrition Section,Family Health Development Division.
- Appraisal of toxic metals in water, bottom sediments and fish of fresh water lake. J. King Saud Univ. Sci.. 2022;34(1):101685.
- [Google Scholar]
- Quality and shelf life assessment of Pacific white shrimp (Litopenaeus vannamei) freshly harvested and stored on ice. Food Sci. Technol.. 2014;55(1):110-116.
- [CrossRef] [Google Scholar]
- Determination of toxic elements (mercury, cadmium, lead, tin and arsenic) in fish and shellfish samples. Risk assessment for the consumers. Environ. Int.. 2013;59:63-72.
- [CrossRef] [Google Scholar]
- Nutritional composition, fatty acids and cholesterol levels in Atlantic white shrimp (Litopenaeus schimitti) Int. Food Res J.. 2018;25(1):151-157.
- [Google Scholar]
- Heavy metal contamination of freshwater prawn (Macrobrachium rosenbergii) and prawn feed in Bangladesh: A market-based study to highlight probable health risks. Chemosphere.. 2017;170:282-289.
- [CrossRef] [Google Scholar]
- Estimation of target hazard quotients and potential health risks for metals by consumption of shrimp (Litopenaeus vannamei) in Selangor, Malaysia. Sains Malaysiana. 2017;46(10):1825-1830.
- [CrossRef] [Google Scholar]
- Assessing the health risk of heavy metals in vegetables to the general population in Beijing, China. J. Environ. Sci.. 2009;21(12):1702-1709.
- [CrossRef] [Google Scholar]
- Comparative studies on chemical composition and thermal properties of black tiger shrimp (Penaeus monodon) and white shrimp (Penaeus vannamei) meats. Food Chem.. 2007;103(4):1199-1207.
- [CrossRef] [Google Scholar]
- Elimination of Chloramphenicol by Tiger Shrimp (Penaeus monodon) and White Shrimp (Litopenaeus vannamei) Hayati.. 2016;23(3):117-120.
- [CrossRef] [Google Scholar]
- US EPA, 2004. Integrated Risk Information System: Lead. United States Environmental Protection Agency (EPA), 1–15.
- US EPA, 2010. Calibration Curves : Program Use / Needs. Available online: https://19january2017snapshot.epa.gov/sites/production/files/2014-05/documents/calibration-guide-ref-final-oct2010.pdf|. (accessed 2 December 2021)|.
- US EPA, 2020. Regional Screening Levels (RSLs). https://www.epa.gov/risk/regional-screening-levels-rsls-generic-tables. (accessed 5 December 2021)|
- US FDA, 2018. Bioanalytical Method Validation Guidance for Industry. https://www.fda.gov/files/drugs/published/Bioanalytical-Method-Validation-Guidance-for-Industry.pdf. (accessed 22 November 2021).
- Construction land sprawl and reclamation in the Johor River Estuary of Malaysia since 1973. Ocean. Coastal Manage.. 2019;171(August 2018):87-95.
- [CrossRef] [Google Scholar]
- World Health Organization Lead poisoning https://www.who.int/news-room/fact-sheets/detail/lead-poisoning-and-health 2021 Available online: accessed 21 November 2021)|.
- Health Risk Assessment of Heavy Metals in Prawn Penaeus merguiensis Collected in 2007 from Sri Serdang Market, Peninsular Malaysia. Act. Sci. Nutr. Health. 2019;3(8):109-113.
- [CrossRef] [Google Scholar]
Appendix A
Supplementary data
Supplementary data to this article can be found online at https://doi.org/10.1016/j.jksus.2022.102401.
Appendix A
Supplementary data
The following are the Supplementary data to this article:


