

Translate this page into:
Metabolomics and pathways analyses in traumatic brain injury animal model
⁎Corresponding authors. afaleh@ksu.edu.sa (Faleh Alqahtani), Aabdelrahman46@kfshrc.edu (Anas M. Abdel Rahman)
-
Received: ,
Accepted: ,
This article was originally published by Elsevier and was migrated to Scientific Scholar after the change of Publisher.
Abstract
Abstract
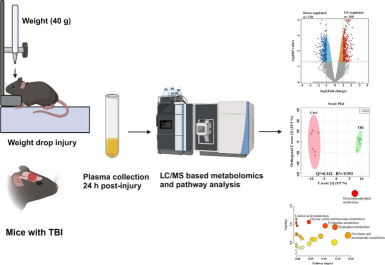
Traumatic brain injury (TBI), a progressive neurological disease caused by physical injury to the brain tissue, impacting its functions. This study employed metabolomics based on untargeted mass spectrometry method to examine plasma specimens from well-established mouse models with induced TBI (n = 6) and control mice (n = 6). The objective was to assess the metabolomics profile and the associated biochemical pathways in TBI. There was a noticeable segregation between TBI and reference groups (Q2 = 0.342, R2 = 0.993), according to orthogonal partial least square-discriminant analysis, indicating significant difference in metabolic expression. Moreover, 102 metabolites were significantly altered in TBI mice; 59 were upregulated, while 43 were downregulated in TBI mice. Correspondingly, the TBI model showed a significant dysregulation in number of key metabolic pathways, including metabolism of glycerophospholipids, linoleic acid, glycine, serine, threonine, pyrimidine, tryptophan, nicotinate and nicotinamide. Additionally, isoleucyl-asparagine, 2′-deoxyinosine triphosphate, diglycosyl diacylglycerols (25:0/26/2), and phosphatidylethanolamine (24:0/22:4) demonstrated excellent performance for TBI detection with an area under the curve ≥ 0.8. This study identified putative plasma biomarkers of TBI and highlighted the dysregulated biochemical pathways, providing valuable clinical insights into TBI research.
Keywords
Traumatic brain injury
Mass spectrometry
Metabolomics
Weight drop

1 Introduction
Traumatic brain injury (TBI), a complicated neural disease related to temporarily or permanently impaired brain functions (Abu Hamdeh et al., 2021). TBI affects individuals of all ages, and the risk for subsequent early-onset Alzheimer's disease, dementia, and tauopathies is increased (Crane et al., 2016; Gu et al., 2022). Moreover, morbidity and mortality rate of TBI is approximately 27 to 69 million incidents reported on an annual basis (James et al., 2019).
Recently, research in TBI has been gaining more attention due to TBI-associated long-term negative impacts on patients’ lives and the lack of accurate differential diagnostic approaches and effective pharmacological intervention (Bragge et al., 2016). The current clinical diagnostic tools, including the Glasgow Coma Scale (GCS) and Computer Tomography (CT) scan, could not represent the heterogeneous pathophysiology of the disease and cellular metabolic changes, thus challenging TBI diagnosis and therapeutic strategies (Bodien et al., 2021). In addition, the heterogeneity of TBI is a serious barrier to developing an optimal set of molecular biomarkers for diagnosis, monitoring, and prognosis (Vidhya et al., 2021). Moreover, the difficulty of obtaining steady TBI biological samples, such as brain tissue and cerebrospinal fluid (CSF), has limited our understanding of TBI's molecular mechanism and alterations.
Metabolomics is a comprehensive analytical technique for high-throughput qualification and quantification of a global metabolic profile of a disease progression. Omics-related research is emerging, and several studies have used this holistic analytical approach. In the case of TBI, especially in acute conditions, the metabolome reflects significant disruption and alteration in the biochemical homeostasis (Posti et al., 2017). In addition, several factors could affect the TBI progress and outcome in human including age, gender, genetic factors, patient’s health, medication, and severity of the primary injury. Therefore, in vivo, metabolomics-based research would provide a valuable homogenous brain injury model. The objective of the present research study was to use the targetless metabolomics approach to analyze TBI’s metabolic profile in mice models and underpinning putative pathways to discover potential biomarkers for diagnosing and TBI prognosis.
2 Materials and Methods
2.1 Animal model
This research project involved twelve male C57BL/6J mice (healthy), aged 6–10 weeks and 16–23 g in weight. These were sourced from the Animal Center at the College of Pharmacy, King Saud University. Standard conditions were maintained: 12hr. light/dark cycle, 25 °C temperature, and ad libitum feeding. These were split into groups of six: Group A (control) and Group B (TBI). For group B, weight-drop model was used to perform a TBI as earlier described (Sivandzade et al., 2020).
In summary, mice underwent an isoflurane vapor anesthesia prior to being positioned on soft platform under the weight-drop device. Brain trauma was induced by dropping 30 g of metal freely from a height of 80 cm at the center of head between the ears. Group A mice were anesthetized only without receiving a brain injury.
2.2 E**thical statement
The ethical approval was given by the Research Ethics Committee (REC) of King Saud University, Kingdom of Saudi Arabia (KSU-SE-23–65).
2.3 Samples collection and preparations
Twelve blood samples were taken from Group A (control) and Group B (TBI) (6 mice per group) within 24 h post-injury. Around 300 μl of plasma was processed within an hour. The samples were centrifuged and maintained for further use through storage (−80 °C). We isolated metabolites from the 12 samples of plasma following the protocol detailed in our earlier publication (Jaber et al., 2022). Plasma with concentration of 100 μl were combined to 50 % ACN of 900 μL in MeOH. The mixture was then thoroughly agitated for one hour on a thermomixer (Eppendorf, Germany) at a speed of 600 rpm and a temperature of 25 °C. Subsequently, the centrifugation of samples was done at 16000 rpm and 4 °C for ten minutes. The resultant supernatants were carefully transferred into Eppendorf tubes and dried utilizing a Speed-Vac (Christ, Germany). After drying, extracts were reconstituted in a solution of 50 % mobile phase A (0.1 % formic acid in water) and 50 % mobile phase B (0.1 % formic acid in 50 % ACN:MeOH mixture) before being investigated through LC-MS. Preparation of quality control (QC) samples through amalgamating equivalent quantities from all samples into a single vessel, which was then introduced to the instrument to assess system stability.
2.4 LC-MS metabolomic
Metabolic fingerprints were analyzed through the Waters ACQUITY UPLC system with a Xevo G2-S QTOF mass spectrometer complemented with an electrospray ionization source. The isolated metabolites underwent chromatographic separation via ACQUITY UPLC system with an XSelect column (100 × 2.1 mm, 2.5 μm) provided by Waters Ltd., Elstree, UK. The mobile phase consisted of 0.1 % formic acid in deionized water (solvent A), and 0.1 % formic acid in a 50 % acetonitrile: methanol mixture (solvent B). A gradient elution protocol was followed: 0–16 min at 95–5 % A, 16–19 min at 5 % A, 19–20 min at 5–95 % A, and 20–22 min at 5–95 % A, with 300 µL per minute flow rate. Mass spectrometry spectra were obtained in negative and positive electrospray ionization modes (ESI + and ESI-). The MS conditions were following: source temperature at 150 °C, desolvation temperature at 500 °C (ESI + ) or 140 °C (ESI − ). The capillary voltage was maintained at 3.20 kV (ESI + ) or 3 kV (ESI − ), with a cone voltage of 40 V. The desolvation gas flow rate was 800.0 L/h, and the cone gas flow rate was 50 L/h. In MSE mode, the collision energies for low and high functions were set to off and between 10 V and 50 V, respectively. The mass spectrometer was calibrated using sodium formate, covering a range of 100–1200 Da. Data was acquired in continuum mode using the Masslynx™ V4.1 workstation (Waters Inc., Milford, Massachusetts, USA).
2.5 Data and statistical analysis
Mass spectrometry records were assessed by means of pipeline standardization: alignment based on charge to mass ratio (e/m), retention time (RT), peak selection, and signal filtering with Progenesis QI 3.0 (Waters Technologies, Milford, MA, USA). Characteristics of approximately 50 % of samples were maintained for analysis. Data were analyzed through multivariate statistical test with MetaboAnalyst 5.0 (McGill University, Montreal, Canada, https://www.metaboanalyst.ca as of 14 July 2022) (Pang et al., 2021). To select accurate model of statistic, datasets underwent mean normalization, Pareto scaling, and transformation of log to ensure normal distribution. These processes created the model of partial least squares-discriminant analysis (PLS-DA) and orthogonal partial least squares-discriminant analysis (OPLS-DA). The models of OPLS-DA were assessed utilizing goodness of fit (R2Y) and predictive capability (Q2) metrics, validated by 100-sample permutation tests (Worley and Powers, 2013). Moreover, Mass Profiler Professional software (Agilent, Santa Clara, CA, USA) was used to perform univariate analysis. In addition, significance in altered features of mass were identified by using Volcano plots, with an uncorrected fold change (FC) threshold of 2 and a p-value of less than 0.05 (Aleidi et al., 2021a, 2021b; Gu et al., 2020). Pathway analysis and biomarkers associated with traumatic brain injury (TBI) were conducted. Also, the production of Receiver Operating Characteristic (ROC) curves were performed by utilizing the PLS-DA method in MetaboAnalyst version 5.0 for comprehensive global analysis for potential biomarkers identification.
2.6 Identification of metabolites
Core element in every dataset were carefully chosen and labelled using Progenesis QI v.3.0 software (Waters Technologies, Milford, MA, USA) for annotating peaks. Chemical structures of metabolite were accurately recognized through obtaining precise precursor masses, fragmentation patterns, and isotopic distributions, referencing Human Metabolome Database (HMDB).(Wishart et al., 2022), METLIN MS/MS (https://www.metlin.scripps.edu), Massbank, LipidMap, LipidBlast, and the Kyoto Encyclopedia of Genes and Genomes (KEGG). Exogenous compounds, including pharmaceuticals, nutritional additives, and environmental compounds, were omitted from final assembly.
3 Results
3.1 Metabolomics profiling in TBI-mice model
We identified 18,787 positive and 9,802 negative ionization modes, totaling 28,589 mass ion features. Due to missing values in over 80 % of samples, we focused on additional examination of 25,306 features (with 11.4 % missing values). The metabolomic pattern associated with TBI were assessed through orthogonal partial least squares-discriminant analysis (OPLS-DA) score plot test. Fig. 1A shows a clear-cut distinction in between the mice and TBI and the reference group (Q2 = 0.342, R2 = 0.993), indicating a statistical significance in metabolic expression between the groups.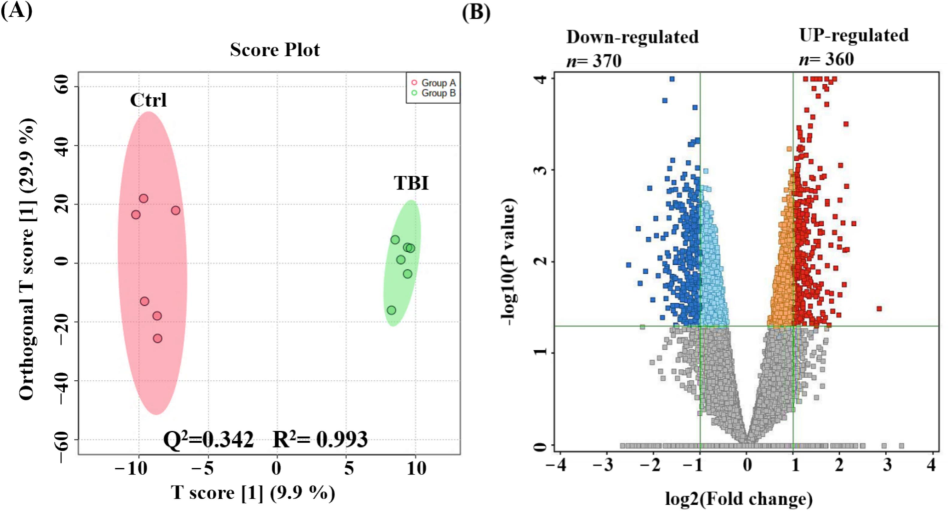
Metabolomics profiling of TBI mice model and reference groups. An orthogonal partial least squares-discriminant analysis (OPLS-DA) score plot demonstrating a clear segregation of the clusters between control (Ctrl) and TBI groups (Q2 = 0.342, R2 = 0.993) (A). A volcano plot demonstrated 730 metabolites of dysregulation, where 360 (upregulated), and 370 (downregulated) (Blue) metabolites were compared to reference group in TBI model (Cut-off: uncorrected p-value < 0.05, and FC 2) (B).
Comparison between TBI mice and reference group shows significant alterations in 730 metabolites: 360 were upregulated and 370 downregulated in TBI mice (uncorrected p-value < 0.05, FC 2), as depicted in Fig. 1B's volcano plot. Out of these, 389 metabolites were annotated using HMDB, Massbank, LipidMap, LipidBlast, KEGG, and METLIN MS/MS databases. Subsequently, removing exogenous molecules (drugs, metabolites of drug, chemical compounds), 102 metabolites were identified in mice and were kept for further analyses. Among these, 59 were upregulated and 43 downregulated in TBI mice compared to reference group. The upregulated and downregulated data can be found in Table 1 and 2 respectively.
Number
Compound name
Retention Time
Mass
p value
(B vs A)
FC
(B vs A)
Log FC
(B vs A)
1
(2R)-O-phospho-3-sulfolactic acid
0.71
294.95
0.00
2.08
1.06
2
11-Oxo-androsterone glucuronide
17.70
525.20
0.00
2.52
1.33
3
13-Oxocryptopine
3.40
811.26
0.01
2.88
1.53
4
1-Pyrrolidinecarboxaldehyde
3.96
197.13
0.02
2.17
1.12
5
2-aceto-2-hydroxy-butanoate
1.27
110.04
0.00
4.90
2.29
6
2′-Deoxyinosine triphosphate
0.91
528.93
0.00
3.50
1.81
7
3,3′,4,4′-Tetrachloroazobenzene
0.91
352.90
0.00
3.27
1.71
8
3,4-Dimethoxy-1,2-benzenedicarboxylic acid
1.72
136.01
0.04
2.36
1.24
9
3-Mercapto-2-butanone
0.88
267.07
0.00
2.96
1.56
10
3-Methoxy-4-Hydroxyphenylglycol sulfate
0.89
299.00
0.00
2.20
1.14
11
3-O-p-Coumaroylquinic acid
6.28
375.05
0.00
2.19
1.13
12
3-phospho-hydroxypyruvate
0.64
360.90
0.00
2.45
1.29
13
5,10-Pentadecadien-1-ol
13.47
269.21
0.00
2.03
1.02
14
5′-Hydroxypiroxicam
3.41
693.10
0.04
2.11
1.08
15
5-Megastigmen-7-yne-3,9-diol 3-glucoside
9.89
415.20
0.00
2.22
1.15
16
8-Acetoxypinoresinol
1.56
891.30
0.04
3.10
1.63
17
Achyranthoside C
5.86
1001.43
0.01
2.45
1.29
18
Aflatoxin G2a
3.40
737.13
0.00
2.21
1.14
19
Benzene-1,4-disulfonamide
0.91
270.96
0.00
2.67
1.42
20
Beta-Alanyl-CoA
3.41
873.12
0.01
2.12
1.08
21
beta-nicotinate D-ribonucleotide
3.92
397.04
0.03
2.00
1.00
22
Carbadox
2.07
307.04
0.01
2.49
1.31
23
CDP-DG(18:1(9Z)/22:6(4Z,7Z,10Z,13Z,16Z,19Z))
1.15
366.18
0.01
2.66
1.41
24
cis-3-Chloro-2-propene-1-ol
2.56
156.02
0.03
7.13
2.83
25
Cob(I)yrinate a,c diamide
3.41
973.32
0.02
2.55
1.35
26
Cytosine
4.69
332.12
0.00
2.29
1.19
27
Dehydrocarpaine II
16.11
511.29
0.01
2.02
1.02
28
DG(15:0/18:3(6Z,9Z,12Z)/0:0)
14.33
541.46
0.01
2.19
1.13
29
FMNH2
4.35
252.05
0.05
2.09
1.06
30
gamma-Glutamylvaline
1.95
283.07
0.00
2.50
1.32
31
Ganoderic acid alpha
14.39
1147.63
0.00
2.19
1.13
32
Glycitin
3.40
491.12
0.01
2.32
1.21
33
Glycolic acid
1.95
151.02
0.00
2.78
1.47
34
Hesperetin 7-neohesperidoside
17.70
655.16
0.02
2.20
1.14
35
Hydroxyprolyl-Methionine
3.96
297.07
0.00
4.02
2.01
36
Isolariciresinol, 9′-O-alpha-L-arabinofuranoside
2.56
269.09
0.04
3.91
1.97
37
Isoleucyl-Asparagine
1.52
282.09
0.00
2.76
1.47
38
Kaempferol 3-O-feruloyl-caffeoyl-sophoroside-7-O-glucoside
12.02
1075.26
0.00
2.37
1.24
39
Lippioside I
1.20
292.07
0.05
2.35
1.23
40
L-Tryptophan
2.10
268.10
0.03
2.94
1.56
41
LysoPE(20:1(11Z)/0:0)
15.12
1059.66
0.00
2.14
1.10
42
N(tele)-methylhistaminium
5.96
171.10
0.00
2.16
1.11
43
N-Acetylhistidine
1.61
232.05
0.01
2.04
1.03
44
N-Acetyl-L-glutamyl 5-phosphate
4.97
305.98
0.02
2.44
1.29
45
N-Succinyl-2-amino-6-ketopimelate
1.56
866.23
0.05
2.81
1.49
46
Oxoadipic acid
1.15
379.09
0.01
2.20
1.14
47
Oxoglutaric acid
7.00
337.04
0.03
2.12
1.08
48
PC(20:3(8Z,11Z,14Z)/P-18:0)
16.71
830.59
0.02
2.67
1.42
49
PC(P-18:0/20:3(5Z,8Z,11Z))
15.83
830.58
0.02
2.88
1.53
50
PE(18:0/20:2(11Z,14Z))
14.72
816.57
0.01
2.30
1.20
51
Physcion 8-gentiobioside
17.02
653.15
0.01
2.04
1.03
52
Pyranocyanin B
19.98
1019.25
0.02
2.05
1.03
53
Pyridine
6.28
203.08
0.01
2.42
1.27
54
Pyrophosphate
0.65
414.90
0.00
2.06
1.04
55
Selenohomocysteine
0.69
362.94
0.00
2.18
1.12
56
TG(18:0/20:0/20:1(11Z))
0.72
979.84
0.01
2.10
1.07
57
Trans-2-all-cis-6,9,12,15,18,21-tetracosaheptaenoyl-CoA
17.58
1148.33
0.01
2.44
1.29
58
Trypanothione disulfide
14.39
766.28
0.00
2.05
1.03
59
Vestitone 7-glucoside
0.76
867.32
0.00
2.40
1.26
Number
Compound name
Retention Time
Mass
p value
(B vs A)
FC
(B vs A)
Log FC
(B vs A)
1
(15Z)-tetracosenoate
15.07
729.67
0.00
2.46
−1.30
2
(9Z)-9-Octadecenamide
18.45
621.56
0.00
2.36
−1.24
3
(R)-2′,4′,7-Trihydroxy-3′,8-diprenylisoflavan
10.01
431.16
0.05
2.10
−1.07
4
(R)-3-Hydroxydodecanoic acid
11.07
181.16
0.00
2.12
−1.08
5
(S)-3-Hydroxytetradecanoyl-CoA
18.40
1038.27
0.02
3.05
−1.61
6
11-Dodecenoic acid
11.05
163.15
0.00
2.04
−1.03
7
11Z,14Z,17Z-eicosatrienoyl-CoA
19.92
1100.34
0.01
3.33
−1.74
8
3-Dehydroquinic acid
6.57
107.02
0.03
2.19
−1.13
9
8-Hydroxy-5,6-octadienoic acid
1.15
121.06
0.03
2.28
−1.19
10
9-Hexadecenoylcholine
14.45
404.33
0.02
2.15
−1.10
11
Alkaloid RC
17.65
595.19
0.02
2.26
−1.18
12
Alpha-hydroxyalprazolam
6.51
369.05
0.05
2.89
−1.53
13
Betavulgaroside VII
7.08
775.38
0.00
2.38
−1.25
14
Chrysophanol 1-tetraglucoside
1.15
867.25
0.01
3.27
−1.71
15
Cysteinyl-Glutamine
15.54
557.17
0.01
2.18
−1.12
16
D-4′-Phosphopantothenate
15.35
657.16
0.01
2.42
−1.28
17
DG(15:0/16:0/0:0)
14.94
1107.99
0.04
2.01
−1.01
18
DG(22:0/22:6(4Z,7Z,10Z,13Z,16Z,19Z)/0:0)
16.43
788.61
0.04
2.62
−1.39
19
DGDG(25:0/26:2)
19.48
1199.85
0.00
2.07
−1.05
20
Dinonylnaphthalene
14.22
1140.04
0.00
2.26
−1.17
21
dTDP
11.92
438.97
0.00
2.59
−1.37
22
dTDP-4-acetamido-4,6-dideoxy-D-galactose
14.87
1177.20
0.01
2.34
−1.23
23
dUMP
7.33
344.99
0.01
5.82
−2.54
24
Ganglioside GQ1c (d18:1/24:0)
12.39
849.75
0.03
2.42
−1.27
25
Guanidoacetic acid
6.51
162.02
0.03
2.57
−1.36
26
Hexyl 3-mercaptobutanoate
0.74
249.12
0.00
2.88
−1.53
27
Hydroxyprolyl-Arginine
6.47
619.31
0.02
2.94
−1.56
28
LysoPC(22:5(4Z,7Z,10Z,13Z,16Z)/0:0)
16.18
1183.69
0.00
2.19
−1.13
29
Malvidin 3,5-diglucoside
16.80
655.15
0.00
2.57
−1.36
30
Menthone 1,3-glyceryl ketal
11.35
193.16
0.00
2.25
−1.17
31
N-[(4E,8Z)-1,3-dihydroxyoctadeca-4,8-dien-2-yl]hexadecanamide 1-glucoside
17.33
662.54
0.00
2.02
−1.01
32
Oxepahyperforin
16.87
517.37
0.00
2.12
−1.09
33
PE(24:0/22:4(7Z,10Z,13Z,16Z))
13.77
924.65
0.02
2.43
−1.28
34
PG(16:0/18:3(9Z,12Z,15Z))
19.71
789.46
0.01
2.70
−1.44
35
PGP(18:3(9Z,12Z,15Z)/18:0)
0.81
887.47
0.03
2.03
−1.02
36
Polystyrene sulfonate
5.65
413.04
0.05
2.49
−1.31
37
Pseudoecgonyl-CoA
13.68
969.18
0.01
2.59
−1.37
38
Stearidonoyl CoA
18.42
1089.32
0.00
2.92
−1.55
39
Tetracosapentaenoic acid (24:5n-6)
0.79
1073.86
0.03
2.34
−1.23
40
Tetragastrin
1.16
641.22
0.04
2.68
−1.42
41
Tetrahydro-6-(2-hydroxy-16,19-dimethylhexacosyl)-4-methyl-2H-pyran-2-one
14.65
559.45
0.04
2.30
−1.20
42
Trihexosylceramide (d18:1/24:0)
17.62
1199.81
0.00
2.08
−1.05
43
Vaccinoside
9.74
1131.32
0.00
2.23
−1.16
3.2 Analysis of pathways of dysregulated metabolites in TBI-mice model
An analysis of notably dysregulated metabolites (n = 102) revealed that majorly influenced pathways are those involved in the metabolism of glycerophospholipids (GPL), linoleic acid (LA), glycine, serine, threonine, pyrimidine, tryptophan, and nicotinate and nicotinamide (illustrated in Fig. 2).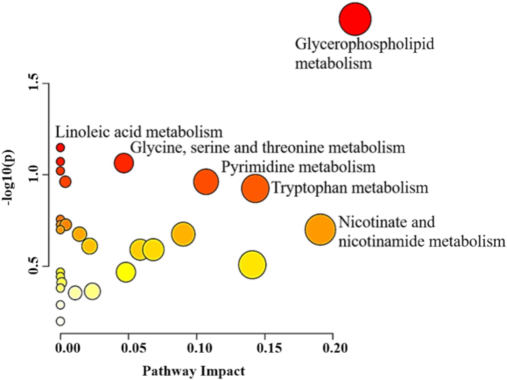
Pathway assessment for important metabolites (n = 102) dysregulated in mice model of TBI. The plot of pathways analysis demonstrates primary metabolic pathway involved in the differences derived on 102 significantly dysregulated metabolites.
3.3 Potential biomarkers in mice model with TBI
A multivariate exploratory ROC analysis was conducted using PLS-DA to classify and rank significantly dysregulated metabolites (n = 102) between TBI mice and the control group. By focusing on top highlighted ten metabolites, the exploratory ROC curves achieved a high differentiation and detection confidence for TBI mice than reference group, with an AUC of 0.995 (Fig. 3A). The frequency plot in Fig. 3B illustrates remarkable characteristics of metabolites that have been positively identified.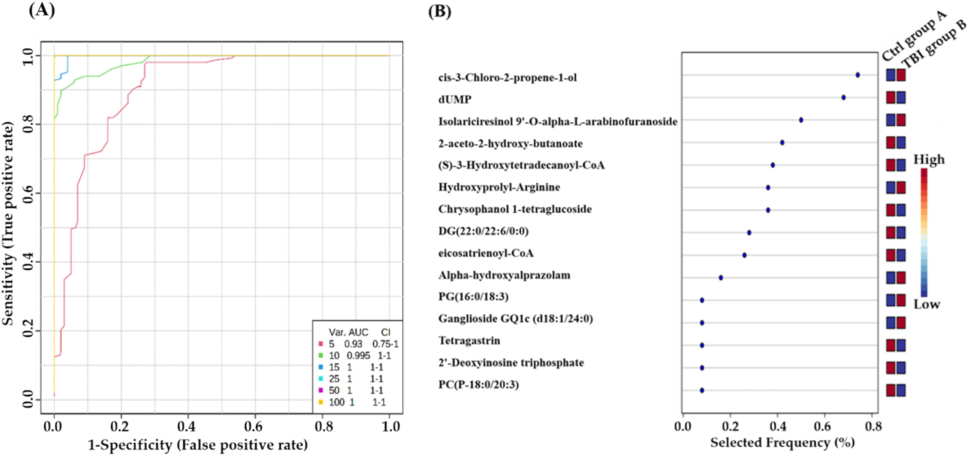
Biomarkers evaluation between TBI and control groups: (A) Generation of an exploratory ROC curve through PLS-DA model, calculating the values of AUC from metabolic combinations of 5, 10, 15, 25, 50, and 100. (B) Representation of frequency plot of 15 metabolites that have been positively identified. (Group A: control mice, Group B: TBI mice).
Significantly dysregulated biomarkers in TBI mice are shown in Fig. 4. For instance, Isoleucyl-asparagine and 2′-Deoxyinosine triphosphate (dITP) were up-regulated, with AUC values of 1 and 0.944 respectively, as seen in Fig. 4A and 4B. Moreover, Diglycosyl diacylglycerols (DGDG)(25:0/26:2) and Phosphatidylethanolamine (PE)(24:0/22:4) were downregulated, with AUC values of 1 and 0.819 respectively, as shown in Fig. 4C and 4D.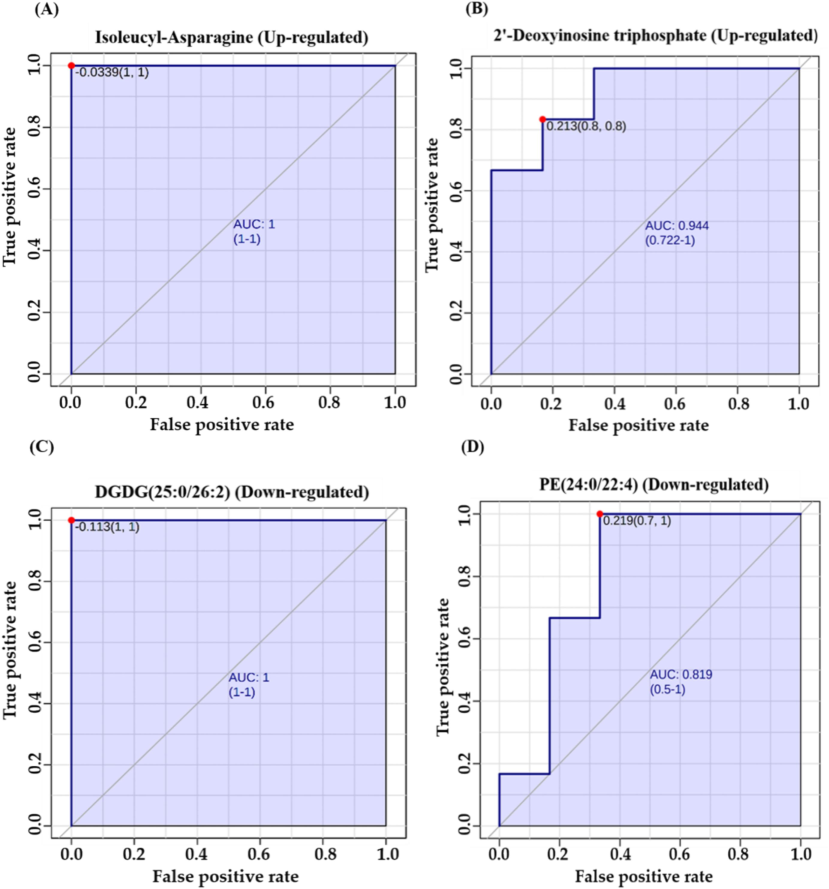
(A, B) Representative Area Under Curve (AUC) for markedly dysregulated metabolites. Examples include two significantly upregulated metabolites: Isoleucyl-Asparagine with an AUC of 1 and 2′-Deoxyinosine triphosphate with an AUC of 0.944. (C, D) Representative AUC are shown for two notably down-regulated metabolites: Diacylglycerol (DGDG (25:0/26:2)), AUC = 1, and Phosphatidylethanolamine (PE (24:0/22:4)) with an AUC of 0.819.
4 Discussion
In this study, metabolomics profiling using LC-MS analysis was used to explore the metabolomics alterations associated with TBI in the animal model and to obtain a comprehensive view about biochemical pathways entailed in the TBI progression. Our findings revealed 102 dysregulated metabolites related to different biochemical pathways. This follows previous metabolomics and lipidomics clinical and experimental animal models of TBI, which pointed to a complex pattern of alterations in various metabolites in TBI (Bahado-Singh et al., 2016.; Orešič et al., 2016; Thomas et al., 2022; Zhang et al., 2021). The outcome obtained in this research study about pathway analysis indicated that TBI is associated with a dysregulation of lipids metabolisms, including GPL and LA pathways. In addition, levels of several lipids classes such as DGDG, PE, lysophosphatidylcholine (LPC), phosphatidylglycerol (PG), phosphatidylglycerol phosphate (PGP), triglyceride (TG) were dysregulated in our TBI model. It has been reported that the cellular events in TBI involve a massive influx of calcium into neuronal cells and, thus, activation of calcium-dependent phospholipases that degrade membrane lipids and release free fatty acid (FFA) and diacylglycerol (DG) (Xiong et al., 2013). Moreover, choline, an essential lipid component of cell membrane phospholipids and precursor for the neurotransmitter acetylcholine, was reported to be significantly decreased in the TBI model, suggesting the repair of membranes and synaptic integrity in TBI (Chitturi et al., 2018). In addition, human studies indicated that choline phospholipids are some of the most powerful predictors of TBI outcomes in patients and inversely associated with TBI severity (Thomas et al., 2022).
A polyunsaturated fatty acid (PUFA) precursor to oxidize metabolites is termed as Linoleic acid (LA) (Hennebelle et al., 2017). It was shown to be involved in red blood cells and hemoglobin damage through oxidative mechanisms (Yuan et al., 2015). In addition, studies that used TBI animal models indicated that LA and its oxidized derivatives have a role in response to ischemia-induced brain injury by regulating neurotransmission in the brain. Our findings showed that several oxidized PUFAs were dysregulated in TBI mice. For example, the levels of hydroxylated fatty acids, including 3-Hydroxydodecanoic acid and 8-Hydroxy-5,6-octadienoic acid, were down-regulated in our TBI model. These findings would provide insight into targeting GPL and LA metabolism pathways that might be relevant for TBI–diagnosis and treatment.
Moreover, our results indicated increased levels of oxidative energy and mitochondrial metabolism-related metabolites such as glycolic acid, oxoglutric acid, and 3-phospho-hydroxypyruvate in plasma samples of TB1 mice. On the contrary, Chitturi et al. reported decreased metabolic concentrations in brain extract samples of the TBI rat model using targeted LC/MS analysis (Chitturi et al., 2018). It is worth mentioning that Chitturi et al., performed a targeted LC/MS approaches on brain tissue samples while we used untargeted LC/MS analysis of plasma samples of the TBI mice model.
Among our metabolomics profiling results were dipeptides (i.e isoleucyl-asparagine, cysteinyl- glutamine, and gamma-glutamylvaline) and amino acids (i.e tryptophan), and amino acids-related metabolites (i.e N-Acetyl-L-glutamyl 5-phosphate and N-Acetylhistidine). In addition, some amino acid pathways were significantly disrupted in the TBI mice model, including pathways for glycine, serine, threonine, and tryptophan metabolisms. Free amino acids and amino group-containing drug component play an essential metabolic roles in different brain physiological role, particularly in neuronal growth and circuitry development, cellular energy metabolism, and controlling neurotransmission (Amorini et al., 2017; He and Wu, 2020). Clinical studies have investigated the levels of amino acids in different bio-fluids as possible TBI diagnostic and monitoring biomarkers. For instance, the excitatory amino acids concentrations, including glutamate, aspartate in CSF, were elevated in severe TBI patients as compare to healthy controls (reference group) (Hong et al., 2001). Together with glutamine, the concentration of glycine, serine, and histidine in CSF were notably increased in TBI affected individual with subarachnoid hemorrhage as compared to reference group (Jung et al., 2013).
In contrast, limited pre-clinical trials have examined amino acid levels in TBI animal models. A multivariate systematic survey was conducted on an animal model using a combination of plasma amino acids to estimate a robust and sensitive biomarker for acute TBI diagnosis, and glycine, taurine, and ornithine were reported to be optimal for TBI diagnosis (Hajiaghamemar et al., 2020). A recent study utilized an isocratic high pressure liquid chromatography along with electrochemical detection technique to measure various free amino acids and neurotransmitters following TBI in rats. The concentrations of free amino acids decreased after 4 h of TBI in both the cortex and hippocampus, and the levels of neurotransmitters did not change (Norris et al., 2023). On the other hand, plasma concentrations of non-essential amino acids including glutamine (Gln), arginine (Arg), alanine (Ala), proline (Pro), tyrosine (Tyr), phenylalanine (Phe), and Branched-chain amino acids (BCAA) were significantly increased in the TBI animal model on 3 to 7 days after injury (To et al., 2023). It is worth reemphasizing that the measured levels of an amino acid in the brain tissue and CSF might differ from those measured in serum or plasma, as the former depends on the amino acid transporting mechanism across blood–brain barrier (BBB).
Our data also provided an important insight into cellular and, particularly, nuclear-related events in TBI. It showed a significant dysregulation in pyrimidine, nicotinate, and nicotinamide metabolism pathways. Pyrimidines (uracil, cytosine, and thymine) are nitrogen-containing carbon ring structures and are essential precursors for ribonucleotide and deoxyribonucleotide bases in RNA and DNA, respectively. Uridine 5′-monophosphate (UMP), the initial metabolite produced in the de novo pyrimidine biosynthetic pathway, undergoes further transformation into various pyrimidine nucleosides (Wang et al., 2021). Our results reported a significant down-regulation in dUMP and deoxythymidine triphosphate (dTDP) levels in TBI mice.
Moreover, the frequency plot analysis showed a high frequency of dUMP dysregulation in the TBI versus the control group. Recent work has pointed to the neuroprotective effect of both thymidine and 2′-deoxyuridine for inducing brain injury by using an experimental model. It has been shown that these pyrimidine nucleotides decreased activation of microglial and damage due to oxidative stress through altering glycolytic pathway (Liu et al., 2022). Therefore, the dysregulation in the pyrimidine pathway, associated with reduced levels of dUMP and dTDP, previously mentioned in our study, is consistent with these recent findings. Moreover, Bahado Singh et al., found that adenosine monophosphate, nicotinamide adenine dinucleotide (NAD + ), adenosine diphosphate (ADP), and inosine monophosphate (IMP) were major distinguishing metabolites in the brain tissue between TBI and control. Also, the same research group reported variant TBI effects on the metabolites in cerebral tissue against those in serum (Bahado-Singh et al., n.d.). Our findings indicated that 2′-Deoxyinosine triphosphate (dITP) achieved outstanding functioning for screening of TBI with an AUC = 0.944. Therefore, it would be a potential putative biomarker distinguishing TBI.
The primary limitation of this study was small sample size of animal (n = 12). In addition, the investigated metabolomics changes are related to the observed acute brain injury induced in the animal model, thus limiting our speculations about secondary injury development observed in humans. On the other hand, using an animal model in TBI research would provide a relatively homogeneous type of head injury while controlling the presence of confounding factors that cannot be excluded in clinical settings.
5 Conclusion
This metabolomics study pointed to the biochemical and metabolomics changes in the serum of the TBI-induced animal model. Several dysregulated metabolites with different biological functions were identified in this study. In addition, significantly affected biochemical pathways were determined. These findings provide a potential clinical insight into the TBI research, particularly in developing potential biomarkers for diagnosis and assessing the progress of TBI.
Institutional Review Board Statement: “The study was approved by the Research Ethics Committee at King Saud University, Kingdom of Saudi Arabia with the approval (KSU-SE-23–65)”.
Informed Consent Statement: “Not applicable.”.
Funding.
This research was funded by The Deputyship for Research and Innovation “Ministry of Education” in Saudi Arabia, grant number “IFKSUDR_H163”.
CRediT authorship contribution statement
Faleh Alqahtani: Writing – review & editing, Writing – original draft, Resources, Funding acquisition, Conceptualization. Thamer H. Albekairi: Supervision, Project administration, Funding acquisition. Shereen M. Aleidi: Writing – review & editing, Writing – original draft, Visualization, Formal analysis. Reem H. AlMalki: Writing – review & editing, Visualization, Software. Yousif S. Mohamed Ali: Writing – review & editing, Methodology, Investigation. Mohammed M. Almutairi: Writing – review & editing, Validation. Musaad A Alshammari: Writing – review & editing, Data curation. Abdullah K. Alshememry: Writing – review & editing, Writing – original draft. Anas M. Abdel Rahman: Software, Methodology.
Acknowledgments
The authors extended their appreciation to the Deputyship for Research & Innovation, “Ministry of Education” in Saudi Arabia for funding this research work through the project number “IFKSUDR_H163”.
Declaration of competing interest
The authors declare that they have no known competing financial interests or personal relationships that could have appeared to influence the work reported in this paper.
References
- “Omics” in traumatic brain injury: novel approaches to a complex disease. Acta Neurochir. (wien). 2021;163:2581-2594.
- [CrossRef] [Google Scholar]
- A distinctive human metabolomics alteration associated with osteopenic and osteoporotic patients. Metabolites. 2021;11:628.
- [CrossRef] [Google Scholar]
- Obesity connected metabolic changes in type 2 diabetic patients treated with metformin. Front. Pharmacol.. 2021;11
- [CrossRef] [Google Scholar]
- Severity of experimental traumatic brain injury modulates changes in concentrations of cerebral free amino acids. J. Cell. Mol. Med.. 2017;21:530-542.
- [CrossRef] [Google Scholar]
- Serum metabolomic markers for traumatic brain injury: a mouse model. Metabolomics. 2016;12
- [CrossRef] [Google Scholar]
- Diagnosing level of consciousness: the limits of the glasgow coma scale total score. J. Neurotrauma. 2021;38:3295-3305.
- [CrossRef] [Google Scholar]
- A state-of-the-science overview of randomized controlled trials evaluating acute management of moderate-to-severe traumatic brain injury. J. Neurotrauma. 2016;33:1461-1478.
- [CrossRef] [Google Scholar]
- Early behavioral and metabolomic change after mild to moderate traumatic brain injury in the developing brain. Neurochem Int.. 2018;120:75-86.
- [CrossRef] [Google Scholar]
- Association between traumatic brain injury and late life neurodegenerative conditions and neuropathological findings. JAMA Neurol.. 2016;73:1062-1069.
- [CrossRef] [Google Scholar]
- Distinctive metabolomics patterns associated with insulin resistance and type 2 diabetes mellitus. Front. Mol. Biosci.. 2020;7
- [CrossRef] [Google Scholar]
- Traumatic brain injury and risk of dementia and alzheimer’s disease: a systematic review and meta-analysis. Neuroepidemiology. 2022;56:4-16.
- [CrossRef] [Google Scholar]
- Using serum amino acids to predict traumatic brain injury: a systematic approach to utilize multiple biomarkers. Int. J. Mol. Sci.. 2020;2020(21):1786.
- [CrossRef] [Google Scholar]
- Metabolism of amino acids in the brain and their roles in regulating food intake. Adv. Exp. Med. Biol.. 2020;1265:167-185.
- [CrossRef] [Google Scholar]
- Linoleic acid participates in the response to ischemic brain injury through oxidized metabolites that regulate neurotransmission. Sci. Rep.. 2017;7
- [CrossRef] [Google Scholar]
- Excitatory amino acids in cerebrospinal fluid of patients with acute head injuries. Clin Chem.. 2001;47(8):1458-1462. PMID: 11468237
- [Google Scholar]
- The metabolomics approach revealed a distinctive metabolomics pattern associated with hyperthyroidism treatment. Front. Endocrinol.. 2022;Lausanne). 13
- [CrossRef] [Google Scholar]
- Global, regional, and national burden of traumatic brain injury and spinal cord injury, 1990–2016: a systematic analysis for the Global Burden of Disease Study 2016. Lancet. Neurol.. 2019;18:56.
- [CrossRef] [Google Scholar]
- CSF and serum biomarkers focusing on cerebral vasospasm and ischemia after subarachnoid hemorrhage. Stroke Res. Treat.. 2013;2013
- [CrossRef] [Google Scholar]
- Thymidine and 2’-deoxyuridine reduce microglial activation and improve oxidative stress damage by modulating glycolytic metabolism on the Aβ25-35-induced brain injury. Arch. Biochem. Biophys.. 2022;729
- [CrossRef] [Google Scholar]
- Quantifying acute changes in neurometabolism following blast-induced traumatic brain injury. Neurosci. Res.. 2023;198:47-56.
- [CrossRef] [Google Scholar]
- Human serum metabolites associate with severity and patient outcomes in traumatic brain injury. EBioMedicine. 2016;12:118.
- [CrossRef] [Google Scholar]
- MetaboAnalyst 5.0: narrowing the gap between raw spectra and functional insights. Nucleic Acids Res.. 2021;49:388-396.
- [CrossRef] [Google Scholar]
- Metabolomics profiling as a diagnostic tool in severe traumatic brain injury. Trauma. Brain Inj. Front. Neurol. 2017;8:398.
- [CrossRef] [Google Scholar]
- The cerebrovascular and neurological impact of chronic smoking on post-traumatic brain injury outcome and recovery: an in vivo study. J. Neuroinflammation. 2020;17:1-18.
- [CrossRef] [Google Scholar]
- Serum metabolome associated with severity of acute traumatic brain injury. Nat. Commun.. 2022;13
- [CrossRef] [Google Scholar]
- Association of sub-acute changes in plasma amino acid levels with long-term brain pathologies in a rat model of moderate-severe traumatic brain injury. Front. Neurosci.. 2023;16
- [CrossRef] [Google Scholar]
- Automated detection and screening of traumatic brain injury (tbi) using computed tomography images: a comprehensive review and future perspectives. Int. J. Environ. Res. Public Health. 2021;18:6499.
- [CrossRef] [Google Scholar]
- Targeting pyrimidine metabolism in the era of precision cancer medicine. Front. Oncol.. 2021;11
- [CrossRef] [Google Scholar]
- HMDB 5.0: the human metabolome database for 2022. Nucleic Acids Res.. 2022;50:D622.
- [CrossRef] [Google Scholar]
- Animal models of traumatic brain injury. Nat. Rev. Neurosci.. 2013;14:128.
- [CrossRef] [Google Scholar]
- Linoleic acid induces red blood cells and hemoglobin damage via oxidative mechanism. Int. J. Clin. Exp. Pathol.. 2015;8:5044-5052. PMID: 26191198
- [Google Scholar]
- UPLC-Q-TOF/MS-based plasma metabolome to identify biomarkers and time of injury in traumatic brain injured rats. Neuroreport. 2021;32:415-422.
- [CrossRef] [Google Scholar]
Further reading
- Metabolomics and Biomarker Discovery in Traumatic Brain Injury.. 2018;35:1831-1848.
- [CrossRef]
- Traumatic brain injury and mitochondrial dysfunction. Am. J. Med. Sci.. 2015;350:132-138.
- [CrossRef] [Google Scholar]
- Inflammation and white matter degeneration persist for years after a single traumatic brain injury. Brain. 2013;136:28.
- [CrossRef] [Google Scholar]
- Chronic white matter degeneration, but no tau pathology at one-year post-repetitive mild traumatic brain injury in a tau transgenic model. J. Neurotrauma. 2019;36:576.
- [CrossRef] [Google Scholar]
- Blood-brain barrier breakdown following traumatic brain injury: a possible role in posttraumatic epilepsy. Cardiovasc. Psychiatry Neurol.. 2011;2011
- [CrossRef] [Google Scholar]
- Models of traumatic brain injury-highlights and drawbacks. Front. Neurol.. 2023;14:1151660.
- [CrossRef] [Google Scholar]
- Plasma metabolomics profiles in rats with acute traumatic brain injury. PLoS One. 2017;12
- [CrossRef] [Google Scholar]
- Cerebral edema in traumatic brain injury: a historical framework for current therapy. Curr. Treat. Options Neurol.. 2020;22
- [CrossRef] [Google Scholar]


