

Translate this page into:
Land value assessment based on an integrated Voronoi-geographically weighted regression approach in Makkah, Saudi Arabia
⁎Corresponding author. yhhassan@kau.edu.sa (Yehia Miky)
-
Received: ,
Accepted: ,
This article was originally published by Elsevier and was migrated to Scientific Scholar after the change of Publisher.
Abstract
Objective
Makkah Al-Mukarramah is the holiest city of the Islamic world because of the presence of the Holy Mosque which is also known as Al-Haram. Due to lodging and business activities around the Holy Mosque, Makkah city has experienced a rapid urban growth and an increase in population. Hence, it is necessary to develop an efficient land value assessment method that takes into account the main factors influencing the prices of land in Makkah.
Methods
This study proposed an integrated Voronoï- Geographically Weighted Regression (GWR). Voronoi diagrams were used to subdivide the space into regions which were generated based on the spatial location of land value input data. Then, the GWR regression equation related to each land value input data was applied to the entire corresponding Voronoï region. The proposed approach ensured a continuous estimation of the prices of land in the whole study area.
Results
Based on the results obtained from this research, the property price in Makkah varies between 4000 SAR/m2 and 14050 SAR/m2 according to the location of the property. Because of the holiness of Makkah, the lands nearest to the Holy Mosque have the highest prices. However, comparison with ground value data showed that there is a variation of percentage between −17% and 22%.
Conclusions
The proposed model overestimated the prices of lands around the Holy Mosque, even though the prices remain higher; this was because the Voronoï-GWR model captured the high demand on lands surrounding the Holy Mosque. Nevertheless, the proposed model underestimated the prices of land in the southern region of the study area because of the presence of mountains with new infrastructures under construction not considered.
Keywords
Voronoï diagrams
Geographically Weighted Regression (GWR)
GIS and Land Value Assessment

1 Introduction
Makkah Al-Mukarramah is the holiest city of the Islamic world. It is an important place because this is where the Holy Mosque which is called Al-Haram is located, this Mosque contains the First House of God Kábah built by prophet Ibrahim and his child Ismail. It is situated in the western part of Saudi Arabia, 80 km inland from the Red Sea at the lower regions of the Hijaz mountain extension. Makkah has developed from a little settlement around the Kábah into a major city spread over a region of roughly 1000 km2 with populace of 1.5 million (Solami et al., 2006). Muslim Pilgrimage to the Kingdom of Saudi Arabia (KSA) is one of the most established and biggest strict religious events on the planet. This is where Muslims from every part of the world gather in KSA each year to perform revere at Al-Haram (Holy Mosques in Makkah and Madinah) and Al-Masha'ir (Mina, Arafat and Muzdalifah). Al-Haram mosque in Makkah has an indoor and open-air outlet; the Mosque is around 356,800 square meters. About 2 million Muslims can worship at once, particularly during the Ramadan (ninth month of the Islamic lunar schedule) and Hajj (twelfth month of the Islamic lunar schedule) (Nizami et al., 2017).
The development of the sacred city of Makkah is an extraordinary model among other urban communities in the world. This city flourishes in a desert region, where there is no water, food or some other human culture. With the consistent development of the city, the territory around the Holy Mosque turns out to be intensely populated and there is an increase in building density (Solami et al., 2006). Geographically, Makkah is secured by various kinds of molten, transformative and sedimentary rocks of Precambrian and lower Paleozoic period. Moreover, there are subordinate sedimentary rocks as well as basaltic magma stream of Tertiary and Quaternary age (Solami et al., 2006).
The majority of the urban development that takes place in the city, most especially the lodging and business improvements, is as a result of the presence of the Holy Mosque, this also impacts the neighboring regions as the rocky landscape on the urban rambling of the city spread across the restricted valleys to the level urban edges (Al Jabri and Alhazmi, 2017). The city has experienced an increase in population and development towards its edges, bringing about further expansion of the regions that surrounds it. Significant developments that took place in the City of Makkah in the previous years have led to acceleration in urban changes. The city of Makkah, most especially around the Holy Mosque and the holy locales of pilgrimage was redeveloped into sets of hotels and stores, which can be considered as the travel industry zone in Makkah. Besides, the neighborhoods have extended outside the travel industry zone, accordingly this urban development is influenced by the pilgrims’ activities (Ascoura, 2013). The area of Makkah and its religious significance affected the city's populace; the increase in population is as a result of regular increase in immigration.
However, Changes in Land use and land Cover (LULC) is essentially adjusting the common biological system and changing the natural landscape. The increase in land cover modification has affected biodiversity and other ecological components (Alqurashi and Kumar, 2019) and it has socio-economic impact on land.
Due to rapid increase in population, urban growth and land cover modifications in Makkah, there is need for land value assessment in Makkah. Indeed, land value assessment is essential to ensure stability in the sales of land, reduce fight speculation and promote the value of land in the city. This process should be based on scientific methods to avoid randomness and enhance realistic valuation. In addition, the expansion of the Holy Mosque in Makkah and improvement of the city infrastructure has caused expropriation of the surrounding lands which requires a fair method for land value assessment. This expropriation has limited the available land around Al-Haram where the price of land has increased due to increase in demand. Therefore, the main objective of this research is to develop an approach for the assessment of the land value in Makkah city using an integrated Voronoï- Geographically Weighted Regression.
2 Land Value Assessment Methods
2.1 Conventional method of land value assessment
The conventional method for land value assessment is the on-site visual assessment technique adopted by local government. This method is time consuming, unreliable, and is not effective in terms of transparency and accuracy (Demetriou, 2017). These deficiencies have inimical effects on planning land valuation, as there is need for some research in order to examine land valuation factors and the quality of this traditional process. To address deficiencies in conventional land valuation process, there is need for the development of a new framework based on advanced spatial analysis techniques such as Multiple Regression Analysis (MRA) and Geographically Weighted Regression (GWR) within GIS environment (Demetriou, 2017). Shortcomings in the conventional method of mass appraisal can be solved by the use of Automated Valuation Models (AVMs) with Geographical Information System (GIS) (Demetriou, 2018). The conventional model depends on some key factors such as physical features, locational characteristics and economic conditions. Analytic Hierarchy Process can be used to produce criteria relative weights according to their influence on the discussed problem (Issa et al., 2019).
Land rent theory shows that unimproved land value is a result of the lands inaccessibility to goods, facilities, transportation, medical assistance, education and other services. In theory therefore, public transport provision which increases accessibility to services should in turn increase land values (Mulley et al., 2018). In land consolidation scheme, two components should be considered; these include the reallocation of land and the provision of rural infrastructure such as roads and irrigation networks.
Valuation is based on consumers’ behavior, which means how they want to spend their money based on their individual preference (Hamilton and Morgan, 2010) according to the principle of supply and demand, it also depends on buyers who are in competition with each other to ensure good utility as much as possible (Demetriou, 2017).
Land value assessment is a very important and risky process around the world, as it involves many aspects of socio-economic life in both the developing and developed countries, this is because it affects the value of real estate property each year which revolves around 1,000 billion euros (Weber, 2004). In land value assessment process, knowledge of neighborhood land and buildings plays a significant role in determining the value of a specific land. Due to incorrect neighborhood breakdown and incorrect land value accredited to neighborhood, there might be bias in the assessment of land value (Ruddock, 2014).
Although the drawbacks of standard valuation process have been pinpointed by some researchers (Jahanshiri et al., 2011), in the case of land consolidation, there are little or no research on land valuation (Yomralioglu et al., 2007) hence, there is need for relevant assessment studies which is focused on land valuation based on the spatial statistical analysis of a real full-scale project (Demetriou, 2017).
2.2 GIS and Hedonic methods
Hedonic model for property pricing was introduced by Rosen in 1974. Since it is based on the actual real behavior rather than intended one, it is considered as the revealed preference method. It does not require previous judgments, comparative prices, or income information as in the conventional methods, it needs some reasonable amount of pricing data in order to determine the value of property (Aladwan and Ahamad, 2019). Generally, the common procedure of hedonic model started with the selection of variables, which is usually a dependent variable and one or more independent variables, this is followed by applying statistical regression method to study property multiple parameters effects on its final price, or in other words the effects of each parameter on the final price, and finally, building the model which is needed to fit the sample data for further value estimations (Li et al., 2013).
There are two main hedonic methods used for regression analysis and estimating the relationships between variables namely: The Ordinary Least Square (OLS) and Geographic Weighted Regression (GWR). OLS is the dominant method in the implementation of regression analysis (Cebula, 2010; Kong et al., 2007; Lozano-gracia and Anselin, 2012; Ottensmann et al., 2008). OLS is considered as a global method that produces constant coefficient over the whole study area and does not take into account the autocorrelation and geospatial effects while, GWR is a local regression method enhances variation of coefficients in a given study area (Bujanda and Fullerton, 2017; Kinabalu et al., 2015; Radoslaw Cellmer, 2011). GWR has the potential of being implemented fully in a GIS environment (Lu et al., 2014). Wang and Li (2020) provide a systematic review of mass appraisal models for nearly two decades and identify a 3I-trend, namely AI-based, GIS-based and MIX-based models (Wang et al., 2020).
Different functional specifications of hedonic equations were found in literatures. The simplest mathematical linear regression was employed by (Kong et al., 2007; Lozano-gracia and Anselin, 2012; Bujanda and Fullerton, 2017, and Zhang et al., 2015). The semi log regression was used by (Cebula, 2010; Kong et al., 2007; Ottensmann et al., 2008; Lehner, 2011, and Randeniya et al., 2017). Alternatively, studies by (Lehner, 2011), and (Paper and Paper, 2013) used the log-log regression. Among these methods, the semi log regression is commonly used in building the computerized hedonic model because of its simplicity in interpreting results, as well as its ability to accept categorical variables (Cebula, 2010; Kong et al., 2007; Ottensmann et al., 2008; Lehner, 2011, and Randeniya et al., 2017).
Some researchers have established the use of Hedonic price method for pricing houses. Zhang et al. (2004), Armstrong and Guez (2006) examined the relationship between different traffic convenient degree and house price (Armstrong and Guez, 2006; Zhang et al., 2004) while, (Wang and Zheng, 2007) analyzed the degrees at which urban public service accessibility influences housing price (Wang and Zheng, 2007). Visser et al. (2008) employed Hedonic price modelling to derive different models of pricing property from which the contribution of the characteristics of the residential environment were estimated (Visser et al., 2008). Meanwhile, city economics researchers mainly focused on the application of Hedonic method to study the external environment influence in pricing houses (Liu et al., 2010). Also, GIS spatial interpolation method was used to get spatial distribution map and contour map of housing price (Mei and Li, 2008). Cellmer et al., (2019) developed an application of Hierarchical Spatial Autoregressive Models for Land Value Maps in Urbanized Areas. (Cellmer et al., 2019). According to
The use of GIS along with the Hedonic approach appeared in work presented by (Schaerer et al., 2008). They employed the Zurich and Geneva Geographic Information System in valuing natural land uses in urban areas of Geneva and Zurich (Schaerer et al., 2008). In the study carried out by Cavailhès et al. (2009), hedonic price models was combined with a GIS-based geographic model to evaluate the price of landscapes of houses in the urban fringe of Dijon, France (Cavailhès et al., 2009). Li et al. (2013) used GIS and Hedonic in the modelling of spatial variation of housing price in Xiamen city, China. They discovered that location characteristic, neighborhood characteristic and building characteristics had significant influence on housing price (Li et al., 2013). Korea et al. (2015) presented a framework that combines Geographic information System (GIS) with Hedonic pricing method in order to improve analysis and determining the value of green spaces with price of houses in Subang Jaya, Malaysia (Korea et al., 2015).
The use of hedonic approaches with GIS has been proved effective for land value assessment. More specifically, the use of the GWR method in a GIS environment enhances the consideration of spatial variations of phenomena that influence prices of land. The GWR method provides only a discrete and local regression equation that corresponds to each input data. However, in order to estimate the price of land in an area of interest, there is need to find a method to apply alongside with local regression equations continuously in the whole area. The selection of GWR method compared with other common methods is due to the advantage of GWR in the perception of the spatial variability of the independent variables.
3 Voronoi-GWR based approach for Land Value Assessment
This paper presents an approach for Land Value Assessment based on the integration of the GWR method with Voronoi diagrams in a GIS environment. Voronoi diagrams are used to subdivide the space into regions that are generated based on the spatial location of each input with its corresponding land price. Thereafter, the regression equation related to the value of each land input data will be applied to the entire corresponding Voronoï region. In this section, the proposed methodology for integrating Voronoi diagrams with GWR for land value assessment is presented in more detail.
3.1 Recall on GWR and Voronoï Diagrams
-
Geographically Weighted Regression (GWR)
Spatial nonstationary is a condition where a basic 'worldwide“ model cannot clarify the connections between certain arrangements of factors. The idea of the model must change over space to mirror the structure contained in the information. Geographically weighted regression attempts to capture this variety by aligning a numerous regression model which permits various connections to exist at various spaces focused (Brunsdon et al., 1996). Geographically weighted regression (GWR) has been broadly used in comprehending the spatially varied connections between socio-economic results and policy investment (Wang and Chen, 2017).
The utilization of Geographically Weighted Regression (GWR) philosophy with prices of land as the dependent variable is clarified by spatially characterized independent variables used in determining the value of land.
Based on geographically weighted regression, parameter evaluation can be made for all the geographical data input characterised by its coordinates, independent variables and dependent variable as shown in the formula below.
With the GWR method, every observation is treated as an individual input at a particular geographic location as required in spatial analysis (Du and Mulley, 2012). A key advantage of GWR modeling is the perception of the spatial variability of the independent variables. Indeed, ordinary regression models (such as Ordinary Least Square) do not take the spatial variability of independent variables into consideration, which may lead to ineffective models (Densmore and Mulley, 2012).
-
Voronoi Diagram:
Voronoi diagram is a data structure which portrays spatial contiguous relations, it was proposed by Russian mathematician Georgy Feodosevich Voronoi in 1908 (Zhang and Li, 2009).
Voronoi diagram (Fig. 1) is originally defined for a set of sites which divides a plane surface into a number of regional planes where each site corresponds to one region (Yaagoubi et al., 2015). These sites may be points, lines or polygons, with (or without) a corresponding weight (Yaagoubi et al., 2015). Voronoi diagram represents the geometric spatial arrangement, the unpredictable spatial distribution of socio-economic variables (for example focal city, rancher's market, stockroom, street limit, Land centroid) may be considered as sites distribution inside Voronoi diagram (Zhang and Li, 2009). Each point on a Voronoi edge is equidistant from the two sites whose corresponding regions share the same boundary. Also, each vertex is equidistant from the nearest three sites that generate Voronoi regions.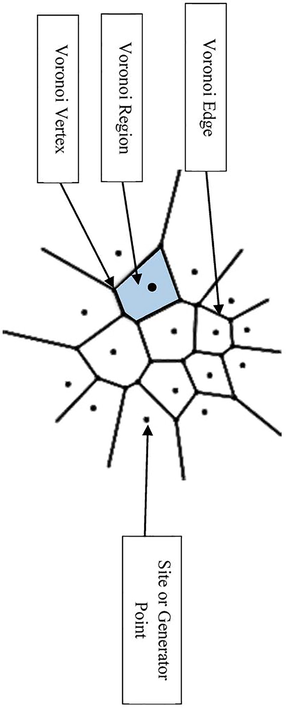
Illustration of A Voronoi Diagram (Yaagoubi et al., 2015)
3.2 Factors influencing the value of land in Makkah
There are several factors that may influence the value of land in Makkah. These factors are classified into socio-economic factors, land policy factors and natural factors. Based on an exhaustive literature review and interviews with experts in land valuation in Makkah, a list of 28 factors were determined. Then, a questionnaire was designed in order to choose the most critical criteria based on the experience of 30 participants (professionals working in the area of Land Valuation in Makkah). The analysis of the questionnaire highlighted 20 factors that appear relevant for land valuation in Makkah as shown in Table 1. A value of 5 corresponds to a strong positive effect on land value, a value of 0 is neutral, a value of −5 corresponds to a strong negative effect. After that, an OLS analysis was carried out based on these 20 factors as independent variables and land price for each input data (11 locations with the corresponding land price) as the dependent variable. OLS is considered as global method that produces constant coefficient over a study area and does not consider the problems of autocorrelation and spatial effects. Through OLS analysis, a detailed report can be gotten on the strength of each factor and the possibility of it being a main factor. Also, all factors that have similar influence are to be considered. Based on the OLS analysis, five factors were considered as statistically significant, these are: Distance from the Holy Mosque, Distance from Masha’er Mina, Distance from sewage network, Distance from main roads, and Distance from shopping centers.
Factors
Mean value
Standard Deviation
Distance from the Holy Mosque
5.00
0.00
Type usage of the property
4.07
0.99
The existence within the boundaries of the Holy Mosque
3.80
1.32
limitation of the number of floors permitted for building.
3.73
1.31
Distance from main roads
3.53
0.88
Distance to the commercial roads
3.40
1.30
Distance from Masha’er Mina
3.33
1.64
Property's location in a regular scheme
3.20
1.07
Distance from electricity service
3.20
1.19
Distance from train station
2.97
1.58
Presence within the urban space
2.90
1.62
Distance from the mosques
2.43
1.58
Number of streets that serve the property
2.33
1.46
Distance to a grocery center
2.27
1.56
Width of roads surrounding the property
2.27
1.65
Distance to the gardens
2.03
1.27
Distance to the schools
1.90
1.79
Distance to shopping centers
1.80
1.68
The impact of distance from water service
1.67
1.44
Distance to sanitation service
1.57
1.35
Distance to the government departments
1.00
1.12
Distance to the hotels
0.67
2.28
Distance from Projects under implementation
0.53
1.58
Distance from gas stations
0.00
2.11
Distance to the government departments
−0.20
1.85
Distance from railway
−2.50
1.62
Presence of the property in a mountainous area
−2.60
1.08
Property's location in an unplanned area
−2.87
1.68
3.3 Implementation of the Voronoi-GWR approach
The importance of the GWR method was presented in section III.a (Recall on GWR and Voronoï Diagrams). This method takes into accounts the spatial distribution of input data, where each input will have its own regression equation. In order to apply these equations for land value assessment over the entire study area, the area should be subdivided based on Voronoï regions defined by each input data (Fig. 2). The regression equation corresponding to each input data will be applied to the corresponding Voronoï region.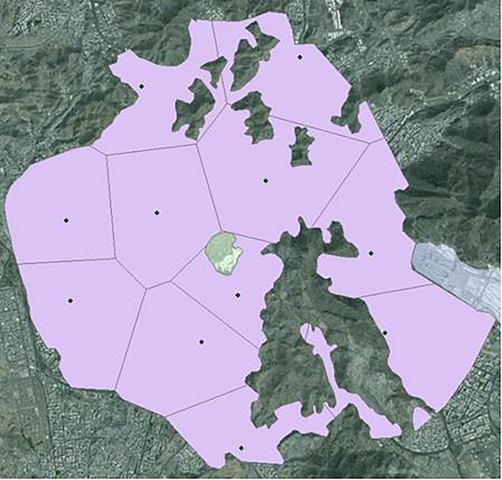
Voronoï regions generated from land value input data in the study area.
Based on the OLS analysis that was used to determine the main factors influencing the price of land in Makkah section 3.2 (Factors influencing the value of land in Makkah), the GWR method was applied on all input data considering only the selected criteria, these include:
-
Criterion 1: Distance from the Holy Mosque.
-
Criterion 2: Distance from Masha’er Mina.
-
Criterion 3: Distance from sewage network.
-
Criterion 4: Distance from main roads.
-
Criterion 5: Distance from shopping centers.
The information in Table 2 summarized the intercept, residual, and the weight of the five criteria for each land value input data.
FID
Shape *
Intercept
Weight_C1
Weight_C2
Weight_C3
Weight_C4
Weight_C5
Residual
0
Point
128214.517745
−21.298214
−4.603225
10.232631
25.595068
7.590018
−5842.1618620
1
Point
128213.070613
−21.299184
−4.603226
10.243444
25.592332
7.593133
−9503.7763490
2
Point
128219.456622
−21.297613
−4.604245
10.216723
25.604374
7.587298
7757.6551700
3
Point
128221.809634
−21.296835
−4.604546
10.205338
25.608818
7.584568
−5563.4993740
4
Point
128224.675180
−21.295608
−4.604812
10.189310
25.614255
7.580434
−4293.0361620
5
Point
128220.392134
−21.296634
−4.604115
10.207012
25.606166
7.584262
−18831.514867
6
Point
128223.457833
−21.295476
−4.604457
10.191043
25.611986
7.580287
8660.1203340
7
Point
128216.617573
−21.298127
−4.603723
10.227177
25.599022
7.589353
−15666.286591
8
Point
128216.970807
−21.297434
−4.603551
10.220995
25.599706
7.587262
2972.4548640
9
Point
128220.876108
−21.296842
−4.604314
10.207525
25.607064
7.584773
−5507.6903310
10
Point
128217.487231
−21.297712
−4.603786
10.221981
25.600667
7.587972
33950.248787
The equation calculated by the GWR method for each land value input data was applied to the corresponding Voronoi region as shown in Fig. 3.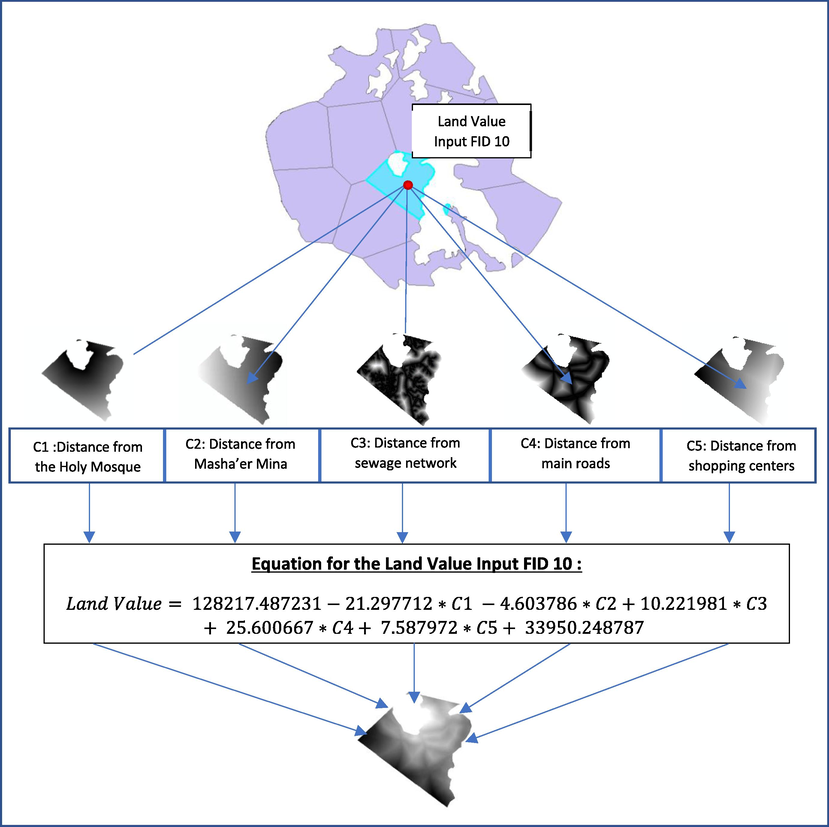
Land Value assessment within a Voronoï region.
After estimating the value of land in each region of Voronoï, these regions were aggregated in order to obtain a global estimate of the price of land in Saudi Ryals (SAR) per meter square over the entire study area as shown in Fig. 4.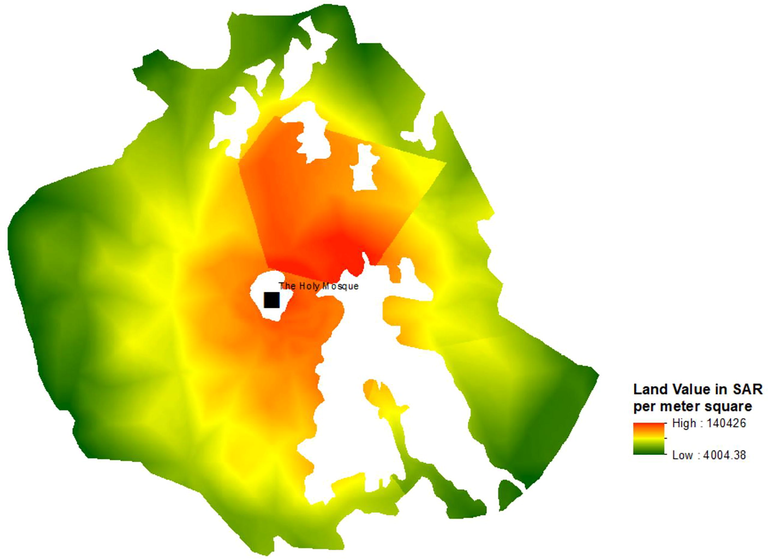
Land Value assessment in Saudi Riyal (SAR) per meter square within the study area.
4 Discussion
Based on the results shown in Fig. 4, lands nearest to the Holy Mosque have the highest prices, especially in the North-North-East region. These prices are justified by the holiness of Makkah. Also, it was noticed that the prices are decreasing as we move away from the Holy Mosque. In addition, the lands that are close to the main roads have a higher value compared to the lands that are not closer to the main roads.
To objectively validate the approach proposed in this study, 10 Land price values were used as validation data. These data were distributed homogeneously across the study area as shown in Fig. 5. The results of the comparison between real prices and those estimated by the Voronoi-GWR approach were summarized in Table 3. The difference is calculated by subtracting the real value from the estimated value. While the percentage is equal to the difference divided by the real value.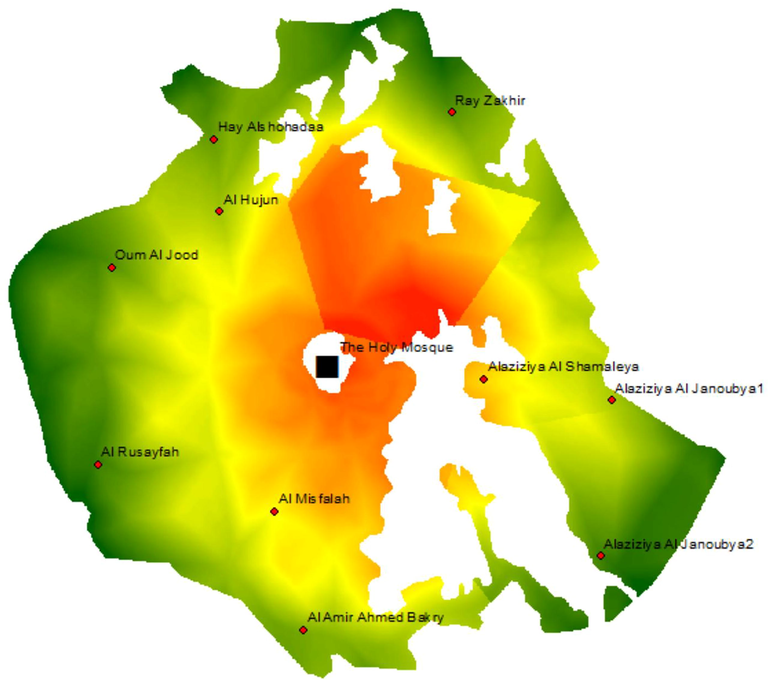
Geographical distribution of validation data in the study area.
OBJECT ID
Real Price
District
Estimated Price
Difference
Percentage
1
76000
Alaziziya Al Janoubya 1
89997
13997
18
2
32000
Alaziziya Al Janoubya 2
26521
−5479
−17
3
67000
Al Misfalah
72493
5493
8
4
24000
Al Amir Ahmed Bakry
20757
−3243
−14
5
34000
Al Rusayfah
38267
4267
13
6
45000
Alaziziya Al Shamaleya
52476
7476
17
7
25000
Oum Al Jood
29503
4503
18
8
44500
Al Hujun
53184
8684
20
9
31000
Hay Alshohadaa
37720
6720
22
10
29500
Ray Zakhir
31373
1873
6
The geographic distribution of the percentage of differences shown in Fig. 6 revealed that the value of land in the areas closer to the Holy Mosque (except for the far northeast) was overestimated by the proposed model compared to the actual reality, despite the high price of land in these areas. This could be justified by the fact that the model captured the high demand of lands that surrounds the Holy Mosque in Makkah. In fact, the City of Makkah is surrounded by the legitimate boundaries of the Holy Mosque in addition to the natural mountains in the City, which occupy more than 70% of the total land mass. This means only 30% of land is meant for residential buildings to keep up with demand. The absence of a regulation to control the number of floors in the buildings within the City also increases the land values.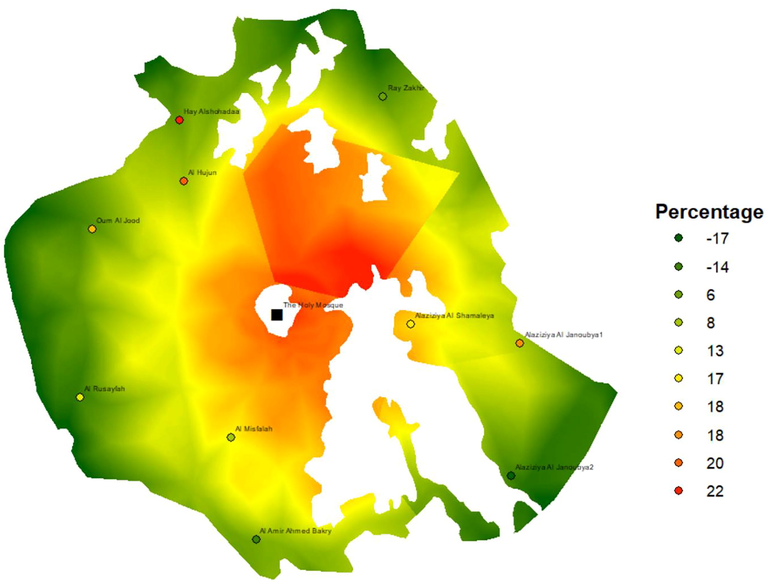
Geographical distribution of the percentage differences between real and estimated prices for validation data.
The absence of new housing plans that meet the needs of middle and low-income groups also influences the real estate market. Moreover, the demand for housing from Makkah’s residents had increased by 54% due to the millions of Muslims flying into Makkah yearly. The decrease in the volume of supply does not correspond with the volume of demand, especially with the establishment of several developmental projects which contributes to the expropriation of more than 20 thousand real estates.
However, it was observed in the southern region that the prices were underestimated by the model. More particularly, In Al Rusayfah region, the recent establishment of train station for the Haramain Train may increase real estate value in this area. This fact was not considered in the model. Moreover, land valuation experts consider Al Rusayfah region and its surroundings as areas that attracts new investments and developmental project. Thus, it was evaluated at higher price than that which was obtained from the proposed model. For Alazizia Al Janoubya 2 region, the location is relatively far from the Holy Mosque, main roads and shopping centers. Also, the existence of Thowr mountain serves as demarcation that prevents the extension of residential buildings towards the Holy Mosque. That could justify the reason for underestimating the values of land in this area by the proposed model.
5 Conclusion and areas for future or further study
In this study, an approach was developed for estimating prices of land by combining Voronoi diagrams with the local regression method GWR. This approach ensured a continuous estimation of the prices of land by applying the GWR local regression equations on the corresponding Voronoi region. The application of this approach to the city of Makkah was revealed to have the potential of Voronoi-GWR integration in Land value assessment. The results obtained indicated that price varies between 4000 SAR/m2 and 14050 SAR/m2. Nearest lands to the Holy Mosque have the highest prices because of the holiness of Makkah.
However, in comparison with ground value data, there is a variation of percentage between -17% and 22%. More particularly, the proposed model overestimated the prices of land around the Holy Mosque, even though the prices remain higher. Hence, it can therefore be concluded that the Voronoï-GWR model captured the high demand of lands surrounding the Holy Mosque in Makkah. Nevertheless, prices of land were underestimated by the proposed model in the southern region of the study area. This was as a result of the presence of mountains with new infrastructures under construction not considered.
It is important to emphasize that the Voronoi-GWR approach was based on the geographic distribution of factors influencing the prices of land as well as a sample of discrete input data that represent the real prices of land. However, the proposed model did not consider the tacit knowledge of real estate appraisers as well as their expertise. Therefore, future studies should develop the use of fuzzy logic and Analytic Hierarchy Process (AHP) for land value assessment in the same study area. Then, a comparison should be made with the results obtained from the use of Voronoi-GWR method.
Acknowledgement
The authors are grateful to Mohamed El-Shaibi, the undergraduate student who implemented the Voronoï-GWR methodology.
Declaration of Competing Interest
The authors declare that they have no known competing financial interests or personal relationships that could influence the work reported in this paper.
References
- Observing and monitoring the urban expansion of Makkah al-Mukarramah using the remote sensing and GIS. J. Eng. Sci. Inf. Technol.. 2017;I(June):103-125.
- [Google Scholar]
- Hedonic pricing model for real property valuation via GIS - a review. Civ. Environ. Eng. Rep.. 2019;29(3):34-47.
- [CrossRef] [Google Scholar]
- An assessment of the impact of urbanization and land use changes in the fast-growing cities of Saudi Arabia. Geocarto Int.. 2019;34(1):78-97.
- [CrossRef] [Google Scholar]
- An evaluation of the accessibility benefits of commuter rail in Eastern Massachusetts using spatial hedonic price functions. Transportation. 2006;33(1):21-43.
- [CrossRef] [Google Scholar]
- Impact of Pilgrimage (Hajj) on the Urban Growth of the Mecca Journal of Educational and Social Research. J. Educ. Social Res.. 2013;3(May):255-264.
- [CrossRef] [Google Scholar]
- Geographically Weighted Regression: Geographical Analysi. 1996;28(4):281-298.
- Impacts of transportation infrastructure on single- family property values. Appl. Econ.. 2017;49(51):5183-5199.
- [CrossRef] [Google Scholar]
- GIS-based hedonic pricing of landscape. Environ. Resour. Econ.. 2009;44(4):571-590.
- [CrossRef] [Google Scholar]
- The hedonic pricing model applied to the housing market of the city of savannah and its savannah historic landmark district. Rev. Reg. Stud.. 2010;39(1):9-22.
- [Google Scholar]
- Application of hierarchical spatial autoregressive models to develop land value maps in urbanized areas. ISPRS Int. J. Geo-Inf.. 2019;8(4):195.
- [CrossRef] [Google Scholar]
- Demetriou, D., 2017. The assessment of land valuation in land consolidation schemes : The need for a new land valuation framework The assessment of land valuation in land consolidation schemes: The need for a new land valuation framework. Land Use Policy, 54(July 2016), 487–498. https://doi.org/10.1016/j.landusepol.2016.03.008
- Demetriou, D., 2018. Automating the land valuation process carried out in land consolidation schemes. Land Use Policy, 75, 21–32. https://doi.org/https://doi.org/10.1016/j.landusepol.2018.02.049
- Densmore, K., Mulley, C., 2012. Accessibility and residual land value uplift : Identifying spatial variations in the accessibility impacts of a bus INSTITUTE of TRANSPORT and LOGISTICS STUDIES The Australian Key Centre in Transport and Logistics Management The University of Sydney. ITLS-WP-12-06 Accessibility.
- Understanding spatial variations in the impact of accessibility on land value using geographically weighted regression. J. Transp. Land Use. 2012;5(2):46-59.
- [CrossRef] [Google Scholar]
- Integrating Lidar, GIS And hedonic price modeling to measure amenity values in urban beach residential property markets. Comput. Environ. Urban Syst.. 2010;34(2):133-141.
- [Google Scholar]
- A decision support model for civil engineering projects based on multi-criteria and various data. J. Civ. Eng. Manage.. 2019;25(2):100-113.
- [CrossRef] [Google Scholar]
- Modeling property rating valuation using Geographical Weighted Regression (GWR) and Spatial Regression Model (SRM): The case of. J. Soc. Space. 2015;11(11):98-109.
- [Google Scholar]
- Kong, F., Yin, H., Nakagoshi, N., 2007. Using GIS and landscape metrics in the hedonic price modeling of the amenity value of urban green space: A case study in Jinan City, China. Landscape Urban Plann. 79(3), 240–252. https://doi.org/https://doi.org/10.1016/j.landurbplan.2006.02.013
- Sustainable Urban Regeneration : GIS and Hedonic Pricing Method in determining the value of green space in housing area. Proc. - Social Behav. Sci.. 2015;170:669-679.
- [CrossRef] [Google Scholar]
- Lehner, M., 2011. Modelling housing prices in Singapore applying spatial hedonic regression.
- Using GIS and Hedonic in the modelling of spatial variation of housing price in Xiamen city. Int. Rev. Spatial Plann. Sustainable Dev.. 2013;1(4):29-42.
- [Google Scholar]
- Study on the spatial distribution of housing price and its influencing factors in Chengdu based on GIS and hedonic model. J. Anhui Agric. Sci.. 2010;38(29):16519-16523.
- [Google Scholar]
- Is the price right ?: Assessing estimates of cadastral values for. Reg. Sci. Policy Pract.. 2012;4(4):495-508.
- [CrossRef] [Google Scholar]
- Geographically weighted regression with a non-Euclidean distance metric : a case study using hedonic house price data. Int. J. Geogr. Inf. Sci.. 2014;28(4):660-681.
- [CrossRef] [Google Scholar]
- Spatial analysis of houses’ price in Dongguan based on Esda and kriging techniques. Econ. Geogr.. 2008;28(5):862-866.
- [Google Scholar]
- Mulley, C., Tsai, C.-H. (Patrick), Ma, L., 2018. Does residential property price benefit from light rail in Sydney? Res. Transp. Econ. 67, 3–10. https://doi.org/https://doi.org/10.1016/j.retrec.2016.11.002
- Developing waste biorefinery in Makkah : A way forward to convert urban waste into renewable energy. Appl. Energy. 2017;186:189-196.
- [CrossRef] [Google Scholar]
- Urban location and housing prices within a hedonic model. J. Reg. Anal. Policy. 2008;38(1):19-35.
- [Google Scholar]
- Spatial heterogeneity in hedonic house price models: the case of Austria. Tinbergen Institute Discussion Paper. 2013;No. 13–171/VIII
- [Google Scholar]
- Spatial analysis of the effect of noise on the prices and value of residential real estates. Geomat. Environ. Eng.. 2011;5(4):13-28.
- [Google Scholar]
- A model to estimate the implicit values of housing attributes by applying the hedonic pricing method housing attributes and hedonic pricing method. Int. J. Built Environ. Sustainability. 2017;4(2):113-120.
- [Google Scholar]
- An empirical analysis of a property tax system: a case study from Brazil. International Association of Assessing Officers 2014
- [Google Scholar]
- Schaerer, C., Baranzini, A., Ramirez, J.V., 2008. Using the Hedonic Approach to Value Natural Land Uses in an Urban Area: An Application to Geneva and Zurich. Économie Publique, 20(1), 147–167.
- Solami, A. A. L., Barakati, G. A. L., Shabbir, A. S., Bahloul, S. A. L., Tunsi, B. A. L., 2006. Engineering geological mapping of the holy city of Makkah Al Mukarramah , Saudi Arabia. IAEG2006: Eng. Geol. Tomorrow’s Cit. (552), 1–10. Nottingham, U.K.
- Residential Environment and Spatial Variation in House Prices in The Netherlands. Tijdschrift Voor Economische En Sociale Geografie. 2008;99(3):348-360.
- [Google Scholar]
- Wang, C.-H., Chen, N., 2017. A geographically weighted regression approach to investigating the spatially varied built-environment effects on community opportunity. J. Transp. Geogr. 62, 136–147. https://doi.org/https://doi.org/10.1016/j.jtrangeo.2017.05.011
- Mass appraisal modeling of real estate in urban centers by geographically and temporally weighted regression: a case study of Beijing’s core area. Land. 2020;9(5):143.
- [CrossRef] [Google Scholar]
- Wang Songtao, Zheng Siqi, F.J., 2007. Spatial accessibility of housing to public services and its impact on housing price: A case study of beijing’s inner city. Prog. Geogr. 26(6), 78-85+147-148.
- Educating Multi-Disciplined Experts in GIS-Based Global Valuation Methods. In: 24th Annual Esri International User Conference. 2004.
- [Google Scholar]
- HybVOR: a voronoi-Based 3D GIS APPROACH FOR CAMERA SURVEILLANCE NETWORK PLACEMENT. ISPRS Int. J. Geo-Inf.. 2015;4:754-782.
- [CrossRef] [Google Scholar]
- Yomralioglu, T., Nisanci, R., Yildirim, V., 2007. An Implementation of Nominal Asset Based Land Readjustment. FIG Working Week, (May 2007), 13–17.
- Influence of traffic passages on housing spatial expansion and local residents’ selection of housing location–a case study of beijing. Sci. Geogr. Sin.. 2004;24(1):7-13.
- [Google Scholar]
- An improved spatial error model for the mass appraisal of commercial real estate based on spatial analysis : Shenzhen as a case study. Habit. Int.. 2015;46:196-205.
- [Google Scholar]
- Application of GIS Combining with Limits of Voronoi Diagram in Socioeconomic Factor of Agricultural Land Grading. IFIP Adv. Inf. Commun. Technol.. 2009;293:423-430.
- [Google Scholar]


